
Rising inflation affects all our living standards. Together with planned tax increases it means that average take-home pay is likely to fall over the coming year. It also raises specific issues for benefits policy. Those on low incomes will tend to find it hardest to tide themselves over during a period in which their real incomes are eroded, which by default is what happens when inflation increases sharply because the major benefits go up in line with a lagged measure of inflation. In April, benefits are set to rise by the rate of general (CPI) inflation in the year to September 2021, which was 3.1%. But according to the latest Bank of England forecasts, inflation in the year to April 2022 is in fact expected to be around 6%.
A particular contributor to rising prices in April will be energy costs. Wholesale prices of gas and electricity increased dramatically during 2021 as the post-pandemic economic recovery continued to pick up pace while European markets were struggling with a number of supply-side problems. UK customers have been protected to a large degree from the immediate effects due to tariff caps set by Ofgem, but these caps were increased by 17% for gas and 9% for electricity in October 2021, and are currently set to increase substantially again in April 2022. The Bank of England expects the caps to increase from their current level by 20% for electricity and 35% for gas, leading to year-on-year energy inflation rates of 31% and 58% respectively in April. Others have predicted even steeper increases.
Figure 1 shows the likely impacts of inflation on different households, given the different sets of things that they spend their money on. It shows two sets of inflation rates. The first are the latest annual rates of inflation (i.e. comparing prices in December 2020 and December 2021) for each tenth of the income distribution, which shows that there are currently very minor differences between the cost increases seen for goods and services that poorer households buy compared to richer households.
The second series shows the likely annual rate of inflation by April (i.e. comparing prices in April 2022 and April 2021), assuming that prices of gas and electricity grow at the rate predicted by the Bank of England, and that the prices of other goods increase such that the overall rate of inflation is 6%. This would lead to a mildly regressive pattern of overall inflation, because, as previous IFS work showed, lower income households spend almost three times as much of their budgets on gas and electricity as the highest-income tenth on average (11% versus 4%). Hence, in April overall inflation facing the lowest-income tenth of households looks set to be about 1.5 percentage points higher than that facing the highest-income tenth. The difference in inflation between all households receiving benefits and all other households is more modest, meaning that a 6% uprating of benefits in line with expected overall CPI inflation would, on average, approximately cover the price rises faced by benefit recipients. But within any group there are some who spend especially large fractions of their budgets on energy and those households will be particularly hard hit.
Figure 1: Average annual rates of inflation to December 2021 and April 2022, by household income decile
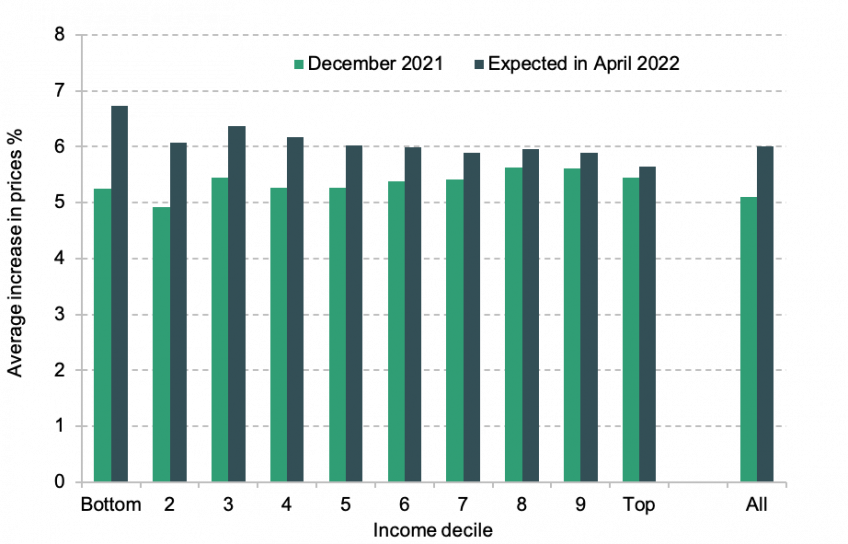
Note: April 2022 predictions assume an increase in prices of gas and electricity of 35% and 20% respectively, and the prices of other goods increase such that the overall rate of inflation is 6%. The inflation rate calculated using LCFS budget shares gives a higher weight to several items that saw rapid price increases, including gas prices, vehicle fuel and second-hand cars. This implies an inflation rate 1.6 percentage points higher than the official CPI in December 2021 and 0.7 percentage points higher than the Bank of England prediction for April 2022. We subtract these differences from the plutocratic mean inflation rates reported here.
Source: Authors' calculations using Living Costs and Food Survey (LCFS) 2019, and consumer prices data from the Office for National Statistics.
Differences in spending patterns are also driving differences in the inflation experienced in different regions. In particular there is a large difference between the experience of those living in London and those living in the rest of the country, with those in London experiencing inflation one percentage point lower than elsewhere. This is largely accounted for by the fact Londoners spend relatively less on motor fuel and transport which are seeing particularly rapid price increases.
Figure 2: Average annual rates of inflation to December 2021 and April 2022, by region
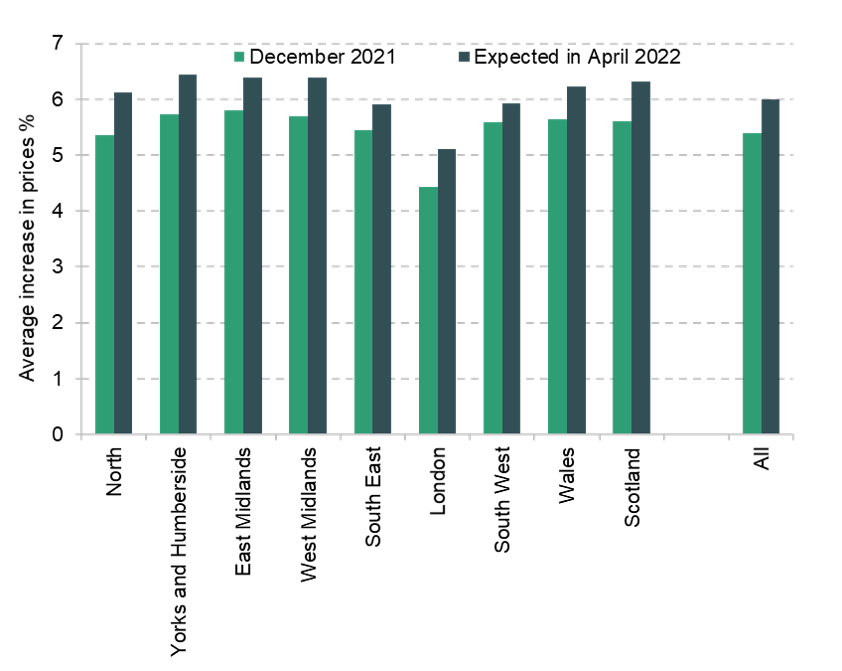
Note: April 2022 predictions assume an increase in prices of gas and electricity of 35% and 20% respectively, and the prices of other goods increase such that the overall rate of inflation is 6%. The inflation rate calculated using LCFS budget shares gives a higher weight to several items that saw rapid price increases, including gas prices, vehicle fuel and second-hand cars. This implies an inflation rate 1.6 percentage points higher than the official CPI in December 2021 and 0.7 percentage points higher than the Bank of England prediction for April 2022. We subtract these differences from the plutocratic mean inflation rates reported here.
Source: Authors' calculations using Living Costs and Food Survey (LCFS) 2019, and consumer prices data from the Office for National Statistics.
The pattern of rising inflation would mean a 3% real cut in benefits year on year (even before accounting for the removal of the temporary £20 per week uplift in Universal Credit, and the equivalent in Working Tax Credit, back in October). Increasing working-age benefits and Pension Credit for those over state pension age by 6%, instead of the default 3.1%, would cost an additional £3 billion in 2022-23. On average it would mean preventing a £290 real fall in benefit income year on year for the 10 million households in receipt of these benefits (excluding those receiving only Child Benefit). This need not mean a permanent increase in benefit expenditure: the government could uprate benefits by a smaller amount in April 2023 than it otherwise would, leaving the long-run size of the benefit system unchanged. Uprating the State Pension by the same 6% rather than 3.1% would increase the cost by a further £1½ billion.
Indeed this could be an opportune moment to change the way that benefits are uprated over the longer term. The issue of real falls in benefit income when inflation rises (and real increases when inflation falls) occurs because benefits increase with a lagged measure of inflation. An alternative would be to use near-term forecasts for inflation to attempt to increase benefits in line with the actual annual rate of inflation that applies at the point of increase. This is what is already done with the uprating of excise duties. For administrative reasons Universal Credit has made it easier to change benefit rates at short notice, which also opens up the possibility of simply waiting until nearer to April before confirming the benefit uprating based on the latest inflation outturns available. For a long time now, with low and stable inflation, this would have seemed like a fairly minor technocratic change. But in the current environment it could make a real difference, and it would reduce the exposure of low-income households to similar problems in future.
An alternative would be to use the inflation rate forecast for the coming fiscal year, accounting for the fact inflation is expected to fall over the Summer. Doing so this year would leave households worse off in April, but would mean benefit levels did not fall in real terms over the year as a whole.
What else could the government do?
Of course the group who may struggle with sudden sharp increases in energy costs is wider than just those on benefits. Many households on middling incomes, and especially those with particularly high energy costs, will not find it easy to adjust to extra costs upwards of £500 per year. But meaningfully compensating even average-income households for a significant increase in costs would not be cheap, especially if the measure were permanent. The total increase in energy costs in April is likely to be in the region of £14 billion on an annual basis unless and until prices fall back.[1] Therefore any mitigation measure will either be very expensive, or provide very partial compensation, or will need to target only a modest subset of those facing higher bills and provide little or no help to others. For example, abolishing VAT on domestic fuel (from its already reduced rate of 5%) would cost around £2.4 billion per year, but on average would give households back less than a fifth of the annual rise in their energy costs. It would target slightly more compensation on those households with particularly high energy costs, which could be seen as an advantage of the policy from the point of view of helping households hit hardest. The other side of that coin is that the tax system would be further encouraging energy consumption relative to other spending even more than it already does – despite the fact that this is an environmentally damaging activity.
This observation has been updated to reflect December 2021 inflation rates.
[1] Calculated using total spending on electricity and gas in the Living Costs and Food Survey 2018–19, together with price increases since then and price increases predicted by the Bank of England for April.
Authors


Heidi Karjalainen
Heidi is a Senior Research Economist in the Retirement, Saving & Ageing sector. Her current research is on pensions and saving for retirement.

Peter Levell
Peter joined in 2009. He has published several papers on the microeconomics of household spending and labour supply decisions over the life-cycle.

Tom Waters
Tom is an Associate Director at the IFS and Head of the Income, Work and Welfare sector.
More from IFS
Understand this issue


Policy analysis


Academic research


