
This morning the ONS announced that CPI inflation rose to 4.2% in the year to October. This is much higher than the previous month’s figure of 3.1%, and is at a level not seen since December 2011. The Bank of England expects inflation to rise further still to 5% in the spring.
When combined with the effects of recent tax changes (including the new social care levy and freeze in the personal allowance), price increases of this magnitude have significant implications for living standards. To take an example, an individual with a salary income of £30,000 in April 2021 (and post-tax income of £24,060) would need to see nominal wage growth of 7.1% to April 2022 to maintain the same standard of living given the forecast 5% annual inflation rate.
The high rate of inflation has been driven by several factors. Demand has increased rapidly following the lifting of Covid-19 restrictions not only in the UK but in other countries as well. At the same time, supply has been constrained by production bottlenecks, staff shortages and, in the UK, new trade barriers following Brexit.
Gas markets provide a stark example of a perfect storm driving price increases. Wholesale gas prices in the UK have hit record highs due to high demand in Asia, last year’s cold winter driving down European gas inventories, and a shortfall in wind-powered electricity supply. Gas and fuel prices were also temporarily low in 2020, as a result of low global commodity prices during the pandemic. Consumers were protected from immediate increases in gas prices this year by Ofgem’s default tariff cap until the end of September, but the latest cap, which was 12% higher than the previous one, came into effect on 1st of October. The increase in gas prices is now reflected in the CPI figures for October published today, showing an increase of 28% compared to the previous year.
Burning natural gas is the largest source of electricity in the UK (accounting for 41% of electricity generation in 2019), and the vast majority of UK households directly rely on gas for heating their homes. It’s therefore not surprising that much media attention surrounding the recent increase in inflation has focussed on household energy bills.
However, the increase in inflation is much more general than this. As Table 1 shows, the other categories of goods and services that have seen the largest increases in prices are transport, hospitality, and furniture and other household durables. Transport prices have increased by 9.9% in particular due to increases in fuel prices and a sudden surge in the price of second-hand vehicles, while the hospitality price increase of 6.3% was driven by the increased cost of restaurant meals and hotel stays. Furniture and other household durables have gone up in price in particular due to global supply issues, as demand for these goods has increased during the pandemic.
Price increases will have different impacts on different households depending on the amounts they spend on different goods and services (i.e. the composition of their “consumption basket”). Table 1 shows that for example for households in the poorest decile, housing costs and food make up almost half of overall spending, whereas for households at the top of the income distribution these account for about a quarter of total expenditure. On the other hand, spending on transport, recreation and hospitality make up 45% of expenditure among the top income decile households, compared to 26% among the bottom decile.
Table 1. Consumer Price Index (12 months to October 2021) by category of goods and Budget shares of spending among households
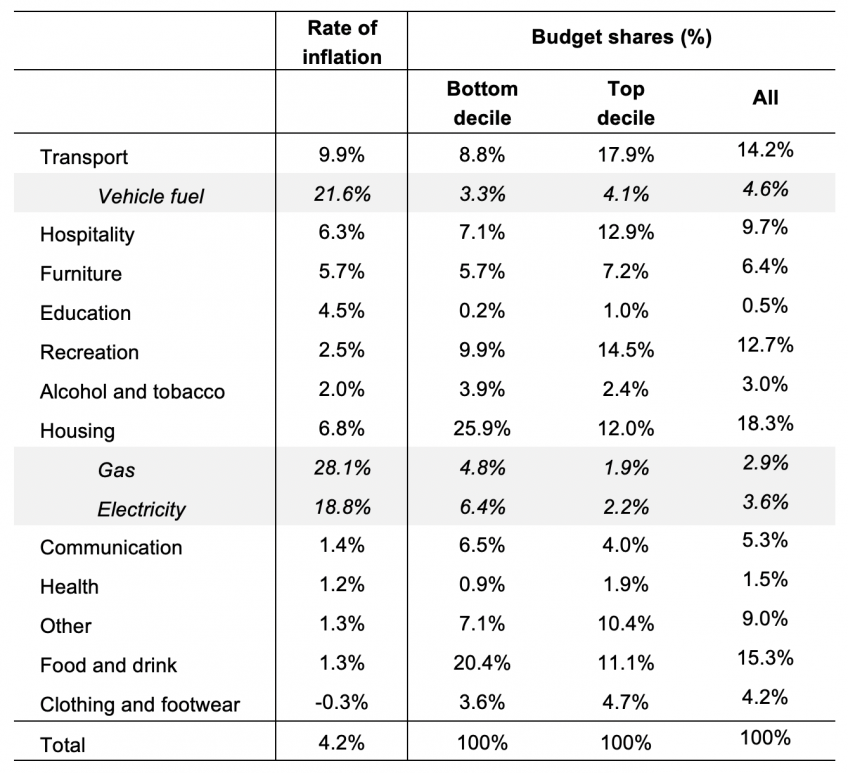
Note and source: Authors' calculations using Living Costs and Food Survey (LCFS) 2019, and consumer prices data from the Office for National Statistics. Shaded rows are sub-categories of spending which are a part of the main category above them. Budget shares are calculated relative to total spending on goods and services covered by the CPI.
Taking these budget shares and the category-specific rates of price increases, we can calculate the inflation rate that each household faces using their budget shares of spending to weight different price changes. The results from this exercise are shown in Figure 1. Here we show the average increase in costs for each income decile based on how much they spend on each category.
Figure 1. Average increase in prices as weighted by budget shares, by income decile
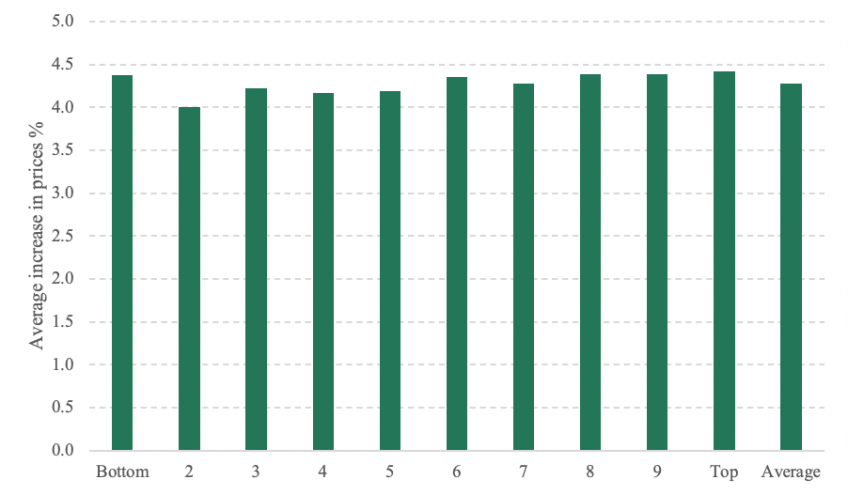
Note and source: As listed below Table 1. Note: The inflation rate calculated using LCFS budget shares gives a higher weight to several items that saw rapid price increases, including gas prices, vehicle fuel and second-hand cars. This implies an inflation rate 1.2 percentage points higher than the official CPI. We subtract this difference from the inflation rates reported here. The ‘average’ inflation rate here still differs slightly from the official CPI because it is an average of household inflation rates (while the official CPI weights implicitly give more weight to higher-spending households).
Price increases have been similar for the basket of goods and services consumed by rich and poor households. We find that while lower income households are indeed hit disproportionately by the increases in gas prices, overall inflation rates are very similar across income deciles. While gas prices affect a smaller proportion of total spending among the high-income households, the inflation that these households face is higher due to increases in transport and hospitality costs.
But there are still reasons to worry that inflation could hit lower income households harder…
Inflation is on average hitting different income groups similarly. But this does not mean we needn’t be concerned, particularly with regard to lower income households.
- Firstly, while the Ofgem cap on tariffs increased by 12% at the start of October, it is likely to rise even more dramatically at the next review. The next cap is meant to come into effect in April 2022, and when it is predicted to increase by 19%. As low-income households spend more of their budget on gas, any future price increases will disproportionately affect these households.
- Secondly, there are large differences in the importance of gas in total budgets within income groups. This is particularly true for lower income households, some of whom devote a much larger proportion of their total spending to gas than others. The average share of spending on gas among the bottom decile of the income distribution is 4.8%, but 10% of households in this decile spend more than 12% of their budget on gas.
- Thirdly, as a result of the huge increases in wholesale gas prices, more than 20 gas suppliers serving over 2 million households have gone bust since August 2021. While the CPI figures for October reflect the increase in Ofgem’s price cap in October, they do not reflect the extra costs for consumers who have been switched to variable rate tariffs after their supplier went bust. While the effect of this on overall CPI is likely to be small it is unclear how the impact of these increased tariffs will differ across different types of households.
- To the extent that price increases are temporary, they will have less impact on households that are better able to postpone their consumption. Higher income households tend to save more, allowing them to cover transitory increases in costs without risking going into debt. They also spend more on goods and services, purchases of which are easier to postpone if prices are only temporarily high (such as for durables and holidays).
- Finally, it should be remembered that the CPI does not cover all forms of expenditure. In particular it includes rental costs but not the costs of housing to owner-occupiers (which are in any case difficult to attribute to different households). The costs of owner-occupied housing are included in an alternative index, the CPIH, and in the RPI which includes the cost of mortgage interest and housing depreciation. Neither the costs of owner-occupied housing nor mortgage interest costs have kept pace with the overall rate of inflation in recent months, which would be to the relative benefit of richer households (who are much more likely to own their homes).
Other households will also be better protected when it comes to increases in prices, especially pensioners who have income sources that are linked to inflation. However, for households receiving benefits, inflation adjustments to these only take place once a year, and the rate of increase is set based on the rate in September of the previous year, so we know that benefits will rise by 3.1% in April 2022. If inflation reaches 5% in April as the OBR and BoE predict, this will result in a real, although temporary, hit for many benefit recipients. Even before April, for many households the wait for the benefit increase may mean a squeeze to current standards of living in the shorter run.
Thus, while the current rates of average price increases are very similar for households of different income levels, as gas prices continue to rise we may expect lower income households to be hit more.
Authors

Peter Levell
Peter joined in 2009. He has published several papers on the microeconomics of household spending and labour supply decisions over the life-cycle.

Heidi Karjalainen
Heidi is a Senior Research Economist in the Retirement, Saving & Ageing sector. Her current research is on pensions and saving for retirement.
More from IFS
Understand this issue


Policy analysis


Academic research


