Downloads
Download data tables
XLSX | 27.62 KB
School spending covers pupils in state-funded schools aged 5–16, as well as pupils aged 16–18 in school sixth forms. In 2018–19, total school spending in England – excluding early years and sixth-form funding – stood at about £44 billion in 2019–20 prices.
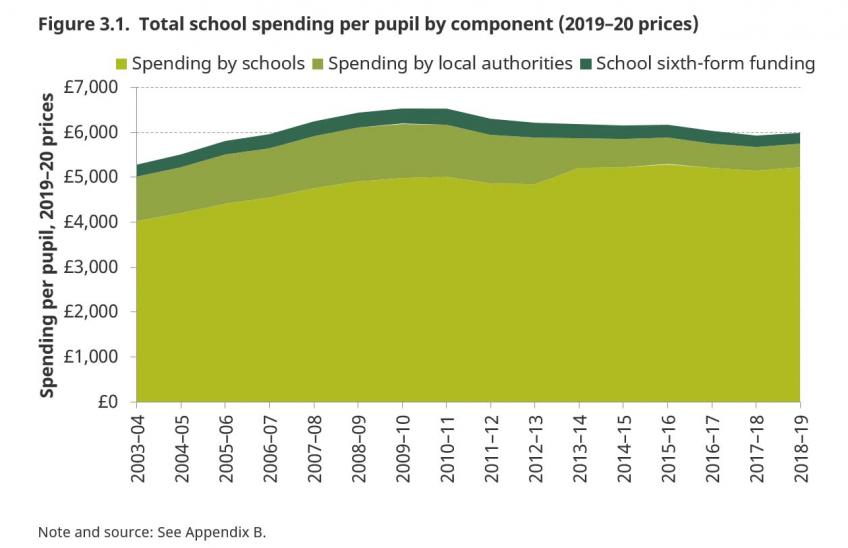
Figure 3.1 sets out how spending per pupil has changed over time, combining spending done by schools; spending done by local authorities on behalf of schools (such as central spending on Special Educational Needs); and sixth-form funding for pupils aged 16 to 19.
On this comprehensive measure of total spending per pupil, there have been cuts of 8% in real terms between 2009–10 and 2018–19. Reversing these cuts would cost £4.7 billion a year by 2022–23.
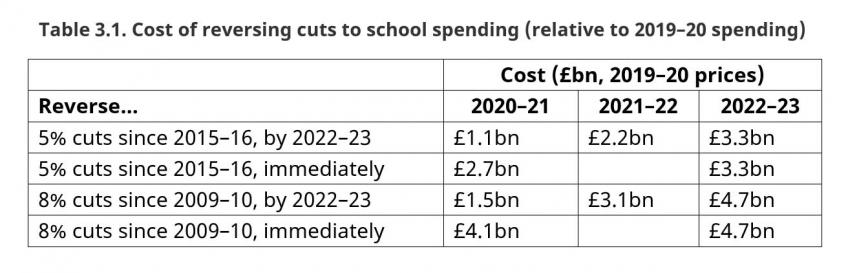
The falls have been fastest since 2015–16; spending per pupil fell by 5% in real terms between 2015–16 and 2019–20, which includes a small fall of 0.5% in 2019–20. Reversing these cuts would cost £3.3bn by 2022–23, or by £2.7bn if done straight away in 2020–21.
Table 3.1 sets out estimates of the cost of reversing past cuts to school spending by 2022-23. We consider the cost of reversing both the cuts of 5% since 2015–16, and the bigger 8% cut since 2009–10. We also analyse two different paths to get there: increasing school spending steadily over the next three years, or reversing the cuts immediately in 2020-21 (and then protecting the new funding level in real terms). The table shows what each of these options would cost over the coming years. All figures are in 2019–20 prices.
Other findings from the school spending chapter include:
- Growth in teacher numbers has failed to keep pace with rising pupil numbers. Whilst primary school teacher numbers have risen by 11% since 2010, pupil numbers have grown by 17%. In secondary schools, teacher numbers have fallen by 20,000 or by just under 10% between 2010 and 2018.
- Teaching Assistant numbers continue to rise in primary schools, by 40% since 2010. TA numbers in secondary schools have fallen by about 13% since 2011.
- Employer pension contributions. This analysis excludes the effect of the rise in employer pension contributions from 16% to 24% of gross salaries, which takes effect for schools from September 2019. Schools will be compensated for this rise in the current financial year. Continuing this compensation beyond this year will cost a further £1.5bn per year on top of any other funding commitments.
- Total school spending per pupil was about £6,600 in Scotland in 2018-19. This is £600 higher than spending per pupil in England (£6,000), with spending per pupil in Wales £200 lower at £5,800. Spending per pupil was lowest in Northern Ireland, at £5,500 per pupil.
This page sets out findings from a pre-released chapter of our annual report on education spending in England. We will launch the report at Church House Conference Centre, London from 10:00 - 12:00 on Thursday 19 September 2019.
Authors

Luke Sibieta
Luke is a Research Fellow at the IFS and his general research interests include education policy, political economy and poverty and inequality.

Christine Farquharson
Christine's research examines inequalities in children's education and health, especially in the early education and childcare sector.
More from IFS
Understand this issue


Policy analysis


Academic research


