
Teacher strikes and concerns about the safety of school buildings have put school spending at the forefront of public debate. In this short piece, we update our analysis of school spending per pupil in England, and likely future trends given the latest economic forecasts and pay offers.
Based on standard measures of inflation typically used in analysis of public spending, school spending per pupil is currently on course to be back above 2010 levels by 2024, with increases over this parliament more than enough to reverse the cuts seen up to 2019. However, we see a very different picture when we analyse the actual costs schools are likely to face, with school funding only increasing by just about enough to keep pace with school costs. In the final section of this comment, we consider the implications of this disconnect.
Reversing past cuts to school spending per pupil
Following a substantial rise over the 2000s, total school spending per pupil fell by 8.5% in real terms in England between 2009–10 and 2019–20. This only includes day-to-day or current school spending per pupil, with larger cuts in school capital spending. This fall in school spending per pupil represents the largest and most sustained cut in school spending per pupil in England in at least 40 years, and probably a lot longer.
The government has set out public spending plans that would deliver large increases in school spending in England, including plans for a £7 billion per year increase in school funding by 2024–25 at the 2021 Spending Review, an extra £2 billion per year in the 2022 Autumn Statement and upwards of £800 million over a full year to cover the costs of a higher teacher pay settlement in schools in England from September 2023. The net result is that the schools budget is expected to increase from £44.4 billion in 2019–20 to £59.6 billion in 2024–25 in cash terms (a total real-terms rise of nearly 15% over five years).
As illustrated in Figure 1, this rise in the schools budget is sufficient to deliver a 13% real-terms rise in school spending per pupil between 2019–20 and 2024–25. If delivered, this would be sufficient to reverse past cuts and take school spending per pupil to 3% more than its previous high-point in 2009–10.
These figures calculate ‘real-terms’ changes based on economy-wide inflation, as captured by the GDP deflator. This is the standard and most consistent way to examine real-terms changes in public spending. To provide further context, Figure 1 also shows expected real-terms changes in school spending per pupil when we instead use an index of actual costs faced by schools (e.g. expected changes in teacher and other staff pay per head, and rising energy, food and other non-staff costs as captured by the Consumer Prices Index (CPI)). See the sources at the end of this comment for details on how this is constructed.
Judged against the likely costs faced by schools, we see a much smaller real-terms rise in school spending per pupil over time (less than 6% between 2019–20 and 2024–25) than when comparing against general inflation (13%). This would leave the purchasing power of school spending per pupil in 2024–25 still about 3% lower than in 2009–10.
As we have previously shown, across long periods of time and in stable economic environments, the GDP deflator tends to provide a close approximation to the costs faced by schools. Schools’ costs and the GDP deflator grew by very similar amounts between 2010–11 and 2019–20. However, we have recently seen a very big spike in inflation, much of which reflects the rising costs of imported energy and food. The GDP deflator does not fully capture import prices as it measures domestic inflation, making it less useful for assessing the cost pressures on public services during such periods.
Figure 1. Total school spending per pupil (actual spending up to 2021–22, projected to 2024–25), 2009–10 = 1
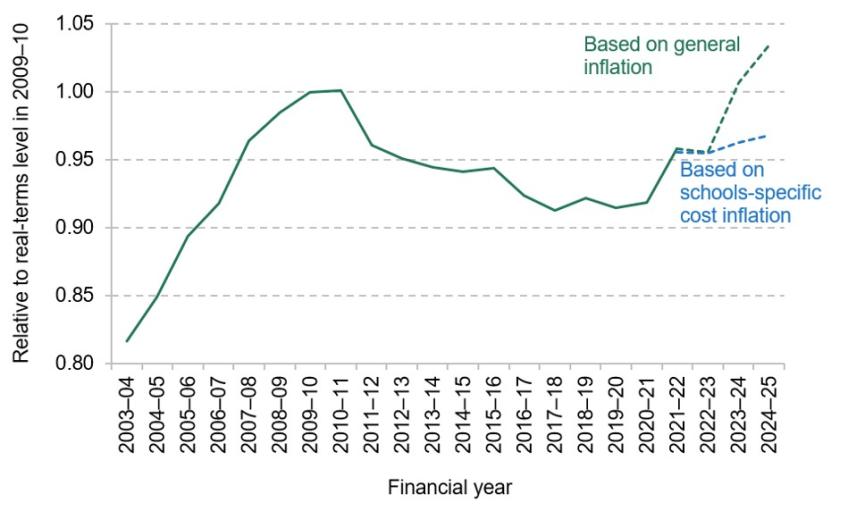
Note and source: See the end of this comment.
Rising costs faced by schools
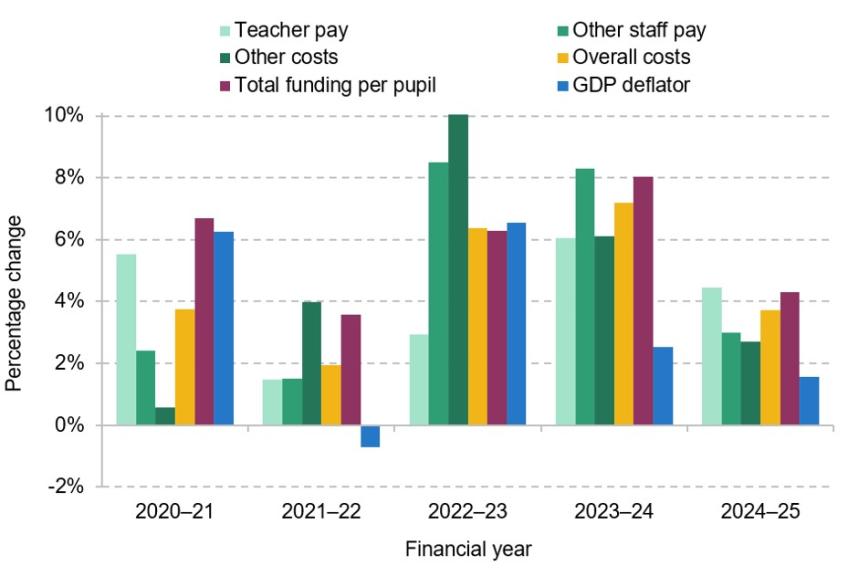
In Figure 2, we unpick what is driving the rise in schools-specific costs. In particular, we show estimated growth in the per-pupil costs of teacher pay (54% of school costs), other staff pay (28% of school costs), non-staff costs (18% of school costs), total costs and total funding per pupil. The growth in costs is measured by financial years to line up with funding changes, so the changes in teacher pay per head are the weighted average over two academic years.
During 2020–21 and 2021–22, school funding per pupil (shown by the purple bars) was growing substantially faster than total costs (the yellow bars). This enabled the real-terms growth in spending per pupil we observe in Figure 1, and was made possible by freezes in public sector pay in 2021, relatively low levels of overall inflation during the pandemic, and the fact that schools were fully compensated for increases in teacher pension costs in 2020–21.
Figure 2. Estimated growth in school costs and funding over time by component
Note and source: See the end of this comment.
From 2022–23, we see much faster growth in school costs. Teacher pay per head started to increase faster as an average pay award of 5.4% was implemented from September 2022 (following on from a freeze in September 2021). However, there are even bigger increases in other staff pay per head (8.5%) and in non-staff costs (10%) in 2022–23. The increases in other staff costs reflects large increases in local government pay levels in order to keep pace with increases in the National Living Wage. The increase in non-staff costs reflects the recent spike in inflation, with schools particularly affected by rapid rises in energy and food prices. Like households, schools have received some government relief on energy costs, but will have still faced much higher energy costs than in previous years. As a net result, both total funding and total school costs were growing by just over 6% in 2022–23. This will have left schools just about breaking even, on average, in 2022–23.
For 2023–24, we see continued fast growth in school costs. Average teacher pay per head is expected to grow by 6% per head (reflecting the combination of the 5.4% pay award in September 2022 and the 6.5% award in September 2023). Other staff have been offered a salary rise of £1,925 from April 2023. This is yet to be agreed, but is likely to translate into an average salary rise of about 8%. This partly reflects large increases in the National Living Wage in April 2023. It could also be argued to be necessary given the tight labour market for school support staff, with competition for staff from retail and hospitality sectors in particular. The Bank of England also currently expects inflation to remain persistently high over the next few years (over 6% in 2023–24), which will drive up non-staff costs for schools. The net result of all these pressures is that we estimate total school costs will grow by 7.2% in 2023–24. As a result of extra funding in the 2022 Autumn Statement and extra funding to cover the higher teacher pay offer from September 2023, we expect school funding to grow by 8% in cash terms in 2023–24. This is clearly a large rise in cash terms, but is only just above the overall growth in costs. The picture in 2023–24 therefore remains tight for schools.
For 2024–25, we have assumed pay offers of 3% for teachers and school support staff (matching the School Teachers’ Review Body (STRB) recommendations in July 2022 for September 2023 as a default assumption). However, this is clearly a source of uncertainty and awards might end up higher, given the continued difficulties recruiting and retaining school staff, and the persistently high level of inflation. For 2024–25, we expect total funding per pupil to grow by 4.3% and total costs to grow by 3.7%.
From 2022–23 onwards, then, we see a consistent picture of total school funding per pupil (the purple bars in Figure 2) only just about growing by more than school costs (the yellow bars). This explains why we see school spending per pupil largely stagnate in real terms after 2022–23 when we account for the costs likely to be faced by schools. The blue bars illustrate just how much lower growth in the GDP deflator is expected to be for 2023–24 and 2024–25. This explains why we observe significant real-terms growth in school spending per pupil from 2022–23 when adjusting for economy-wide inflation using the GDP deflator. This illustrates the importance of using the schools-specific inflation measure to assess real-terms funding changes at the present time.
It is also worth emphasising that these figures represent an estimate of what is happening on average. Within that, there will be significant variation. Some schools will be seeing faster growth in their budgets, and thus able to buy extra resources or staff. However, some schools will be seeing costs grow by more than funding. This will include special schools as they rely more on support staff, who are due to see the biggest pay increases. There will also be variation in when schools feel the pinch most over time. Schools rely more on fixed-price contracts for energy than do households, so will be feeling these significant cost rises at different times.
This is a tighter picture on school funding than we showed in our 2022 annual report on education spending, when we estimated that spending per pupil would be back to 2010 levels even after adjusting for schools-specific costs. This does not reflect the higher teacher pay, which schools were compensated for. Instead, it reflects four main factors. First, we account for estimates of the growing costs of high-need provision (estimated at a total 1.1% by the Department for Education over 2022–23 and 2023–24). Second, support staff pay in 2023–24 is now assumed to grow at 8% instead of 3%. Third, inflation is now forecast to be higher and more persistent, which has increased non-staff costs over 2023–24 and 2024–25. Lastly, actual pupil numbers for January 2023 were about 0.7% higher than most recent forecasts.
What are the implications of this disconnect?
There is clearly a very large disconnect in trends over the last few years in school spending per pupil measured in the standard ways (adjusting for inflation using the GDP deflator) and when we adjust for costs faced by schools. Such a large disconnect can occur in individual years, but to observe such a large difference over three years is unusual from a historical perspective. This itself partly reflects the fact that a large part of the increase in inflation is being driven by import prices, which are not fully reflected in the GDP deflator. Revisions to estimates of economic growth might actually make this gap even bigger when the GDP deflator for past years is also revised. What are the implications for policymakers?
First, it is important that policy and debate fully reflect this disconnect. When policymakers claim that school spending per pupil is growing significantly in real terms and reaching a record high, this is likely to jar with schools’ actual experience. Whilst true using normal measures, this is not the picture schools will recognise when they consider the costs they are likely to face. One concrete way policymakers can reflect this situation is by using the CPI instead of the GDP deflator to capture changes in non-staff costs when analysing school costs, particularly in the analysis and evidence they publish for the STRB. At the very least, the Department for Education should be showing scenarios that reflect both measures. The GDP deflator is currently likely to give a poor measure of changes in non-staff costs faced by schools.
Second, the situation is made worse by the timing of announcements and agreements on salaries. For most recent years, teacher pay salaries have generally been announced in late July, less than six weeks before they are expected to be implemented. Support staff salaries have often been agreed part way through the year in which they are meant to be paid. This has real consequences for schools. It creates huge amounts of uncertainty and concern about what they can afford. It unnecessarily complicates the school funding system by having to create new grants to compensate schools for extra costs (e.g. the Teacher Pay Grant, the Schools Supplementary Grant, the Mainstream Schools Additional Grant and the Teachers’ Pay Additional Grant). These late announcements also lead to controversy about whether government is fully funding any additional costs (it usually is, but it rarely gets credit for this). There are also negative consequences for the devolved administrations, which get even later notice about funding increases, with further consequences for schools in Wales, Scotland and Northern Ireland.
This situation can and should be improved. The government should adjust the process for agreeing teacher pay so that final decisions are published in March of each year. The process for agreeing support staff pay also needs to be brought forward significantly, which would require better coordination between central government, local government and relevant trade unions. These agreed figures can then be reflected in government analysis of costs likely to be faced by schools and school funding announcements (usually in July). This would not totally solve the problems as schools may need extra funding to cover any unexpected costs between September (when pay rises kick in) and the next April (when the financial year starts). However, giving schools more notice and making this a standard part of the system would enable better financial planning. As seen this year, there is also the potential for industrial disputes and for sudden economic changes. This may call for late adjustments to salaries or funding, but these should be the exception rather than the norm.
Notes and sources for figures
Figure 1: Cash-terms spending per pupil taken from Drayton et al. (2022). Cash-terms spending per pupil forecast from 2021–22 based on figures for the core schools budget published in the 2021 Spending Review and Autumn Statement 2022 and figures provided by the Department for Education. General inflation based on HM Treasury, GDP deflators, June 2023. Schools-specific cost index based on cost assumptions set out in Figure 2.
Figure 2: Years refer to financial years starting each April. ‘Teacher pay’ figures are based on a weighted average of paybill per head growth of 2.75% in September 2019, 3.1% in September 2020, 0% in September 2021, 5.4% in September 2022, 6.5% in September 2023 and an assumed 3% in September 2024. Assumed pay drift of 0.2% in 2021–22, –0.2% in 2022–23 and zero for all other years. Increase in teacher costs includes the rise in employer pension contributions from September 2019. Pay per head figures do not include the temporary Health and Social Care Levy during 2022–23. Figures taken from or estimated from Department for Education schools’ costs notes: 2020 to 2021, 2021 to 2024 and 2022 to 2024 (https://www.gov.uk/government/publications/schools-costs-technical-note) and STRB recommendations for 2022 and 2023 (https://www.gov.uk/government/publications/school-teachers-review-body-32nd-report-2022 and https://www.gov.uk/government/publications/school-teachers-review-body-33rd-report-2023). Increases in costs of other staff pay per head taken from DfE schools’ costs notes: 2020 to 2021 and 2021 to 2024 plus an assumed average pay award of 8.5% in 2022–23 and 8% in 2023–24 (based on proposed pay awards for 2022–23 and 2023–24, https://local.gov.uk/our-support/workforce-and-hr-support/local-government-services/green-book-payscales-and-other-7 and https://www.local.gov.uk/our-support/workforce-and-hr-support/local-government-services/green-book-payscales-and-other-16), and 3% for 2024–25 to match the assumption for teachers. As per the schools’ costs note, 0.3% added for rising employer pension costs of other staff. Other costs assumed to grow in line with actual CPI inflation up to 2022–23 and Bank of England forecasts for 2023–24 and 2024–25. As assumed in DfE schools’ costs note: 2022 to 2024, we also add additional amounts for the rising costs of special educational needs provision (0.6% in 2022–23 and 0.5% in 2023–24).
Authors

Luke Sibieta
Luke is a Research Fellow at the IFS and his general research interests include education policy, political economy and poverty and inequality.
More from IFS
Understand this issue


Policy analysis


Academic research


