
Last week, the Scottish Government published its latest Government Expenditure and Revenue Scotland (GERS) report for 2024–25. It estimates total government revenue raised in Scotland, total public spending benefiting Scotland (including a per-capita share of UK-wide spending on things such as debt interest, defence and foreign aid), and the gap between them. This gap – Scotland’s net fiscal balance – represents the borrowing the UK government undertakes on Scotland’s behalf.
Like all economic statistics, GERS statistics involve some uncertainty and are backward-looking – so they do not predict future trends or reflect the policy choices different governments might make. But as Accredited Official Statistics they are independently assessed as being methodologically sound and free from political interference. And they are widely recognised as a sensible starting point for assessing the kind of fiscal situation that an independent Scotland would initially face – for example, by the SNP’s Sustainable Growth Commission of 2016–18.
Scotland’s notional deficit increased in 2024–25 by more than the UK’s deficit
In 2024–25 Scotland’s net fiscal balance, including a geographic share of North Sea oil and gas revenues, moved further into deficit, as spending grew faster than revenues. Borrowing for Scottish residents rose to £26.2 billion (11.6% of GDP or £4,721 per person), up from £21.4 billion in 2023–24 (9.7% of GDP or £3,891 per person). This was £2,576 per person or 6.4% of GDP more than for the UK as a whole – equating to £14 billion in total.
The UK also saw an increase in government borrowing in 2024–25, but by a much smaller amount: from 4.8% to 5.1% of GDP. The GERS report and the Fraser of Allander Institute’s immediate analysis examine the factors explaining the bigger increase in Scotland’s deficit. These include a fall in North Sea oil and gas revenues, weaker growth in onshore revenues (in part due to a council tax freeze), and a bigger increase in spending (especially capital investment and social protection and social security benefit spending).
This is in line with a longer-term trend
Figure 1 shows how Scotland’s fiscal deficit has evolved relative to the UK’s since the late 1990s. The blue line shows Scotland’s implicit fiscal deficit minus the UK’s fiscal deficit, allocating Scotland a geographic share of North Sea oil and gas revenues. We term this Scotland’s fiscal gap. The red line shows the same, except allocating Scotland a population-based shared of North Sea oil and gas revenues. The latter strips out the differential effect of North Sea oil and gas revenues on Scotland and on the UK as a whole, allowing us to consider the effect of differential trends in onshore revenues. We term this Scotland’s onshore fiscal gap.
Figure 1. Scotland’s fiscal gap and onshore fiscal gap, % of GDP
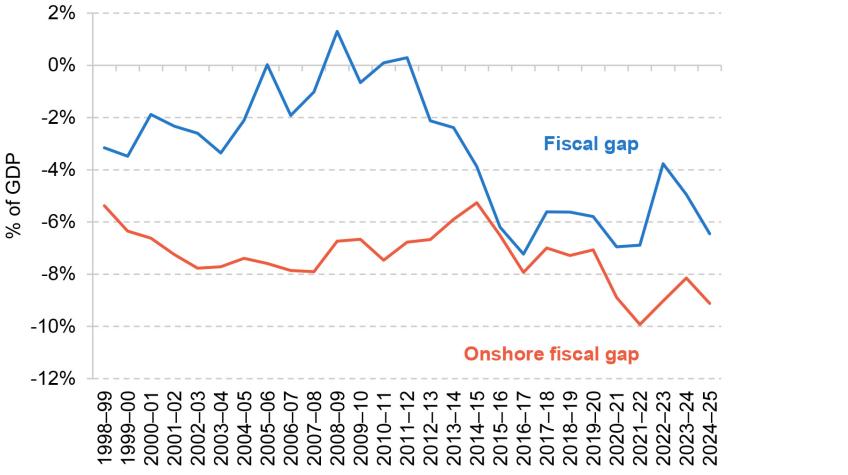
Source: Scottish Government Government Expenditure and Revenue Scotland 2024-25.
The figure shows that both Scotland’s overall fiscal gap and its onshore fiscal gap have widened since the late 2000s.
The overall fiscal gap has grown most – while it was close to zero around 2010, it has averaged around 6% of GDP since 2015 – driven to a large extent by falling North Sea oil and gas revenues, from an average of 5.3% in the late 2000s to 1.9% of GDP in the early 2020s.
But the period since 2015 has also seen a substantial increase in Scotland’s onshore fiscal gap, from an average of 6.4% of GDP in the early 2010s to 9.0% of GDP so far in the 2020s.
This partly reflects a bigger increase in government expenditure in Scotland than in the UK overall between the early 2010s and the early 2020s: spending rose from 51.3% of GDP to 56.1% of GDP in Scotland compared with 43.8% to 46.3% in the UK. Per-person spending was 14% higher in Scotland than in the UK in 2024–25, up from 12% in the early 2010s.
Weaker onshore revenue growth over the last 10 years has also contributed. Onshore tax revenues per person in Scotland fell from 97% of the UK average in the early 2010s to 92% so far in the 2020s. A sharp drop between 2014–15 and 2016–17 – when income tax revenues fell from 88% to 81% of the UK average – coincided with falling North Sea activity. This suggests this trend was driven at least in part by knock-on effects of North Sea activity on the onshore economy. Previous IFS research has shown that employment and earnings in North Eastern Scotland and Highlands & Islands – parts of Scotland most reliant on industries associated with oil and gas – particularly suffered in the late 2010s.
Other parts of the UK have seen similar trends
Experience elsewhere in the UK suggests that factors beyond the declining oil and gas industry play a role in Scotland’s widening fiscal gap though. All regions bar London and the South East have seen revenues grow less quickly than the UK average over the past two decades. Table 1, based on ONS data, shows per-person revenues as a share of the UK average for all regions, in selected years, allocating oil and gas revenues on a population basis to allow us to focus on trends in onshore revenues.
Table 1. Revenues per person as a share of UK revenues per person

Note: Oil and gas revenues allocated on a population basis.
Source: Office for National Statistics Country and Regional Public Sector Finances, UK: Financial Year Ending 2023.
The table shows that London’s per-person revenues rose from about 140% to 160% of the UK average between 1999–2000 and 2022–23 (the latest year of data available). In contrast, most other regions saw declines – and often sharper than Scotland’s. For example, revenues in the East Midlands fell from 91% to 83% of the UK average, while those in the West Midlands fell from 88% to 79%.
Scotland bucked the trend between 1999–2000 and 2014–15 with per-person revenues rising from 98% to 101% of the UK average (allocating oil and gas revenues on a population basis). But since around 2014–15, as the GERS data also show, Scotland’s revenues have fallen behind.
Several factors explain the increased reliance on London (and to a lesser extent the South East of England) over the last 20 years:
- More tax revenue now comes from capital taxes, such as stamp duty, inheritance tax and capital gains tax, the revenues from which have long been concentrated in London and the South East.
- Income tax reforms have increased the share of these taxes paid by higher-income individuals, who have again long been concentrated in London and the South East. These reforms include increases to the tax-free personal allowance and freezes in the higher-rate threshold for much of the 2010s, the ‘additional’ rate of income tax introduced in 2010, and the restriction of pensions tax relief for the highest-income individuals.
- And the concentration of the top 1% of income tax payers (who account for a large share of overall revenues) in London and the South East has further increased – although there are some signs that higher income tax payers (although not necessarily the top 1%) have more recently been moving out again.
Does this matter?
Heavy reliance on one region (London) and on a relatively small group of high-income/wealth taxpayers for revenues poses risks for the UK public finances. Higher incomes are typically more volatile, and high-income and high-wealth individuals more internationally mobile. Some economic shocks might also be geographically specific.
It also means that regions outside London and the South East rely increasingly on implicit fiscal transfers. As highlighted above, these transfers amounted to around £14 billion in 2024–25 for Scotland. But they are large for other regions too: £42 billion for the North of England, £23 billion for the Midlands, £16 billion for Wales and £11 billion for Northern Ireland in 2022–23 (the most recent year for which data are available for these regions).
Fiscal transfers are a normal feature of public finance systems, helping support public services and incomes in less prosperous areas. But under full fiscal autonomy or independence, these transfers would end. Instead, Scotland (or Wales or the North of England, for example) would become responsible for funding all its own government (including a negotiated proportion of historical debt servicing costs).
Full fiscal autonomy or independence for these areas would therefore require some combination of higher taxes or lower spending – unless economic growth could be sustainably and significantly grown.
Faster growth is possible. Scotland outpaced the UK in employment, earnings and overall growth during the 2000s, for example, as previous IFS research has highlighted and the revenue figures in Table 1 attest to. It could do so again, especially if long-standing issues with productivity and skills were tackled more effectively than in the rest of the UK. But this is not guaranteed, and some Scottish policies (such as current Land and Buildings Transaction Tax policy) may hinder rather than boost growth.
That is why growth prospects under different constitutional arrangements are central to the debate about Scottish independence and its implications for taxes and public services.
Authors

David Phillips
David is Head of Devolved and Local Government Finance. He also works on tax in developing countries as part of our TaxDev centre.
More from IFS
Understand this issue


Policy analysis


Academic research


