
The new government recently announced a package of planning reforms, with the goal of delivering 1.5 million homes over the next five years. Just as important as how many homes are built is where they are built. Building homes in areas with growing economic prospects allows individuals to take advantage of economic opportunities, shortens commutes, and could ultimately boost productivity.
This comment draws on new IFS research looking at how well housebuilding in England has responded to changes in local demand over the last 25 years.
Regional disparities in housing and population growth
Many might be surprised to hear that, since house prices took off in the mid 1990s, growth in the total number of homes has largely kept up with growth in the population of England as a whole. Between 1996 and 2021, the total number of properties grew by 21%, which was in fact slightly ahead of growth in the adult population (aged 16 and over) which was 20%.
So why is there talk of a growing housing shortage? On this national-level view, there is no more of a housing shortage now than in the mid 1990s. But this obscures important differences across regions and areas. Figure 1 shows a dramatic divergence in how housing growth has tracked population growth across different regions. While growth in the number of homes has roughly tracked growth in population in many parts of the country, in some areas housing stocks and population have grown at different rates. London is the only region where population growth significantly outpaced growth in housing supply. Over the 25-year period since 1996, the adult population of London grew by 29% while the number of homes grew by only 23%. Northern regions, in contrast, experienced much higher growth in housing stock than population. Rising overcrowding in London – along with the South-East, England’s fastest-growing region – in comparison with rising housing stock per person in Northern regions suggests housebuilding may not be responding appropriately to changes in England’s economic geography.
Does local housing supply respond to demand?
We study the question of whether homes are built in the right places by measuring the responsiveness of local housing supply to changes in local demand and assess why some areas have more responsive housing supply than others. We measure the responsiveness of supply to changes in local demand, for each local authority in England between 1996 and 2021, a period when real house prices almost tripled.
In a fluid market, new housebuilding would occur in areas experiencing rising employment. This would keep local house prices low and ensure workers in the other parts of the country are able to move there to take advantage of growing opportunities. On the whole, however, we find that housing supply in a particular area does not respond by much to improvements in local economic conditions. For an increase in demand to live in a local authority that raises local house prices by 10%, housing supply only increases by an additional 1.4%. This housing supply response is low compared with that in other countries such as the US, France and Germany. Comparable estimates from the US imply rates of housebuilding that are at least twice as sensitive to local changes in housing demand as they are in England.
What drives the low responsiveness of housebuilding?
The responsiveness of local housing supply to price changes differs across areas according to local policy and geographic constraints. We measured these constraints and examined their impact on how supply responds to price changes to obtain a ‘housing supply elasticity’ for each part of the country. Figure 2 shows that the responsiveness of housing supply to local demand is highest in the East of England and lowest in and around London and in the North-West. Housing supply responses are also weaker around major cities such as Liverpool and Bristol. Lower housing supply elasticities in dense, urban centres reduce the ability of workers to move to those areas that are likely to benefit most from the rise of service industries and the so-called ‘knowledge economy’.
Figure 2. Housing supply elasticities across England, 1996 to 2021
Why supply is unresponsive to changing economic conditions matters for how policy can and should affect this. Building is largely prohibited across broad areas of English countryside, including national parks and areas of outstanding natural beauty, as well as designated Green Belt areas around some major cities, including Birmingham, Bristol and London. Different parts of the country also face different geographical constraints and levels of existing development which raise the cost of construction. Planning decisions are devolved to 337 local planning authorities which can result in different approaches to building across areas, with some local authorities stricter than others.
The constraints we studied include physical geography, such as elevation and flood risk, policy constraints, including presence of land designated as Green Belt or national parks, and pre-existing number of homes. Figure 3 maps two of these constraints, showing that different parts of the country are differentially affected by the Green Belt, a policy constraint, and land elevation, a physical constraint.
Figure 3. Green Belt cover (left-hand side) and land elevation (right-hand side) in England
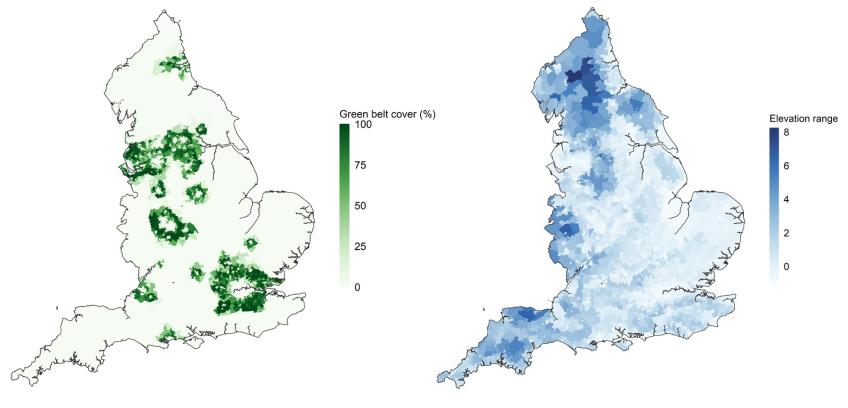
Note: Elevation range is the difference between maximum and minimum elevation.
Source: Green Belt cover is taken from Ministry of Housing, Communities and Local Government and data on elevation from the Ordnance Survey.
Although physical constraints do play a role – for instance, in Northern England where the terrain is more mountainous – by far the most important source of variation in local housing supply elasticities is lack of available land that it is permissible to build on. Many areas of Lincolnshire and Cambridgeshire in the East of England have an elasticity above 0.2, compared with below 0.05 in most areas of London. This largely reflects the lack of available land for development in and around London compared with the availability of flat land and absence of land-use restrictions in the East of England. London is also surrounded by the largest area of Green Belt in the country. This suggests that by making the availability of land responsive to economic conditions, policymakers can help housebuilding respond to economic growth in certain sectors and regions.
How might relaxing some of these constraints affect local house prices? One question we can ask is how much less would house prices have risen in an area, if it had experienced the same jobs growth as occurred between 1996 and 2021 but housing supply had been more responsive. We find that, had the housing stock in London been as responsive as in the rest of England, real house prices would have risen by 21 percentage points (£21,000) less in the capital between 1996 and 2021.
Supply constraints affect not only the number of properties built but also the types of properties. In areas with greater constraints on land use, additional housing is more likely to be made up of one- and two-bed properties compared with family homes. This has consequences of its own: decisions about when to start a family and where to live when one has a family can be shaped by the availability of suitable housing.
One positive lesson from our analysis is that some areas appear to have built more homes than would be expected given their constraints. Boroughs in East London, which were highly constrained ‘on paper’ in terms of their population density and lack of unused land, saw much larger growth in housing supply between 1996 and 2021 than other areas with constraints and increased demand for housing. This was especially true for Tower Hamlets, which underwent substantial regeneration and redevelopment of brownfield sites, particularly around the period of the 2012 Olympics.
What next?
Over the last 25 years, land-use constraints, and the costs of building in already densely populated areas, have meant that local housing supply has not tracked housing demand. This is despite housebuilding keeping pace with growth in the adult population overall. All this means that, over the next 25 years, the government will need to think about not just how many homes are built, but also where.
Authors


Peter Levell
Peter joined in 2009. He has published several papers on the microeconomics of household spending and labour supply decisions over the life-cycle.

More from IFS
Understand this issue


Policy analysis


Academic research


