
Summary
Background
Regional inequalities in wages in the UK, as in many other countries, are large and persistent. Research on the sources of these inequalities has traditionally focused on the role of people and firms. These refer to differences in the composition of workers’ skills across places; and differences in the composition or market power of firms, which mean that a given type of worker can earn more in some places than in others.
More recently, there has been growing interest in the matching of workers to firms as a potential driver of wage inequalities. A paper using German data finds that large cities have higher wages not only because they have more high-quality workers and firms, but also because high-skilled workers are more likely to work for high-quality firms. In other words, the way in which workers are matched to firms across places – not just their composition – matters for regional inequalities.
This Data Insight explores how young workers are matched to firms across local labour markets in England, using the Longitudinal Education Outcomes (LEO) dataset. We focus on differences in ‘positive assortative matching’ – the extent to which high-skilled workers are matched to high-quality firms – which is assumed to increase productivity in many standard economic models.
We find that in London and surrounding areas, highly educated workers are more tightly matched to high-quality firms than in other parts of the country, which likely contributes to geographical inequality in wages. Outside London, assortative matching largely takes place through educated workers working in high-paying industries, with virtually no matching within industries.
In general, workers and firms are more tightly matched in big cities. However, Birmingham and Manchester have less assortative matching than one would expect given their size.
Young workers move firms more often in London and surrounding areas than elsewhere, but the gap in assortative matching emerges in people’s first year in the labour market.
What we did
We use the Longitudinal Education Outcomes (LEO) dataset to study worker-firm matching across local labour markets in England, defined by Travel-to-Work Areas (TTWAs). We focus on differences in positive assortative matching: the extent to which high-skilled workers are matched to high-quality firms. When high-skilled workers are especially productive in high-quality firms – as assumed in many standard economic production functions – more positive assortative matching in an area would lead to higher productivity and therefore higher average wages.
To measure firm quality, we use firm fixed effects estimated from a two-way fixed effects (or ‘AKM’) wage regression. This approach infers firm quality from workers’ wage changes as they move from firm to firm: firms associated with wage increases for incoming workers and wage decreases for outgoing workers are assumed to be more productive. We define ‘firms’ as enterprise-broad region groups (using London and South; East and Midlands; and North), and compute daily wages as earnings divided by the number of days employed over the tax year. The LEO data does not contain information on hours worked, so we focus on ‘regular’ jobs by excluding observations before graduation and those earning less than the equivalent of 16 hours per week on their age-specific minimum wage.
The estimated firm fixed effect partly captures the industry of the firm. To distinguish between matching within and across industries, we construct an alternative ‘de-meaned’ firm quality measure by subtracting the average fixed effect of the firm’s industry (two-digit Standard Industrial Classification [SIC] code). We use percentile ranks of both ‘raw’ and ‘de-meaned’ firm quality, rather than point estimates, to limit the effect of outliers. Under the de-meaned measure, the lowest-ranked firm in the financial industry and the lowest-ranked firm in the hospitality industry are both given a rank of one, even though finance is much higher-paying than hospitality.
We measure worker skills using an index of educational attainment. This is the first principal component of their Key Stage 1 (age 7) scores, Key Stage 4 (age 16) scores and, for graduates, the selectivity of their university-course combination – collapsing these measures into a single measure of ‘skill’. Compared to previous studies that measure worker quality using individual fixed effects from an AKM wage regression, we think this provides a more transparent measure of ability that is determined prior to labour market entry, and therefore unaffected by job choices or subsequent labour market experiences. That said, educational attainment may not capture certain skills (for example, social skills) that are captured by individual fixed effects.
We capture positive assortative matching in three ways:
- We plot average firm ranks against worker (education) ranks, both computed nationally, across different types of places. This illustrates both differences in firm quality between places and differences in assortative matching within places.
- To hone in on assortative matching within places, we look at the pairwise correlation between local firm and worker ranks, with both ranks computed separately by TTWA.
- To study how assortative matching evolves over people’s careers, we consider an individual-level measure of match quality, defined as 100 minus the absolute distance between local firm and worker ranks. Under this measure, a worker whose local education ranking exactly matches the local ranking of their firm is assigned a value of 100. A worker who is ranked lowest in their TTWA but works for the highest-ranked firm, or vice versa, is assigned a value of one.
What we found
Young workers in and around London work for higher quality firms than their counterparts in other areas
We started by plotting average firm rank against ventiles of worker education ranks, both calculated at the national level, for different types of cities and towns. Because the LEO data contains place of residence but not place of work, we split out TTWAs that border London (‘London adjacent’), since some residents of these areas are likely to work in London. Cities are defined using the Centre for Cities’ Primary Urban Areas, with ‘major cities’ referring to the nine largest cities outside London.
Young workers in London work for much higher quality firms than those in other parts of the country with similar levels of education, as shown in Figure 1. On average, someone in the top 5% of the national education distribution, who lives in a city outside of London, works in a lower quality firm than someone in the bottom 5% of educational attainment in London. Strikingly, there is virtually no difference in average firm quality between major cities, other cities and rural areas outside London. Workers who live in TTWAs that border London work in firms that are slightly lower quality than those who live in London, but much higher quality than elsewhere. This likely reflects both higher productivity in these TTWAs, and the fact that many residents of these areas commute into the capital.
Figure 1: Average national firm rank by national ventile of educational attainment
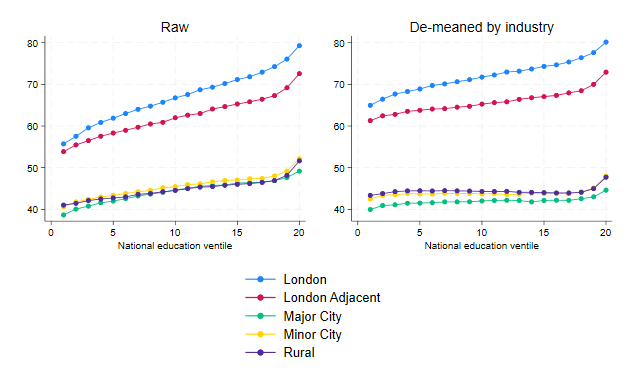
Source: Longitudinal Educational Outcomes, 2012 –2019.
Notes: Location based on place of residence.
Workers’ skills are less tightly matched to firm quality outside London, especially within industries
In addition, the relationship between worker education and firm quality (the slope) is steeper in London and adjacent TTWAs than in the rest of England. This implies that there is more positive assortative matching between workers and firms in and around the capital. Outside of London, almost all assortative matching comes from industry sorting: highly educated workers working in high-paying industries. The slope of the ‘de-meaned’ firm quality measure is almost flat. In contrast, assortative matching in London happens both across and within industries.
Figure 2 shows how assortative matching varies across individual TTWAs. Workers are most tightly matched to firms in London and the South East, but several other cities – Bristol, Manchester, Liverpool and York – also exhibit relatively high levels of assortative matching. There is a pocket of high matching in West Cumbria, which contains hubs for defence, nuclear and other advanced manufacturing industries. With the exception of these areas, almost all assortative matching outside of London and adjacent TTWAs occurs across rather than within industries.
Figure 2: Correlation between local firm rank and local education rank by TTWA.

Source: Longitudinal Educational Outcomes, 2012 – 2019.
Notes: Location based on place of residence. Worker and firm ranks are calculated separately by TTWA.
In general, the match between educated workers and high-quality firms is tighter in larger cities, consistent with the notion that larger and denser labour market allow for more efficient matching (Figure 3). However, TTWAs which border London have notably high assortative matching given their size. This could reflect tighter matching within these TTWAs, or their integration into the broader London labour market – likely both. England’s second cities, Birmingham and Manchester, have less assortative matching than one would expect given their size.
Figure 3: Correlation between local firm rank and local education rank by TTWA population size

Source: Longitudinal Educational Outcomes, 2012 – 2019, 2011 Census.
Notes: Location based on place of residence. Population based on 2011 Census. Worker and firm ranks are calculated separately by TTWA.
Gaps in assortative matching appear in people’s first year in the labour market
One potential mechanism for higher assortative matching in London and neighbouring TTWAs is that workers in these areas move firms more, which allows them to sort into better matches over time. Job mobility is indeed slightly higher around the capital: 10 years after entering the labour market, workers in London have on average had 0.3 (10%) more employers, and those in neighbouring TTWAs have 0.2 (6%) more employers, than workers in other parts of the country. However, Figure 4 shows that the gap in assortative matching between London and other areas emerges in people’s first year in the labour market. Indeed, the degree of assortative matching – at least with respect to educational attainment – appears to decline over the first several years of people’s careers.
The pattern in Figure 4 could be driven by compositional changes: exits from the labour market and migration into and out of London could be correlated with match quality. To address this, we use our individual-level measure to track how assortative matching changes for a given individual in a TTWA over time (that is, controlling for individual fixed effects). We find that match quality declines with experience over the first 10 years of people’s careers, by 1.5 points in London and neighbouring TTWAs and by 0.9 points elsewhere. For context, the average match quality in the LEO data is 71 in London and neighbouring TTWAs and 68 elsewhere.
Figure 4: Correlation between local firm rank and local education rank by years of experience
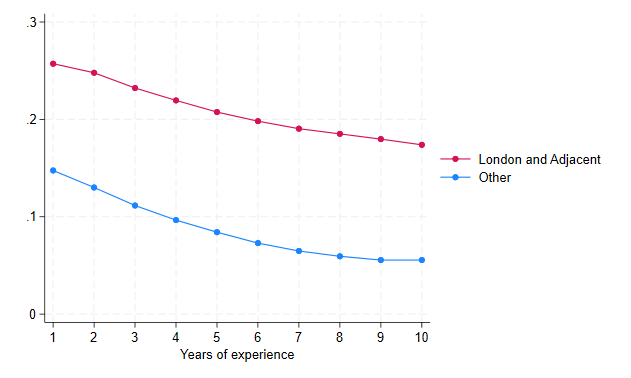
Source: Longitudinal Educational Outcomes, 2012 – 2019.
Notes: Location based on place of residence. Worker and firm ranks are calculated separately by TTWA and years of experience.
Workers with the lowest education levels move up the firm hierarchy the fastest
The slight decline in assortative matching over people’s early careers reflects the fact that, while workers of all educational levels climb up the firm hierarchy, it is the lowest educated workers who move up the most. In the first 10 years of their career, a worker outside London in the highest education quartile moves up 7 ranks on average, compared to 15 ranks for someone in the bottom quartile. Workers of all education levels in London and surrounding areas climb up the firm ladder faster than workers elsewhere, but the gap in progression is larger for less educated workers, hence the steeper decline in assortative matching. A possible explanation is that non-cognitive skills not captured by our education index become more important over time – something we want to work on next.
Figure 6: Average local firm rank relative to first year in labour market, by local education quartile
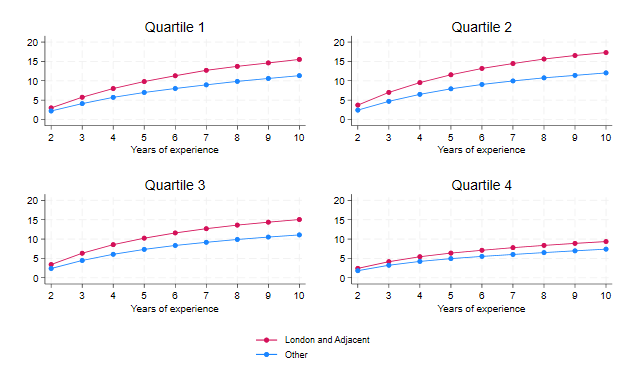
Source: Longitudinal Educational Outcomes, 2012 – 2019.
Notes: Location based on place of residence. Shows coefficients from a regression of match quality on years of experience and individual fixed effects.
Why it matters
Previous research on regional inequalities has emphasised the need for policies to upskill workers in deprived places and attract productive firms to them. Our findings suggest that policies to improve the matching of existing workers and firms could also play a role, especially in England’s second cities – Birmingham and Manchester – which exhibit lower assortative matching than one would expect given their size.
This points to a new set of policy levers for reducing regional inequalities. For example, the government could invest in job search platforms, local labour market intelligence tools or careers advice outside London. Given our finding that differences between London and other places emerge in people’s first year in the labour market, such interventions could be targeted at young people leaving school and university. Improvements in public transport could also help matching, by enabling workers to search for jobs over a wider area.
Unlike policies to attract high-quality firms or workers to deprived places, which run the risk of displacement and dis-agglomeration (by moving resources from a big productive city to less productive ones), policies to reduce matching frictions would strictly increase aggregate output.
What next?
We plan to test the robustness of our findings to limited mobility bias, using the leave-out estimation method and/or by grouping firms. We also want develop our measure of worker skill to incorporate non-cognitive or subject-specific skills. More broadly, since the extent of positive assortative matching is only weakly related to city size, we want to understand what other factors contribute to worker-firm matching – for example the local mix of firms and industries, job density, transport networks and commuting patterns. We could use counterfactuals to quantify the importance of assortative matching to regional wage inequality.
References
Abowd, John M., Kramarz, Francis and Margolis, David N. (1999), High Wage Workers and High Wage Firms. Econometrica, 67.
Dauth, Wolfgang, Sebastian Findeisen, Enrico Moretti, and Jens Südekum (2022). Matching in Cities. Journal of the European Economic Association, 20(4).
Kline, Patrick, Raffaele Saggio, and Mikkel Sølvsten (2020). Leave-out estimation of variance components. Econometrica, 88(5).
Bonhomme, Stéphane, Thibaut Lamadon, and Elena Manresa (2022). Discretizing Unobserved Heterogeneity. Econometrica, 90(2).
Acknowledgements
This work was supported by ADR UK (Administrative Data Research UK). ADR UK is a partnership transforming the way researchers access the UK’s wealth of public sector data, to enable better informed policy decisions that improve people’s lives. ADR UK is an Economic and Social Research Council (ESRC) Investment (part of UK Research and Innovation). Grant number: ES/Y001249/1.
About ADR England
ADR England is a portfolio of data linking and research projects, delivered by a range of academic and government partners to provide policy-relevant insights using data held by UK Government departments and public bodies. The geographic scope of ADR England projects varies depending on the data holder, but is typically England-only, England and Wales, Great Britain or UK-wide. ADR England is part of ADR UK, an ESRC investment and part of UKRI.
About ADR UK
ADR UK is a partnership transforming the way researchers access the UK’s wealth of public sector data, to enable better informed policy decisions that improve people’s lives. By linking together data held by different parts of government and facilitation safe and secure access for accredited researchers to these newly joined-up and de-identified data sets, ADR UK is creating a sustainable body of knowledge about how our society and economy function – tailored to give decision makers the answers they need to solve important policy questions.
Disclaimer
Data Insights allow ADR UK to swiftly share emerging findings as they are reported. This ensures everyone from government decision makers to members of the public can find out what is identified in our data throughout the research process. Note that Data Insights have not been formally peer reviewed and are often shared before a linked journal article is published to ensure timeliness.
This work was produced using administrative data accessed through the ONS Secure Research Service. The use of the data in this work does not imply the endorsement of the ONS or data owners in relation to the interpretation or analysis.
This work uses research datasets which may not exactly reproduce National Statistics aggregates. National Statistics follow consistent statistical conventions over time
Authors

Matthew Oulton
Matthew is a Research Economist in the Income, Work, and Welfare sector. His research focuses on the UK tax and benefit system.

Xiaowei Xu
Xiaowei joined the IFS in 2018 and works in the Income, Work and Welfare sector.
More from IFS
Understand this issue


Policy analysis


Academic research

