
Downloads
Download the report as a PDF
PDF | 545.76 KB
Executive summary
The introduction of universal credit (UC) has been the most significant reform to the working-age benefits system since the reforms following the post-war Beveridge Report. When fully rolled out, around 8 million families – 29% of all working-age families – will be entitled to the benefit. UC is an integrated means-tested benefit that is replacing six ‘legacy’ benefits, combining out-of-work support with support for housing costs, incapacity and children. This report assesses the impact of the UC reform on households’ incomes and their financial incentives to work, as well as the practical experience of applying for and getting means-tested benefits. We then briefly review the issues around the rest of UC’s roll-out.
Key findings
- Nearly half (47%; 3.7 million) of all households affected by the UC reform gain at least £200 per year. One-fifth of affected households (21%; 1.7 million) see their income change by less than £200 per year, while nearly a third (32%; 2.5 million) are worse off by at least £200 per year.
- Many see considerably more substantial income changes. 25% (2.0 million) of affected households are better off under UC by at least £2,000 per year, with half of those better off by more than £4,000 per year. Conversely, 21% of affected households (1.6 million) are worse off under the legacy system by at least £2,000 per year, with close to half of those worse off by more than £4,000.
- Couples with children are the most likely to gain under UC compared with the legacy system. 72% gain by at least £200 a year, compared with just 22% who lose out by at least that much. Households in work and renter households also tend to gain as benefits are typically withdrawn more slowly as earnings rise under UC.
- Most households with one adult above and one adult below state pension age are significantly worse off under the UC system than under legacy benefits. Because the reform means they are entitled to UC – rather than the much more generous pension credit – 70% of these households (180,000) lose out by more than £4,000 per year under the UC system. Households with over £16,000 of assets and the self-employed can also lose out significantly under the UC system.
- Households receiving health-related benefits also see big differences in their benefit income under UC compared with legacy benefits. Depending on the exact combination of disability and incapacity benefits they receive, a household could be either better or worse off by thousands of pounds per year.
- Taken as a whole, UC represents a net giveaway of about £2½ billion compared with the legacy system. Households in the second to fourth income deciles benefit most on average, while middle-income households are worse off.
- A key motivation for introducing UC was to strengthen work incentives, and for many workers it does so (often significantly). Under the legacy system, claimants could see multiple benefits withdrawn at once as their earnings increased, leading to very high effective tax rates. For example, about a quarter of workers lost at least 70% of their earnings in higher taxes and lower benefit entitlements when they moved into work. Under UC, almost no one sees an effective tax rate that high. Similarly, UC induces substantial falls in the share of workers who are strongly disincentivised from increasing their earnings (e.g. by working an extra hour). However, by extending entitlements to benefits further up the income distribution, UC brings more workers into means-testing and hence weakens work incentives for many who under the legacy system had a low effective tax rate. While the incentive to move into paid work has been strengthened, there has been almost no change in the incentive to move from part-time to full-time work.
- While UC has made significant strides in rationalising the benefit system, there is still room for improvement. In particular, integrating council tax support into UC would mean practically no workers facing a marginal tax rate above 75% (down from 6%).
- UC also changes the practical experience of getting the benefit. For many, it eases the burden of applying and allows the system to respond more flexibly to changes in families’ circumstances. It also results in fewer over- and under-payments than the legacy system. However, various factors likely make budgeting harder: it can (usually) only be received monthly, payments cannot be split between couples nor paid directly to landlords, and when applying for the benefit claimants face a ‘five-week wait’ for the first payment, which applicants must cover either through their own resources or a loan (‘advance’) from the Department for Work and Pensions (DWP) that must be repaid.
- The roll-out of UC is now planned to be completed by the end of 2025. There are still around 1.2 million claimants of legacy benefits who must be migrated. This requires them to make an application for UC after receiving a ‘migration notice’ telling them to do so. 32% of tax credit recipients who received a migration notice in 2023–24 did not apply in time and saw their benefit payments terminated. If this rate persisted for the remaining migrations, then 400,000 claimants would see their benefit payments stop. The largest group left to be migrated are claimants of employment and support allowance (ESA), a particularly vulnerable group who may face even more acute difficulties with putting in a UC claim. DWP has already pledged additional support to help these claimants, but getting this assistance right will be a critical issue for the next government – or large numbers of disabled claimants, often receiving over £10,000 a year in means-tested benefits, may suddenly end up without any of that financial support.
1. What is universal credit?
The introduction of universal credit (UC) has been the most significant reform to the working-age benefits system since the reforms following the post-war Beveridge Report. UC is a benefit for working-age families with low incomes. When it is fully rolled out, at any one time around 8.2 million families – 29% of all working-age families – will be entitled to UC1. This will include 4.5 million workless families and another 3.6 million in-work families. Many more will be entitled at some point over their life. For some types of families, even those with substantial earnings can be eligible for UC – families with two children in rented accommodation may be entitled to UC if a single earner is on up to around £70,000, and if in rented accommodation in expensive areas such as London they could be entitled while earning more than £100,000. It is an integrated benefit, replacing six existing means-tested benefits and tax credits (known as the ‘legacy’ system2), and includes support for rental costs, incapacity and children. The change to UC aimed to simplify the system of means-tested benefits, making it easier to interact with and reducing the number of benefit recipients facing very high marginal tax rates on earnings.
UC started to be rolled out to benefit recipients in 2013. While initially planned to be completed by 2017–18, this roll-out is still ongoing (Office for Budget Responsibility, 2012). As of February 2024, there were 5.0 million families receiving UC (Department for Work and Pensions, 2024). Meanwhile, there are approximately 1.2 million claimants still receiving legacy benefits, who are due to be migrated over to UC by the end of 2025 (Child Poverty Action Group, 2024).
Figure 1 shows annualised benefit entitlements under the UC and legacy systems for an example lone-parent renter, under the UC system and the legacy system3. Although – as we will come onto later – out-of-work families can see their entitlements rise or fall when they move from the legacy system to UC, the typical non-disabled claimant without significant savings (such as our example lone parent) receives the same amount under the UC system as under the legacy system (although in the latter case they would have to claim multiple benefits to get their full entitlement). The differences occur when in work. 55p of UC is withdrawn for every £1 of after-tax earnings above a threshold, known as the work allowance.4 By contrast, under the legacy system, each benefit had its own rules for means-testing. While the amount of UC the individual receives falls smoothly as they work more, their benefit income under the legacy system follows a rather more bumpy path. Initially, benefit income is withdrawn with a 100% taper rate above a very small disregard (i.e. benefits fall by £1 for every £1 earned); benefit entitlements then jump up at 16 hours when the individual becomes eligible for working tax credits, and they jump up again at 30 hours when they become eligible for a ‘full-time premium’.
Figure 1. Annualised benefit income for an example lone-parent renter with two children earning the National Living Wage
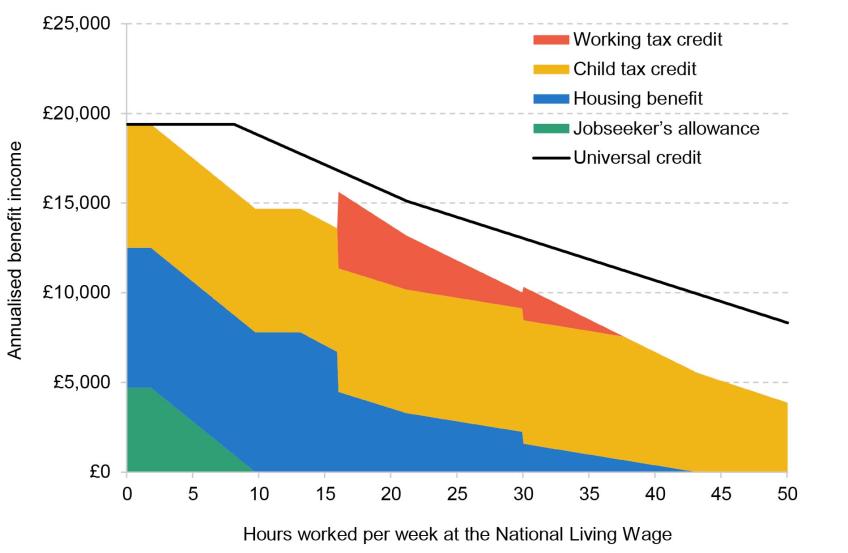
Note: April 2024 tax and benefit system. Example is for a family where both children are under 5 and rent is £150 per week.
Source: Authors’ calculations using TAXBEN, the IFS tax and benefit microsimulation model.
It is worth noting – as this is sometimes a point of confusion – what the UC reform is not. There have been a number of other changes to the working-age benefit system since the introduction of UC, including the introduction of the two-child limit and benefit cap, along with the freeze to working-age benefits between 2015 and 2019. These reforms and others have generally been applied in the same way to both the UC and legacy systems, and so are not part of the UC reform itself. There have been changes specific to UC since its introduction, including cuts and increases to work allowances (the amount some recipients can earn before their UC starts to be withdrawn) and two reductions in the taper rate (the rate at which UC is withdrawn). These did not have any parallel in the legacy system. Our goal is to assess the UC system in 2024–25, incorporating all changes implemented to date.
In this report, we model the impact of the universal credit reform on household incomes. To do this, we compare households’ incomes under two systems. The first assumes that UC is fully rolled out, meaning all families are assessed under the current UC system. The second assumes that all households are instead assessed under the current legacy system. We use TAXBEN, the IFS tax and benefit microsimulation model, along with household information from the Family Resources Survey (FRS) 2022–23 to compute households’ incomes under each system5. We assume full take-up of benefits, meaning we do not account for potential effects of the UC reform on benefit take-up. This is potentially important, since it is possible that by combining multiple benefits UC may increase take-up – though it is also possible that UC will be associated with a stigma that tax credits were not associated with, reducing take-up. In either case, there is no existing evidence we are aware of on the impact of UC on take-up. We also do not account for any behavioural response, such as impacts on hours worked.
2. Who wins and loses under universal credit?
We have already seen in Figure 1 that the UC reform can have significant effects on benefit entitlements. In this section, we turn to quantifying these effects across the population. We first highlight the proportion of affected households gaining and losing different amounts.6 We split by household type, work status and housing tenure to help characterise the types of households left better and worse off by the changes. We briefly discuss the potential effects on families receiving health-related benefits. We then consider the average impacts across the whole income distribution.
- Figure 2 shows the distribution of impacts of the UC reform for households of different compositions, as well as for all 8 million affected households. We find that:
Nearly half (47%) of all affected households gain at least £200 per year under the reform. One-fifth of affected households (21%) see their income change by less than £200 per year, while nearly a third (32%) are worse off by at least £200 per year. - Some households see very significant gains and losses. 25% of all affected households are better off under UC by at least £2,000 per year, with half of those better off by more than £4,000 per year. Conversely, 21% of affected households are worse off than under the legacy system by £2,000 per year or more, with close to half of those worse off by more than £4,000. For context, average annual household income among all affected households is £34,000 per year, meaning that, for a substantial fraction of affected households, these changes represent a very big change to their income.
- Couples with children are the most likely to gain under the UC system, with 72% better off by at least £200 per year and only 22% worse off by £200 or more. Under UC their benefits are generally withdrawn more slowly, because all benefit income is tapered away at a single rate (above a work allowance of £4,848 to £8,076 per year), whereas under the legacy system multiple benefits were withdrawn simultaneously. This means that they tend to be better off under UC than under the legacy system. Conversely, most households without children have no work allowance, meaning their UC is withdrawn as soon as they start earning some income. Partly as a result of this, households with children do better under UC than those without.
- Households with one adult over and one under the state pension age (SPA) – what the Department for Work and Pensions calls ‘mixed-age couples’ (MACs) – are very likely to lose out. 70% of these households lose out by more than £4,000 per year under the UC system, while 96% are worse off by at least £200. This is because under the legacy system these couples were entitled to apply for pension credit, but under UC they must instead apply for UC. Pension credit is substantially more generous than UC: a couple with no other source of income would be entitled to more than £17,300 per year in pension credit, but just £7,400 per year in UC.
Figure 2. Impact of UC reform on households entitled to either UC or legacy benefits, by household composition (share of all entitled households in parentheses)
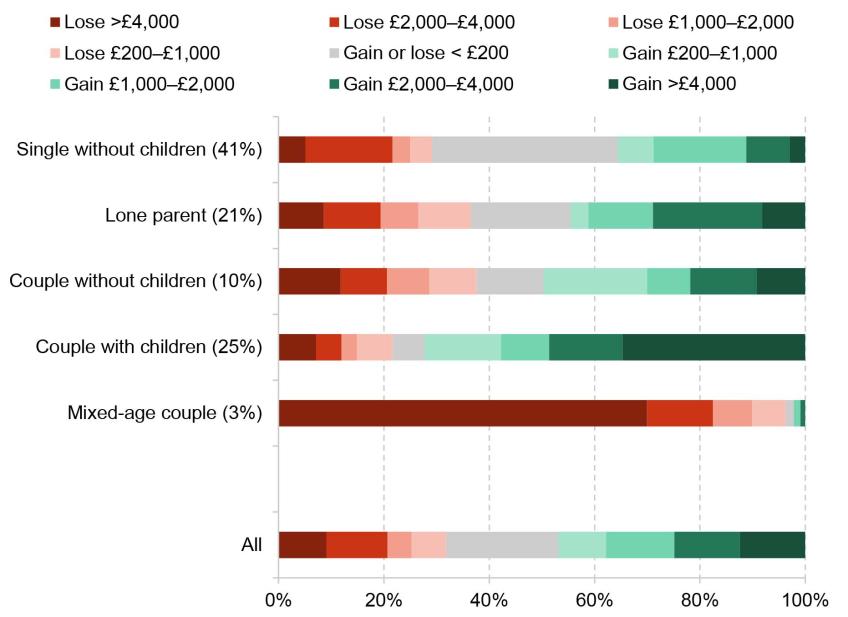
Source: Authors’ calculations using TAXBEN, the IFS tax and benefit microsimulation model, and Family Resources Survey 2022–23.
Because the UC system withdraws benefit income in a very different way from the legacy system, there are systematic differences in the effects of the reform on in-work households compared with out-of-work households. Figure 3 shows the distribution of gains and losses for households of different work statuses (again, among those who are entitled to either UC or a legacy benefit). The key findings are:
- Households that receive most of their income through employment are the most likely to gain under the UC reform, with 69% gaining at least £200 per year. This is because benefit entitlements are reduced more slowly as earnings rise under UC than under the legacy system. Thus, households with some income from employment tend to do better under the UC system than under the legacy system.
- Among households whose income comes primarily from self-employment, there are still more winners than losers (56% compared with 40%), but they benefit less than employee households. This is because UC applies a ‘minimum income floor’ (MIF) to self-employed individuals, generally equivalent to working 35 hours at the National Living Wage. This means UC payments for self-employed families whose income falls below the floor are calculated as if their income was equal to the floor, effectively reducing their UC entitlement. There was no such floor under the legacy system, and so families affected by the MIF under UC are likely to be made worse off than they would be under the legacy system.
- 40% of workless households see little difference between their benefit entitlement under UC and their entitlement under the legacy system. This is far more than we see for employee households and self-employed households (4% and 5% respectively). This is because the rates paid for UC and legacy benefits prior to means-testing are largely the same.
- Still, most workless households do see a significant change in their entitlement, with 25% gaining at least £200 per year and 35% losing at least that much. This is because many are also claiming health-related benefits, which we show later in this section generates sizeable winners and losses. The treatment of assets under UC, where a family with more than £16,000 in assets (cash, savings or investments) does not qualify for anything, is more stringent than under the legacy system. Brewer et al. (2020) show that families with significant assets generally lose out from the UC reform.
- Workless families who live with an adult that they are not partnered with – for example, an out-of-work mother living with her adult child – tend to gain from UC. This is because the legacy system implemented a crude means test based on the incomes of such ‘non-dependants’, so the benefits of the mother would be reduced in light of the child’s income. Under UC, the impact of non-dependants on UC entitlements is much smaller. This can have very substantial effects: if the adult child earned £28,000, that would reduce the out-of-work mother’s benefit entitlements by £5,900 per year under the legacy system. Under UC, the child’s presence would still reduce benefit entitlements, but by the lesser amount of £1,094.
Figure 3. Impact of UC reform on working-age households entitled to either UC or legacy benefits, by household work status (share of all entitled households in parentheses)
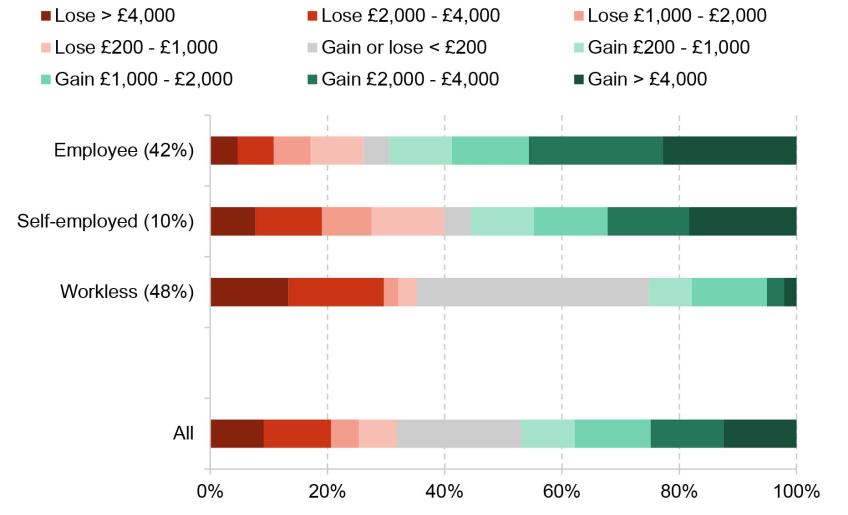
Table 1. Figure 3. Impact of UC reform on working-age households entitled to either UC or legacy benefits, by household work status (share of all entitled households in parentheses)
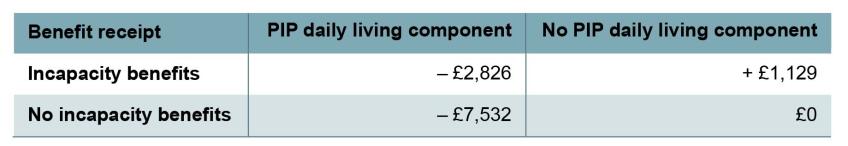
Note: Example out-of-work individual with no partner or children. Assumes individual receives the maximum PIP daily living component and qualifies for the ESA ‘support group’ or LCWRA under UC.
Source: Authors’ calculations using TAXBEN, the IFS tax and benefit microsimulation model.
So far, we have considered which types of households are better and worse off, and to what extent, under the UC reform compared with the legacy system. We now consider what the average impact of UC on household incomes is. Figure 4 shows the average impact on annual household income for each decile (tenth) of the income distribution. Overall, UC is a net increase in benefit entitlements of £2.6 billion per year compared with the legacy system, equivalent to £322 per affected household (£90 across all households). Unsurprisingly for a means-tested benefit, the impacts are highly concentrated towards the bottom 40% of the income distribution. Households in the second to fourth deciles gain more than those in the first decile, reflecting the fact that, as we have discussed, UC is more favourable to in-work families than the legacy system, whereas many workless families are treated the same by both systems.
Figure 4. Effect of UC reform compared with legacy system on household income, by income decile
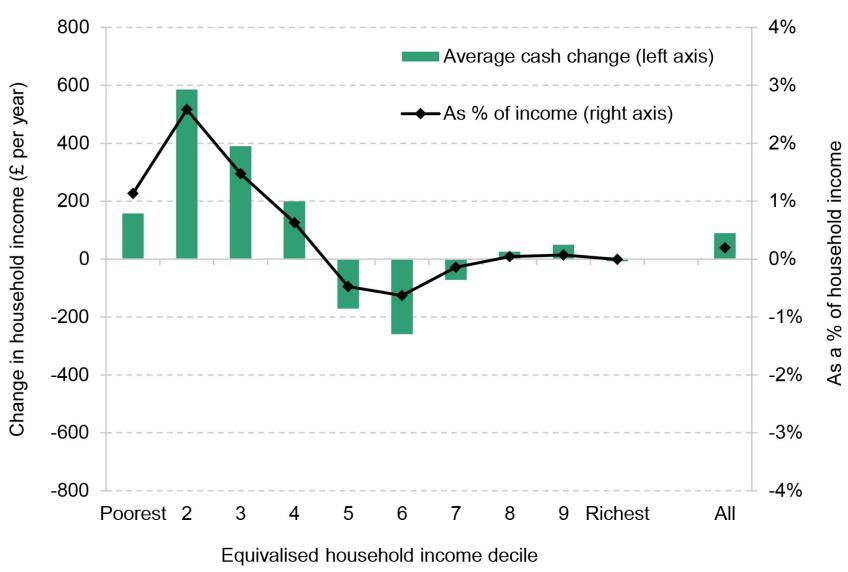
Note: Incomes have been measured net of taxes and benefits and are expressed in 2024–25 prices. Equivalisation based on the modified OECD equivalence scale.
Source: Authors’ calculations using TAXBEN, the IFS tax and benefit microsimulation model, and Family Resources Survey 2022–23.
Households in the middle of the income distribution are actually worse off on average under UC than under the legacy system, losing around £200 per year. This is due to households that claim disability benefits, who lose very significantly under the UC system.
3. What is the impact on financial incentives to work?
We have discussed how the legacy benefits system leads to multiple benefits being withdrawn simultaneously is part of why UC delivers different incomes from the legacy system. But this feature of the legacy system can also create strong disincentives for some individuals to work and earn more, and removing these was a key motivation for UC. In this section, we measure the impact of the UC reform on two measures of work incentives: participation tax rates (PTRs) and marginal effective tax rates (METRs).
PTRs measure the proportion of earnings lost in higher taxes and lower benefit entitlements when an individual moves into work. A person with a PTR of 70%, who would earn £10,000 before tax per year if in work, would see their income rise by £3,000 if they started to work, while a person with a PTR of 50% would gain £5,000. METRs measure what proportion of an additional pound of earnings an individual loses through higher taxes and lower benefit entitlements. A worker with a METR of 70% would see their earnings rise by 30p if they increased their earnings by £1. A worker with a METR of 50% would see an increase of 50p. Respectively, these two measures reflect the financial incentive to be in paid work at all and the financial incentive to increase earnings slightly (e.g. by working slightly more hours or moving to a slightly better-paid job)7.
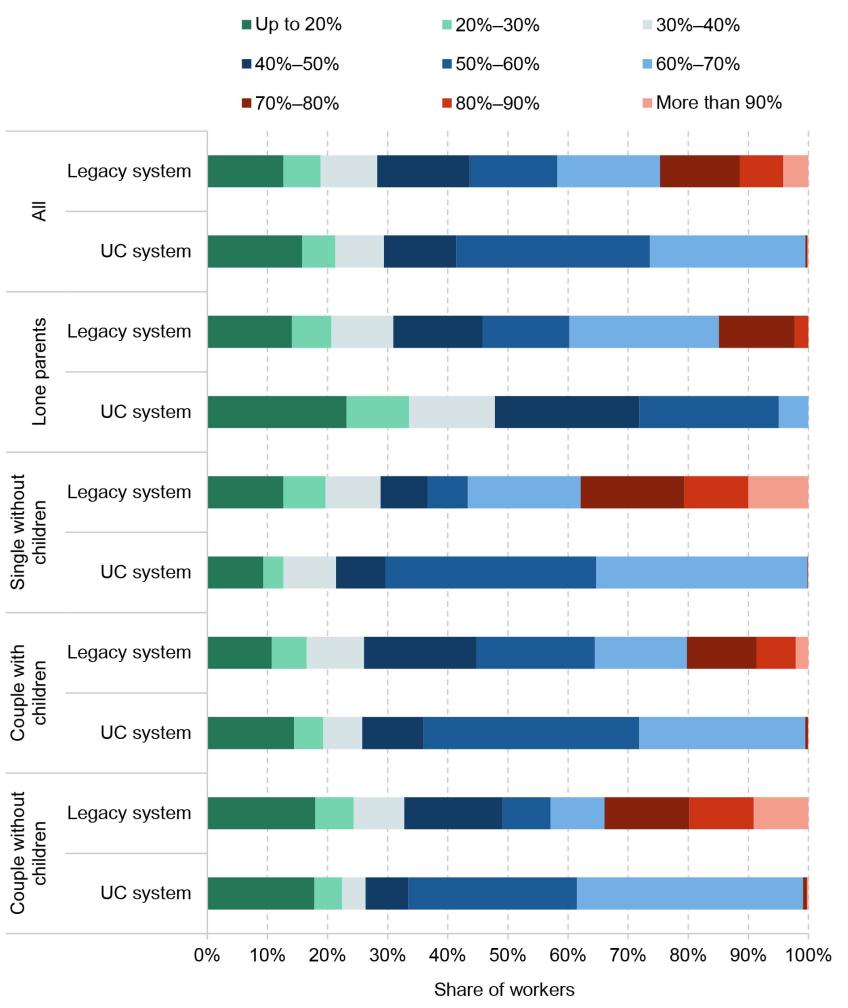
Figure 5 shows the distribution of participation tax rates among workers entitled to either a legacy benefit or UC. Immediately noticeable is the reduction in the share of workers facing very high PTRs under UC compared with the legacy system. Moreover, we see that:
- Under the legacy system, 25% of all workers face a PTR of more than 70%. By contrast, under the UC system, almost no one faces a PTR that high.
- Differences at lower PTRs are much smaller, with just over 40% of workers facing a PTR of 50% or less in the legacy and UC systems alike.
- Under the legacy system, 60% of working lone parents have a PTR of 60% or less, compared with 95% under the UC system. The UC reform also increases the number of lone parents with a PTR of less than 30%, from 21% to 34%.
Figure 5. Participation tax rates, among workers entitled to either UC or legacy benefits
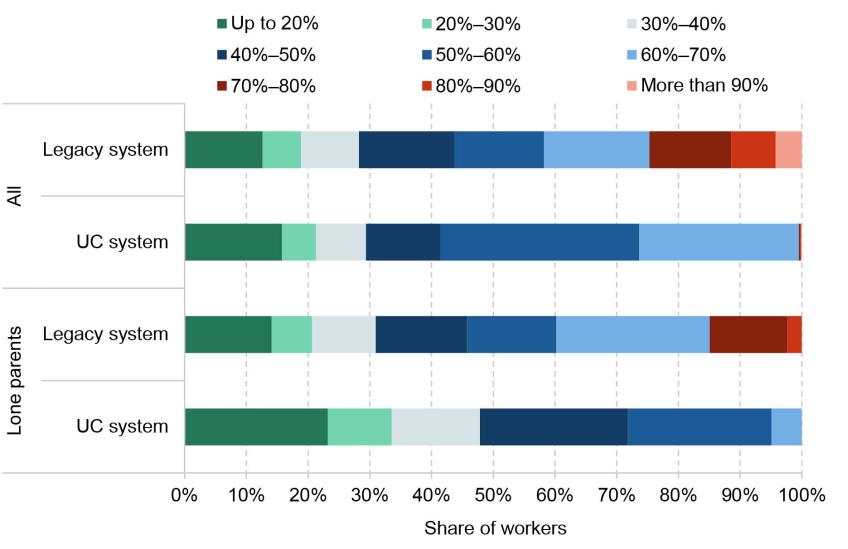
Note: Sample includes all working individuals in families entitled to legacy benefits or universal credit, with an adult aged below SPA.
Source: Authors’ calculations using TAXBEN, the IFS tax and benefit microsimulation model, and Family Resources Survey 2022–23.
Figure A2 in the appendix shows the PTRs for workers in other family types, which broadly mirror those seen among all workers. Taken as a whole, the UC reform does strengthen incentives to be in paid work on average, especially for those who had particularly weak incentives to start with.
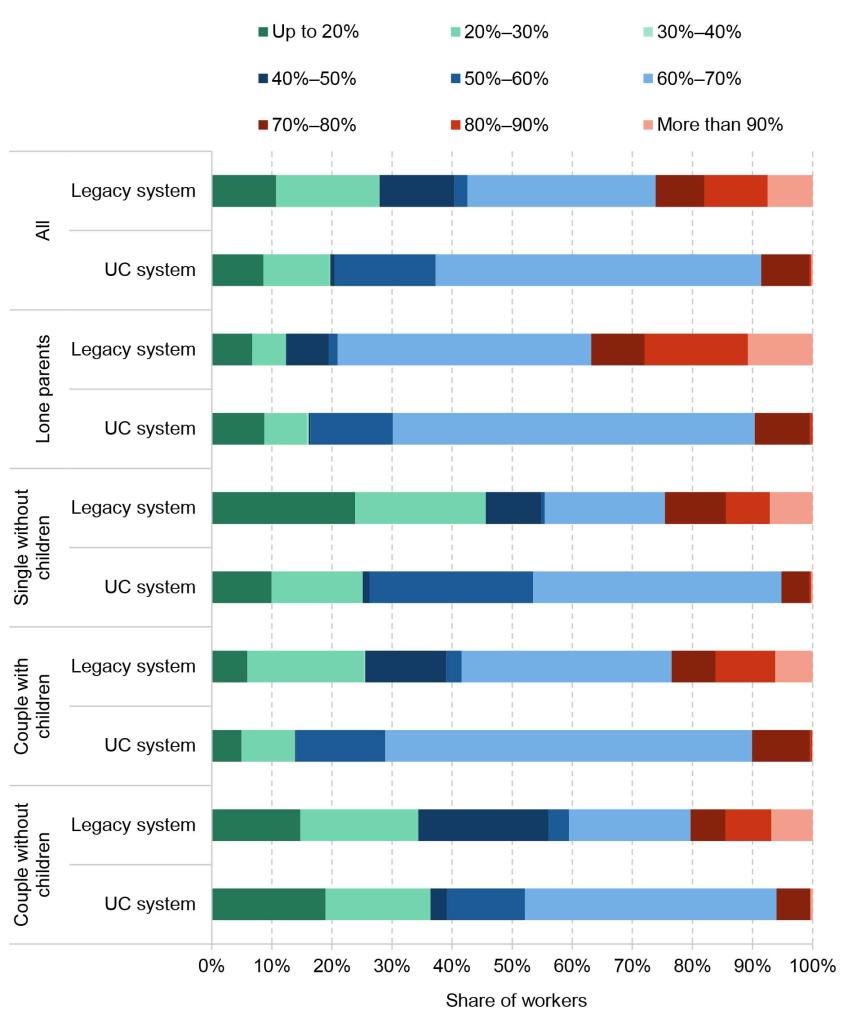
We now consider the financial incentives for workers to slightly increase their earnings, measured by the METR. The average METR is unchanged by the UC reform: among workers entitled to means-tested benefits, it remains at 55%8. But this hides much more substantial changes in the distribution. Figure 6 shows the distribution of METRs among all workers entitled to means-tested benefits and among lone parents.
Figure 6. Marginal effective tax rates, among workers entitled to either UC or legacy benefits
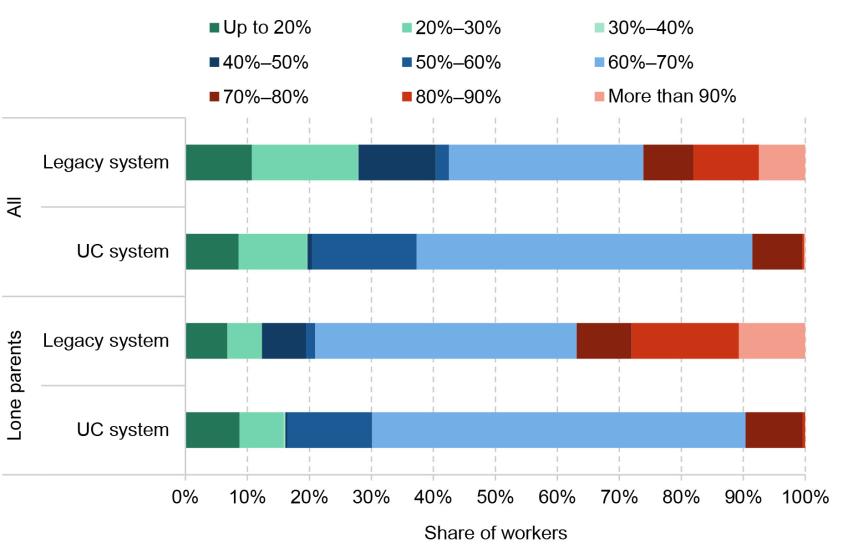
Note: Sample includes all working individuals in families entitled to legacy benefits or universal credit, with an adult aged below SPA.
Source: Authors’ calculations using TAXBEN, the IFS tax and benefit microsimulation model, and Family Resources Survey 2022–23.
- Under the UC system, the share of workers facing a METR of 70% or more – who lose at least 70p out of every additional £1 earned – is 9%, compared with 26% under the legacy system. 28% of lone parents faced a METR of at least 80% under the legacy system, while this is the case for almost none under UC.
- These changes are largely a consequence of UC having a single taper rate, rather than withdrawing multiple benefits simultaneously as under the legacy system. This eliminates extremely high tax rates which heavily disincentivise individuals from working more.
- There is one key exception: council tax support (CTS) remains outside UC and is withdrawn simultaneously. This is why the majority of workers face a METR of 60–70% under the UC reform, despite the taper rate being 55%.
While the proportion of workers facing extremely high marginal tax rates is lower under the UC reform than under the legacy system, the number of workers facing very low marginal tax rates (hence with very strong work incentives) is also lower under the UC system. Figure A3 in the appendix shows that this pattern is driven by single workers without children and couples with children9. The changes are partly explained by the 1.1 million workers who are not eligible for legacy benefits but are eligible for UC – a consequence of the slower withdrawal of UC compared with legacy benefits. By bringing these workers into means-testing, their incentives are substantially weakened: under the legacy system, they would just pay tax, giving them a typical METR of 28%; but under the UC system, they also see their UC withdrawn, giving them a typical METR of 60%. Conversely, there are 900,000 workers who are eligible for legacy benefits but do not qualify for UC, mostly from families on tax credits who have more than £16,000 in assets or homeowners who do not satisfy the UC means test10. These individuals see their work incentives strengthened under UC for equivalent reasons – UC takes them out of means-testing.
It is worth emphasising a slightly subtle point here. For existing legacy claimants, UC on average slows the speed at which benefits are withdrawn, reducing their METRs on average. But this makes UC extend further up the income distribution, bringing more workers into means-testing and (quite significantly) increasing their METRs. Overall, the impact taking all of these effects into account is to leave average METRs little changed.
Given that the UC reform makes relatively little difference to average METRs, what should one make of the fact that it reduces the prevalence of both the highest and lowest METRs? The key reason to be concerned about higher tax rates on working is that they distort individuals’ work choices. But this distortion increases more than proportionally to the tax rate, meaning that – all else equal – it is preferable to have two people with a METR of 60% rather than one person with a METR of 50% and one with a METR of 70%11. This aspect of the UC reform is therefore probably a welcome one.
Since the UC reform makes no difference to workers’ METRs on average but strengthens the incentive for workers to be in work (lower PTRs), it can be thought of as strengthening the incentive to work part-time but doing little to change workers’ incentives to work full-time. Hoynes, Joyce and Waters (2023) show this directly – the tax rate moving from part-time work to full-time work is little changed by the UC reform, despite a lower tax rate when moving from unemployment to part-time work. There is evidence that full-time work is better for workers’ career progression (Blundell et al., 2016; Goll, Joyce and Waters, 2023), so this aspect of UC may be an area that a future government might consider adjusting.
4. Broader issues and challenges facing the next government
The introduction of UC has fundamentally changed the system of means-tested benefits in the UK. So far, we have focused on the impact of the reform on household incomes and work incentives. We have found that UC removes some of the greatest work disincentives from the legacy benefits system, caused by the simultaneous withdrawal of multiple benefits. In its current form, it also represents a net giveaway to households on average, as the reduced taper rate and higher work allowances allow households to keep more of their earned income. But there are some types of families who lose out from UC, and these losses can be very large. In particular, families receiving disability benefits and families with one adult over state pension age and one below are generally much worse off under the UC reform.
As well as changing incomes and financial incentives, UC also changes the practical experience of applying for and getting the benefit. By combining a large patchwork of benefits into a single one as UC does, it potentially eases the burden of applying for families, and can respond more flexibly when they experience a change in circumstances. For example, if an individual loses their job, their UC amount will adjust to reflect this fairly straightforwardly, without the need to apply for a new benefit. Under the legacy system, they would no longer be eligible for working tax credit, and would need to apply for an out-of-work benefit (such as jobseeker’s allowance) in order to get their full entitlement. The same is true, in reverse, when moving into work. The level of automation under UC was particularly important during the pandemic, when there were an extremely high number of applications during a very short period.
UC has brought other changes to the administration of means-tested benefits, which do not affect households’ incomes but can have significant implications for their welfare. Universal credit is paid in arrears, meaning that households’ needs are assessed over a month and they receive a payment after that based on their needs in that month. The rationale for this was to reduce over- and under-payments, and UC has been largely successful along these lines – in 2021–22, for UC around 15% of expenditure was either over- or under-paid, whereas for tax credits the figure was 40%12. But, as consequence of payment in arrears, new applicants to UC must wait before they receive any UC13. This is known as the five-week wait, which has been the subject of a significant amount of criticism for causing difficulties for families with few resources to draw upon. The government has expanded a system of loans (‘advances’) to ease this; it is not clear to what extent the five-week wait continues to cause problems14. Other changes under the UC system include a shift to monthly payments (instead of every two weeks as in jobseeker’s allowance, for example), paying housing support to tenants rather than landlords, and not allowing payments to be split between the members of a couple. All of these changes could make budgeting harder for UC recipients. In Scotland, families have the options of being paid twice a month and having their housing element paid directly to their landlord. 23% of Scottish families on UC have opted for more regular payments and 18% of those receiving the housing element have it paid directly to their landlord. Such options are not available in the rest of the UK (except in unusual circumstances), but these statistics suggest that, at least for a sizeable fraction of the population, they would be valued.
We have seen in this report that the UC reform makes large numbers of households worse off, even though the average household gains from it. Families receiving disability benefits, mixed-age couples, the self-employed and those failing a harsher assets test are much worse off under the UC system than under legacy benefits. There are transitional protections in place to ensure families do not lose out when moving from the legacy system to UC in the short run. But under current plans, they will still be left worse off in the long run. One policy option for a future government would be to permanently compensate these and other families who are left worse off under UC. But doing so would be expensive, making the UC reform a larger net giveaway than it already is.
We have also shown that UC has successfully reduced the number of workers facing very high tax rates on work. A future government may wish to go further in limiting work disincentives created by the means-tested benefit system. One way to do this could be to (again) reduce the UC taper rate or to increase work allowances, so workers have less UC withdrawn as their earnings rise, which would require greater spending. Another option could be to integrate council tax support, which has remained a parallel benefit to UC. Hoynes, Joyce and Waters (2023) find that integrating CTS into UC would reduce the proportion of workers facing marginal tax rates above 75% from 6% to practically zero, at a cost of £2 billion per year. But, as we have drawn out in this report, while these types of approach would strengthen incentives to increase earnings for existing claimants, they would weaken those incentives for workers who become newly eligible for UC.
Even in 2024–25, 11 years after it began, the UC roll-out will continue. The next parliament will see the migration of the final 1.2 million legacy benefit claimants to UC, which is now due to be completed by the end of 2025 (see Child Poverty Action Group (2024) for more details). The key risk here is that because legacy claimants must make an application for UC to receive the benefit (i.e. they are not automatically migrated), if they do not do so their benefits will stop entirely – and even if they claim subsequently, they will not be eligible for transitional protection. Several months before their legacy benefits will stop, claimants are sent a ‘migration notice’ telling them that they need to apply. But evidence from the migration of 381,000 tax-credit-only recipients last year suggests that this is often not enough: 32% (122,000) had their tax credit payments terminated before they managed to claim UC (Child Poverty Action Group, 2024). If this rate persisted for the rest of the migration from legacy benefits to UC, this would mean 400,000 claimants failing to move to UC before their benefit payments are stopped.
The largest group still to be migrated is recipients of employment and support allowance, of whom there are roughly 890,000. These recipients form a particularly vulnerable group who may face even more acute difficulties with putting in a UC claim, and the Department for Work and Pensions is offering an ‘enhanced support journey’ to help ease the transition, including text messages, home visits and, where necessary, extensions to the deadline before benefit payments are interrupted. Getting this assistance right will be a critical issue for the next government – one can easily imagine a world where large numbers of disabled claimants, often receiving over £10,000 a year in means-tested benefits, suddenly end up without any of that support.
Appendix
Figure A1. Impact of universal credit on working-age households entitled to means-tested benefits, by household tenure (share of all entitled households in parentheses)
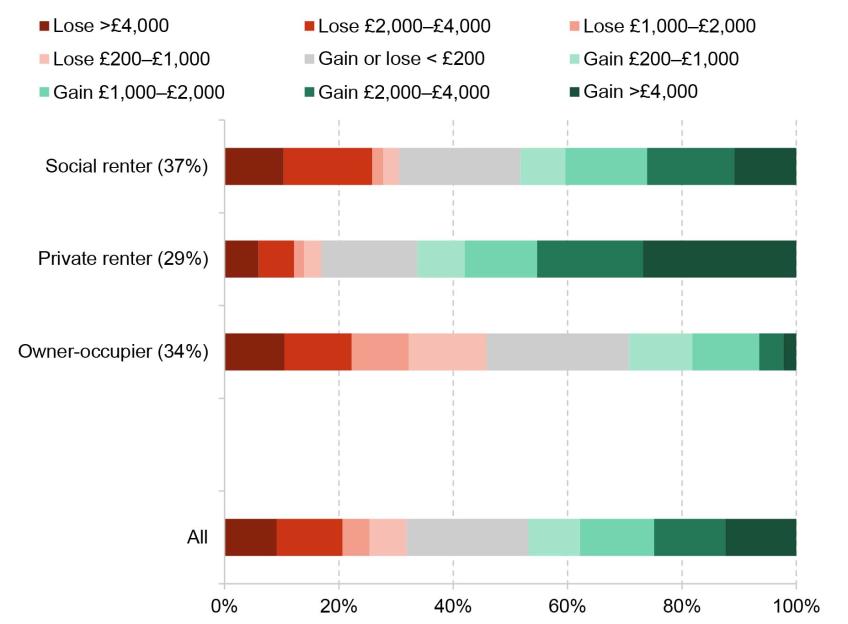
Note: Incomes have been measured net of taxes and benefits and are expressed in 2024–25 prices. Total number of entitled households is 8 million.
Source: Authors’ calculations using TAXBEN, the IFS tax and benefit microsimulation model, and Family Resources Survey 2022–23.
Figure A2. Participation tax rates, among workers entitled to either UC or legacy benefits
Note: Sample includes all working individuals in families entitled to legacy benefits or universal credit, with an adult aged below SPA.
Source: Authors’ calculations using TAXBEN, the IFS tax and benefit microsimulation model, and Family Resources Survey 2022–23.
Figure A3. Marginal effective tax rates, among workers entitled to either UC or legacy benefits
Note: Sample includes all working individuals in families entitled to legacy benefits or universal credit, with an adult aged below SPA.
Source: Authors’ calculations using TAXBEN, the IFS tax and benefit microsimulation model, and Family Resources Survey 2022–23.
References
Blundell, R., Costa Dias, M., Meghir, C. and Shaw, J., 2016. Female labor supply, human capital, and welfare reform. Econometrica, 84(5), 1705–53, https://doi.org/10.3982/ECTA11576.
Brewer, M., Joyce, R., Waters, T. and Woods, J., 2020. A method for decomposing the impact of reforms on the long-run income distribution, with an application to universal credit. Economics Letters, 192, 109230, https://doi.org/10.1016/j.econlet.2020.109230.
Browne, J., Hood, A. and Joyce, R., 2016. The (changing) effects of universal credit. In R. Chote, C. Emmerson and J. Shaw (eds), The IFS Green Budget: February 2016. https://ifs.org.uk/books/changing-effects-universal-credit.
Child Poverty Action Group, 2024. Managed migration 5. https://cpag.org.uk/news/managed-migration-5.
Department for Work and Pensions, 2022. Completing the move to universal credit. https://www.gov.uk/government/publications/completing-the-move-to-universal-credit.
Department for Work and Pensions, 2024. Universal credit statistics, 29 April 2013 to 11 April 2024. https://www.gov.uk/government/statistics/universal-credit-statistics-29-april-2013-to-11-april-2024.
Goll, D., Joyce, R. and Waters, T., 2023. Intensive margin labour supply and the dynamic effects of in-work transfers. IFS Working Paper 23/03, https://ifs.org.uk/publications/intensive-margin-labour-supply-and-dynamic-effects-work-transfers.
Griffiths, R. and Wood, M., 2024. Coping and hoping: navigating the ups and downs of monthly assessment in universal credit. University of Bath, Institute for Policy Research, https://www.financialfairness.org.uk/en/our-work/publications/income-volatility-on-universal-credit.
Hoynes, H., Joyce, R. and Waters, T., 2023. Benefits and tax credits. IFS Deaton Review of Inequalities. https://ifs.org.uk/inequality/benefits-and-tax-credits/.
Office for Budget Responsibility, 2012. Economic and fiscal outlook – December 2012. https://obr.uk/efo/economic-and-fiscal-outlook-december-2012/.
Data
Department for Work and Pensions, NatCen Social Research. (2021). Family Resources Survey. [data series]. 4th Release. UK Data Service. SN: 200017, DOI: http://doi.org/10.5255/UKDA-Series-200017.
Endnotes
Authors

Sam Ray-Chaudhuri
Sam joined the IFS in 2022 and works as a research economist in the Income, Work and Welfare sector.

Tom Waters
Tom is an Associate Director at the IFS and Head of the Income, Work and Welfare sector.
More from IFS
Understand this issue


Policy analysis


Academic research


