
Downloads

Download the chapter as a PDF
PDF | 1.78 MB
Acknowledgements
This chapter has been produced as part of the IFS Green Budget 2026 with funding from CIPFA. The 2026 edition of the IFS Green Budget is funded by the Nuffield Foundation, Barclays and the Economic and Social Research Council (ESRC) through the Centre for Microeconomic Analysis of Public Policy (CPP). IFS is an independent Research Institute. As with all pieces of work, IFS has full editorial control over its analysis and conclusions. In addition to providing funding, Barclays authors will write chapters for the 2026 Green Budget, covering topics (the macroeconomic outlook and bond markets) where their expertise complements that of IFS.

Devolution has recently risen to the top of the political agenda, forming a key plank of the new Prime Minister Andy Burnham’s plans for boosting growth, improving public services, and changing how politics and policymaking are conducted in the UK, and England in particular. But perhaps the single biggest change currently in train was started by the last Chancellor Rachel Reeves in March: allocating a share of business rates and income tax revenues to English mayoral strategic authorities (MSAs), based on revenues collected from their areas. Mr Burnham has confirmed that a ‘roadmap’ setting out more detail on plans for such a system of ‘revenue assignment’ will be published alongside the Budget. This chapter considers the rationales for revenue assignment, and discusses the issues and options facing the government in designing the new system. Will it help boost growth and tackle regional inequality? Are income tax and business rates appropriate for assignment? What arrangements for redistribution and insurance should the government consider? And are MSAs the right tier of government to assign revenues to?
Key findings
- All of England is covered by local authorities with responsibility for a range of services including social care, public health and some schools. In addition, England now has 20 strategic authorities that sit above local authorities. These currently cover 65% of the population, with an ambition of reaching 100% by the end of 2028. Their precise powers and responsibilities vary substantially, but generally include elements of economic development, transport, housing, strategic planning, skills and employment support policy, with some, such as the Greater London Authority, also responsible for police and fire services. The subset of strategic authorities that are led by elected mayors (MSAs) have more powers and responsibilities than those without – with the most powers granted to mayoral authorities that the government deems have a track record of successful delivery and good governance arrangements (termed ‘established’ MSAs).
- A majority of the funding available to strategic authorities is provided by central government grants: a forecast £15.7 billion in total this year, or £457 per person on average. Grant funding varies from £38 per person for Cumbria Combined Authority to £832 per person for Greater London, mostly reflecting differences in their responsibilities. Strategic authorities also generate income from investment activity and can borrow for capital investment purposes. MSAs can also levy supplements to both council tax and business rates – although only a few make use of these powers. These other sources of funding amount to a forecast £10.2 billion this year, or £296 per person on average – albeit again with huge variation across authorities.
- Fewer revenues are devolved or assigned to subnational government in England than in most other high-income countries. English local and strategic authorities are also more reliant on grant funding than subnational governments in other countries: approximately 60% of English local and strategic authority spending is funded by central government grants, compared with 20–30% in Canada, France, Germany and the US. Canada, France, Germany and Japan all make greater use of revenue assignment specifically as a means of funding subnational governments.
- Assigning a share of tax revenues to MSAs will not give mayors more direct control over their funding – tax rates will still be set nationally. But it will bring a range of opportunities. First, by linking their funding more closely to the performance of local tax revenues, assignment could provide MSAs with stronger financial incentives to facilitate economic growth. Second, if MSAs can retain some of the additional revenues generated by their investments, this could be used to help finance the borrowing to pay for those investments in the first place – so-called tax-increment financing. And third, while tax revenues are subject to some uncertainty, the permanent assignment of tax revenues may provide MSAs with greater long-term clarity over funding than their current reliance on mostly short-term grant funding.
- Revenue assignment also brings risks, including both short-term revenue volatility and longer-term divergences in revenues relative to different MSAs’ spending needs – often due to factors outside mayoral control. There is also the potential for excess competition between MSAs for private sector investments or for high earners to locate in their areas.
- International evidence suggests impacts on both economic growth and financial sustainability will depend crucially on the design of the revenue assignment system and on local capacity and governance quality.
- Local authorities and some MSAs already share in local growth in business rates revenues via the business rates retention scheme (BRRS). Assigning MSAs a bigger share of business rates would provide stronger incentives for them to support the development of new and improved non-domestic property – which they potentially could do through their powers over strategic planning, economic development and transport. Given the BRRS already exists, this change would be fairly straightforward to administer. But, as with the existing BRRS, it will be important to take account of the big differences in how much is raised from business rates in different MSA areas: revenues per person this year are forecast to be around three times higher in Greater London (£1,214) than in the North East MSA area (£400).
- Assigning a share of income tax revenues based on where people live (rather than where they work) would provide a different, arguably complementary set of incentives to business rates retention. It would incentivise authorities to increase the taxable incomes of their residents, including through commuting to high-paid jobs in neighbouring areas or remote working. The partial devolution of income tax to Scotland and Wales shows that residence-based income tax assignment would be administratively possible, although it would entail somewhat higher set-up and running costs than (increased) business rates assignment. As for business rates, there are large differences in income tax revenues across MSAs: in 2023–24, we estimate income tax revenues per person were over three-and-a-half times higher in Greater London (£8,587 in today’s prices) than in the Tees Valley MSA area (£2,389).
- There are different ways that income tax revenues could be assigned to MSAs. The simplest option would be a flat percentage (e.g. 10%) of all income tax revenues. Income tax is progressive, meaning higher earners face a higher marginal tax rate. As a result, a given increase in income for a higher- or top-rate taxpayer would generate two or more times as much funding for their MSA as an equivalent-sized increase in income for a basic-rate taxpayer. Under this approach, MSAs would therefore have a stronger financial incentive to boost the incomes of high-income taxpayers than low- and middle-income taxpayers. Another approach would be to assign MSAs revenues from a fixed number of percentage points of the tax rates for these different tax bands (e.g. 3ppt). This would mean MSAs would benefit equally from boosting the incomes of low-, middle- and high-income taxpayers. Conversely, they would benefit less financially if, over time, more of their taxpayers become higher- or top-rate taxpayers – including from fiscal drag.
- Given the very significant variation in both the underlying tax revenues collected in each area and MSAs’ existing grant funding – particularly between Greater London and the Northern and Midlands MSAs – we recommend that a formal system of equalisation should be used to offset these differences. As part of this, the government will need to decide how much business rates and income tax revenue to assign, and how much to equalise (how much funding to redistribute) for the large differences in revenues and existing grants across MSAs. This is mostly a political question: how willing are the government and mayors to see variation in an MSA’s funding based on how tax revenues perform locally? But decisions should also reflect views on what the main rationale for revenue assignment is: if it is to directly incentivise growth and enable tax-increment financing, then a higher rate of assignment and/or less ongoing equalisation for changes in revenues would provide stronger incentives; conversely, if the aim is longer-term clarity over funding, then a lower rate of assignment and/or more ongoing equalisation for changes in revenues would protect MSAs more from revenue volatility and uncertainty.
- Trade-offs between incentives, funding certainty and redistribution cannot be fully avoided when designing a revenue assignment system, but they can be ameliorated. Initial equalisation payments could be set so that no MSA immediately gains or loses from revenue assignment, without this adversely affecting incentives for future revenue growth. There is a strong case for uprating these initial equalisation payments each year in line with average growth in assigned tax revenues; MSAs would still gain from faster growth in their areas, preserving their incentives, but this would ensure equalisation payments do not fall relative to overall assigned revenues, which they likely would if held fixed in cash or even real terms. The government will also need to decide whether to include ‘floors’, ‘ceilings’ or ‘tapers’ in the system to limit the biggest decreases and increases in assigned revenues, and whether and how to eventually ‘reset’ the system, updating equalisation payments to reflect changes in MSAs’ revenues and spending needs, to avoid divergences between MSAs growing indefinitely. The government should consider whether different arrangements are required for Greater London, given its much higher tax revenues per person than other MSAs’.
- We model a series of scenarios for future revenues and show that these choices around system design will have significant effects on the funding and financial risks facing different MSAs. For instance, we consider a scenario where 10% of income tax revenues are assigned to all MSAs in lieu of the portion of grants they currently receive as integrated settlements, and all areas see the same growth in their underlying income tax revenues. If equalisation payments were inflation-linked, Greater London’s post-equalisation income could outpace that of other MSAs to the tune of billions of pounds a year within 10 years. Revenue-indexing equalisation payments would avoid this and mean the Greater London Authority (and other MSAs) would only see their net revenues outpace others if their underlying income tax revenues did too.
- While the government has said it plans to increase the share of business rates assigned to local authorities, as well as to MSAs, it does not currently plan to assign a share of income tax to them. This is a reasonable decision. Assignment would create stronger, broader financial incentives for local authorities to support growth too, as well as a long-term funding source, but the challenges and risks would also be greater for local authorities. Revenues are even more unequal at local authority level than at MSA level, and likely subject to greater volatility and risk too. And most local authorities’ spending goes on the provision of services (such as social care) for vulnerable residents, where one may place a greater weight on ensuring funding aligns with need.
9.1 Introduction
Recent years have seen a new middle tier of government sitting between central government and local authorities spread across large parts of England, including its largest cities. Now termed ‘strategic authorities’, these new institutions have been given varying powers over elements of economic development, transport, housing, spatial planning, skills and employment support policies, with the aim of better tailoring and joining up efforts to boost local economic growth and improve residents’ well-being. The main source of funding for these authorities is currently central government grant funding. This is mostly provided through a combination of ring-fenced grants for specific responsibilities and – in seven of the longest-established authorities led by elected mayors –an ‘integrated settlement’ offering authorities a little more flexibility on how money is allocated between different responsibilities.
The new Prime Minister Andy Burnham was, until June, the Mayor of Greater Manchester and head of that city-region’s strategic authority. In his first major speech after announcing his intention to stand for the leadership of the Labour Party (Burnham, 2026), he drew upon his experience as mayor to strongly criticise the current system of governing England as too centralised and siloed, and to advocate for deeper devolution across England as a whole (as well as within Scotland, Wales and Northern Ireland). Since he became Prime Minister, his Cabinet has confirmed that a new devolution White Paper will be published alongside the Budget on 28 October, giving strategic authorities in England more powers over 16–19 education, rail transport, and housing and planning, and potentially a greater say in other services such as the NHS (Cabinet Office, 2026).
But perhaps the biggest change that is currently in train was initially signalled by the last Chancellor Rachel Reeves in her Mais Lecture in March, and confirmed by Mr Burnham in July. This is the development of a ‘roadmap’ for fiscal devolution, also to be published alongside the Autumn Budget. The heart of this will be a plan for sharing a portion of the revenues raised from income tax and business rates with mayoral strategic authorities (MSAs), based on the performance of revenues from their areas – a policy termed ‘revenue assignment’. Alongside new powers to levy taxes on overnight visitor accommodation (a ‘tourism tax’), this will complement existing and planned administrative and spending devolution with greater revenue devolution.
The introduction of revenue assignment will not lead to big overnight changes in funding. The aim is for the revenue assignment system to be revenue-neutral at the point of introduction, with newly assigned revenues replacing existing grant funding, rather than providing an immediate boost to mayors’ overall funding. And mayors would not be able to vary tax rates: they will still be set nationally.
However, MSAs and their residents would have a stronger financial stake in improving local economic performance, as strong economic growth would boost the funding available for mayors to spend. For example, the new Mayor of Greater Manchester Bev Craig would, over time, gain if the assigned income tax and business rates revenues from Greater Manchester performed well, and lose if they performed poorly. The permanent assignment of a share of tax revenues to MSAs could also give them greater long-term clarity over their future funding than relying on grants from central government that are confirmed for a few years ahead, at best. But it would expose them to the year-to-year volatility of tax revenues and the risk of long-term falls in revenues due to factors potentially outside of their control.
The details of the systems for assigning business rates and income tax revenues will matter for their effects on: the financial incentives facing MSAs; the level and certainty of their funding; their financial sustainability and resilience; and wider economic and social outcomes. Key choices include precisely which business rates and income tax revenues to assign, the specifics of any system of equalisation and insurance to limit divergence and volatility in funding, and whether income tax revenue assignment should extend to local authorities. Answers to these design choices will be needed for the roadmap being published alongside the Budget and the options available are the core focus of this chapter, which proceeds as follows.
Section 9.2 describes England’s system of strategic and local authorities, including how they are currently funded. It briefly compares this with how subnational governments in other high-income countries are funded, distinguishing revenue assignment from true revenue devolution, where subnational governments have some control over tax rates and/or bases.
Section 9.3 discusses the potential advantages and disadvantages of revenue assignment in general, relative to funding authorities either through grant funding or true revenue devolution. It also briefly discusses the (limited) evidence on the effect of revenue assignment on economic outcomes.
Section 9.4 explains the government’s plans and objectives for assigning business rates and income tax revenues. It provides a set of criteria for assessing the suitability of different taxes for assignment and applies these to business rates and income tax.
Section 9.5 discusses three key decisions the government will need to make to implement revenue assignment. First is whether to roll out assignment to all MSAs in one go or to trial it for a subset of MSAs first. Second is the form of income tax revenue assignment to pursue, which need not be based on a flat share of all income tax revenues. And third is how much revenue to assign and which grants should be replaced with assigned revenues.
Section 9.6 looks in detail at the options for the design of an equalisation and insurance system for assigned revenues, with a particular focus on how they affect the incentives and risks that would be faced by MSAs, and the potential for funding divergences between different parts of England. It argues that a trade-off between financial incentives and the risk of funding divergences can be ameliorated, although not eliminated, through appropriate mechanism design.
Section 9.7 uses quantitative modelling to show how big the financial effects of different assignment, equalisation and insurance mechanisms for income tax could be for different MSAs in different scenarios. Appendix 9A provides information on the data and assumptions used in this modelling.
Section 9.8 examines the case for and challenges associated with assigning further revenues to local authorities – which cover smaller and more differentiated areas than strategic authorities.
Finally, Section 9.9 draws our analysis together, emphasising the key decisions about the new revenue assignment system that the new Prime Minister and Chancellor will have to take in conjunction with stakeholders as they develop their fiscal devolution roadmap, and how these should be guided by their wider vision and objectives for devolution.
9.2 English strategic and local authority funding in an international context
What are English strategic and local authorities responsible for?
The whole of England is covered by local authorities (or ‘councils’) responsible for the provision of a range of public services including:
- adults’ and children’s social care services;
- public health services;
- local roads and support for buses;
- refuse collection and disposal, and other local environmental services;
- licensing and local regulatory services;
- housing regulation and homelessness prevention;
- planning and building control;
- local economic development and regeneration;
- leisure centres and libraries;
- some schools (although some are directly funded by central government) and childcare;
- in some instances, fire services.
In large parts of the country, including most large urban areas, these core local public services are provided by a single ‘unitary’ authority: variously called unitary authorities, London boroughs (in the capital) or metropolitan districts (in the largest urban areas outside the capital). In other parts of the country, these responsibilities are currently split between lower-tier district councils and upper-tier county councils which each cover several districts. The government had planned to move these two-tier areas to a unitary structure by April 2028, with the aim of reducing costs and improving local services (Ministry of Housing, Communities and Local Government, 2024). However, a review of these plans was announced last month and their status is currently uncertain (Ministry of Housing, Communities and Local Government, 2026a).
As discussed above, recent years have also seen a new middle tier of government emerge in large parts of England – now termed ‘strategic authorities’.1 The first of these was the Greater London Authority (GLA), set up in 2000, led by an elected mayor and accountable to an elected assembly. Then, from 2011 onwards, new strategic authorities have been set up in many of the other most urbanised areas of England, such as Greater Manchester, Merseyside, South Yorkshire and the West Midlands, as well as a growing number of county areas too, such as Cheshire, the East Midlands – covering Derbyshire and Nottinghamshire – and Hampshire & the Isle of Wight.
There are now 20 strategic authorities in England, which collectively cover around two-thirds of England’s population (38.2 million people). The powers and responsibilities of the different strategic authorities differ, in part reflecting the use of negotiated ‘devolution deals’ for the development of the strategic authorities created between 2011 and 2025. However, the Labour government’s English Devolution and Community Empowerment Act 2026 aims to make powers and responsibilities more consistent based on the governance arrangements, institutional capacity and maturity of strategic authorities, categorised into the following three groups:
- non-mayoral ‘foundation’ strategic authorities (FSAs) where authority lies with boards made up of the leaders of the local authorities that sit under the strategic authority, and which have the fewest powers;
- mayoral strategic authorities (MSAs) which have (or are soon to have) elected mayors, who can decide certain matters directly and who need the agreement from a majority or supermajority of the boards for other decisions;2
- ‘established’ mayoral strategic authorities (E-MSAs), assessed by central government to have high capacity and mature governance arrangements, which are being provided with the most powers (and the ability to request additional powers).
As shown in Table 9.1, there are currently two FSAs, seven MSAs and eleven E-MSAs (four of which were awarded this status in July 2026). Just under two-thirds of the population (65%, 38.2 million) live in areas that currently have a strategic authority, while just under half (47%, 27.8 million) live in areas covered by E-MSAs. As illustrated in Figure 9.1 though, while all of the North of England is covered by strategic authorities, large parts of the South and Midlands remain uncovered. The government’s aim is for all areas to be covered by strategic authorities by the end of 2028, but it does not have the power to compel local areas to set up a strategic authority. At the time of writing, plans are confirmed for two further MSAs covering Greater Essex (Essex, Southend-on-Sea and Thurrock) and Norfolk & Suffolk (Ministry of Housing, Communities and Local Government, 2025a), with negotiations between local authorities and the government ongoing for the remaining areas of the country.
Table 9.1. List of strategic authorities in England
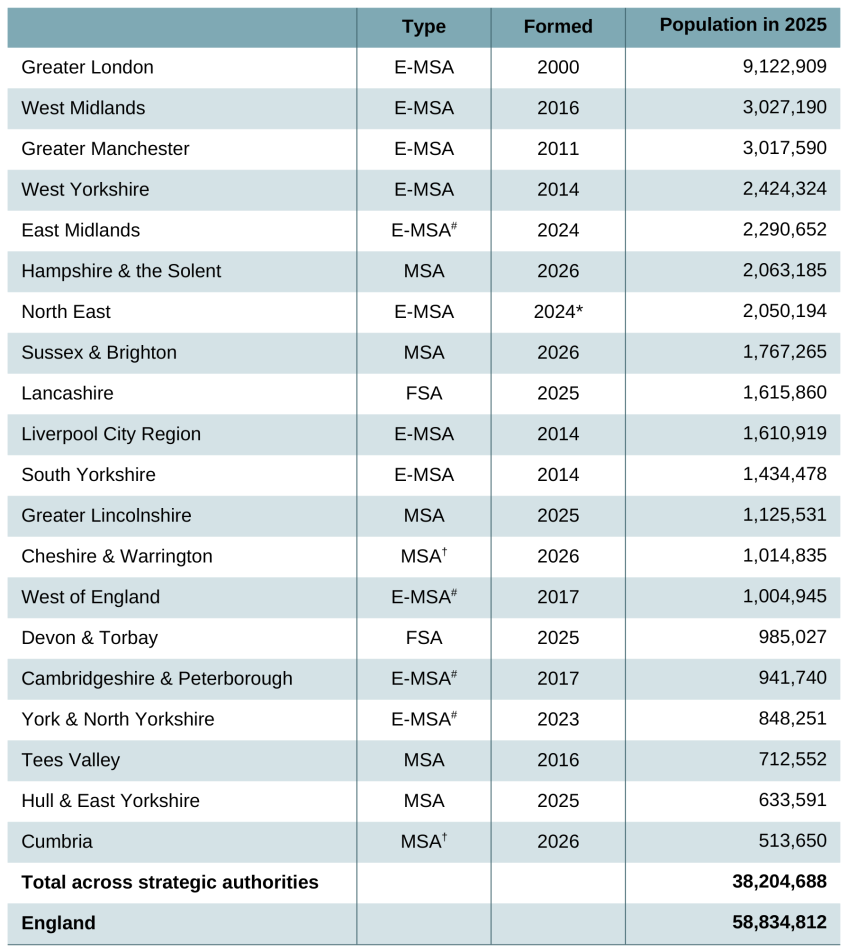
* An original North East authority was in place between 2014 and 2018. However, between 2018 and 2024, the region was covered by two strategic authorities: the non-mayoral County Durham, Gateshead, South Tyneside and Sunderland authority (covering said local authorities) and the mayoral North of Tyne authority (covering Newcastle-upon-Tyne, Northumberland and North Tyneside). These re-merged in 2024 as a single mayoral authority.
† Cheshire & Warrington and Cumbria will hold their first mayoral elections in May 2027.
# These four mayoral strategic authorities gained E-MSA status in July 2026. The other seven E-MSAs receive much of their funding through an ‘integrated settlement’.
Note: Mid-2025 resident population in the geographic areas covered by current strategic authorities. Authority type is as of September 2026.
Source: Authors’ calculations based on ONS mid-year population estimates (Office for National Statistics, 2025).
Figure 9.1. Map of strategic authorities in England (as of July 2026)
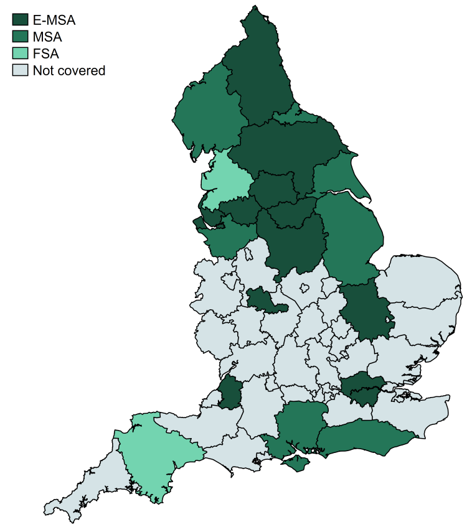
Note: Upper-tier local authority boundaries are shown in areas not covered by strategic authorities as of July 2026.
Bearing in mind these differences, and the aforementioned plans for further devolution of spending set out by the Burnham administration, the responsibilities and powers of strategic authorities currently fall under the following categories:3
- Economic development and regeneration. All MSAs are required to produce local growth plans to be implemented in partnership with the UK government and local authorities, while FSAs are required to set out a less formal ‘vision for growth’. After notifying the government, MSAs can borrow for investment related to redevelopment (such as site development and land remediation), as well as for other capital purposes. All strategic authorities can pay grants to constituent local authorities and, subject to the UK’s subsidy control regime, provide grants and loans to local businesses.
- Transport and local infrastructure. All strategic authorities have the responsibility for preparing a local transport plan and a bus strategy plan, as well as managing concessionary bus fare schemes for their areas, for which they can charge levies to their constituent authorities. They can also franchise local bus services.4 MSAs must also define and manage key roads in their area, while FSAs can do so in agreement with constituent local authorities. Established MSAs can also request a statutory role in planning and developing local rail services, including the devolution of responsibility for certain services and stations (Greater London and Liverpool City Region already have such powers).
- Housing and strategic planning. All strategic authorities are required to produce a spatial development plan setting out long-term plans for the amount and location of new housing and commercial property, as well as enabling infrastructure. They can also acquire and dispose of land for housing purposes and provide financial assistance to enable housing development. In addition, MSAs can ‘call in’ strategic planning applications if they think local authorities have made the wrong decision, establish mayoral development corporations to coordinate the development of specific strategic sites, and set an infrastructure levy payable by developers. They also have a greater role alongside Homes England in planning investment in social housing, with Greater London controlling its own social housing investment budget.
- Skills and employment support. All strategic authorities have funding and responsibility for non-apprenticeship adult education budgets. MSAs and especially established MSAs have an increasing role in the co-design and delivery of employment support programmes outside of Jobcentre Plus, with a particular focus on young adults and those with disabilities or health conditions, as well as integrating employment support with skills provision and local growth plans.
- Environment and climate change. All strategic authorities have the responsibility for coordinating which areas should be subject to requirements for district heating systems. More generally, they may coordinate and fund initiatives related to decarbonisation and energy efficiency, and environmental and biodiversity protection.
- Health, well-being and public service reform. All strategic authorities have a duty to consider how they can improve health and reduce health inequalities. They can develop regional health and well-being strategies, and support coordination between different public bodies. In a trial in Greater Manchester and South Yorkshire, chairs of the local NHS integrated care board will report to mayors as well as to NHS England.
- Public safety. All strategic authorities can help fund and coordinate community safety projects. MSAs can, where geographies align, become responsible for police and/or fire services, as is already the case in Greater London and several other MSAs.5
How are English strategic and local authorities funded?
Both English strategic authorities and local authorities are funded via a mix of central government grant funding, local tax revenues, fee and commercial income, and capital borrowing.
Overall strategic authority funding
The government does not collate comprehensive figures on strategic authorities’ funding. However, based on figures reported in their resource and capital budget returns for 2026–27,6 we estimate that funding and borrowing for the 18 strategic authorities that were in place when these returns were submitted amount to approximately £25.9 billion this year, or an average of £753 per person in the areas they cover. This estimate excludes income from fees and charges for the services they provide (including public transport), which is netted off the reported budget figures.
Council tax. MSAs, but not FSAs, can set a surcharge (or ‘precept’) on council tax bills, although only five do so currently. The vast majority of the revenue raised by these precepts is for police services, and just three MSAs (Greater London, Greater Manchester and Liverpool City Region) set a precept to help pay for their other more economy-focused responsibilities. This year, MSAs’ council tax revenues are forecast to amount to £2.5 billion, with the majority (£1.7 billion) being for Greater London.
Business rates. Five MSAs (Greater London, Greater Manchester, West of England, West Midlands and York & North Yorkshire) are formally allocated a share of business rates revenues raised in their areas under the so-called business rates retention scheme (BRRS) – a revenue assignment scheme, which is discussed in more detail in Box 9.1, later in this section. Several others (such as Tees Valley) retain business rates revenues from specific Freeport and Investment Zone sites. E-MSAs also have the power to levy business rates supplements to pay for local infrastructure, although only Greater London Authority currently does so, to help fund Crossrail. MSAs received £3.4 billion in retained business rates revenues this year, almost all of which went to the Greater London Authority (just under £3.4 billion).7
Central government grants are a bigger and more widely used source of funding, with resource grants accounting for an estimated £7.6 billion and capital grants £8.1 billion of funding this year, or approximately 60% of overall strategic authority funding. For most strategic authorities, while part of their grant funding is in the form of a long-term (30-year) ‘investment fund’ that is not ring-fenced, most is provided through a series of ring-fenced grants for particular services, for anything from one to several years, each with its own reporting and outcome framework.
Integrated settlements. Seven of the established MSAs now receive part of their previously ring-fenced grant funding in the form of an ‘integrated settlement’, which provides somewhat more flexibility over how funding is used.8 In particular, rather than separate ring-fenced grants for specific services, integrated settlement funding is split into six themes aligned with MSAs’ broad responsibilities.9 These integrated settlements amount to £3.4 billion this year, with £1.6 billion for day-to-day (‘resource’) purposes and £1.8 billion for investment (‘capital’) purposes – roughly a quarter of the total resource and capital grant funding these MSAs expect to receive this year. Established MSAs can spend money as they see fit within a theme, transfer up to 10% of funding between themes, and transfer up to 10% of capital funding into resource funding. However, the integrated settlements remain far less flexible than strategic authorities’ small investment funds, and retain detailed reporting and outcome frameworks, which the National Audit Office (2026) suggests should be simplified in future. The settlements are also only confirmed until the end of the Spending Review period – currently 2028–29 for resource funding and 2029–30 for capital funding.
Other sources. In addition to local taxes and government grants, strategic authorities receive funding from a range of other sources including commercial and investment income, developer contributions and mayoral infrastructure levies, land and property sales, levies charged to constituent authorities for the provision of certain services, and the use of capital borrowing and reserves. Taken together, these amount to a forecast £4.3 billion in 2026–27, with capital borrowing (under the CIPFA prudential regime)10 accounting for £1.7 billion of this.
Most of the funding provided to or raised by strategic authorities is for responsibilities that would otherwise (and previously did) sit with central government or other public bodies (such as stand-alone police authorities or transport authorities), and which continue to sit with such bodies in areas without strategic authorities. Some funding and associated spending is clearly additional: it would not have been there if the MSA did not exist. This includes the ‘investment pot’ grants and the council tax raised by strategic authorities for their non-police non-fire functions. But it is impossible to know exactly how much of the funding provided to strategic authorities is additional, because we do not know what would now be being spent on transport and economic development projects, for example, in the strategic authority areas if the authorities had not been created.
Variation in funding between strategic authorities
Figure 9.2 shows estimated funding per person by these different sources, for the 18 strategic authorities for which budget data are available. It shows there is significant variation in both overall funding and the contribution of different funding sources across strategic authorities – mostly reflecting their different responsibilities, but also the evolving grant funding allocation processes (from the initial ‘devolution deals’ to recent more formula-based approaches). Sources of resource funding are shown in green and capital funding in blue.
Figure 9.2. Estimated strategic authority funding per person, by source, 2026–27
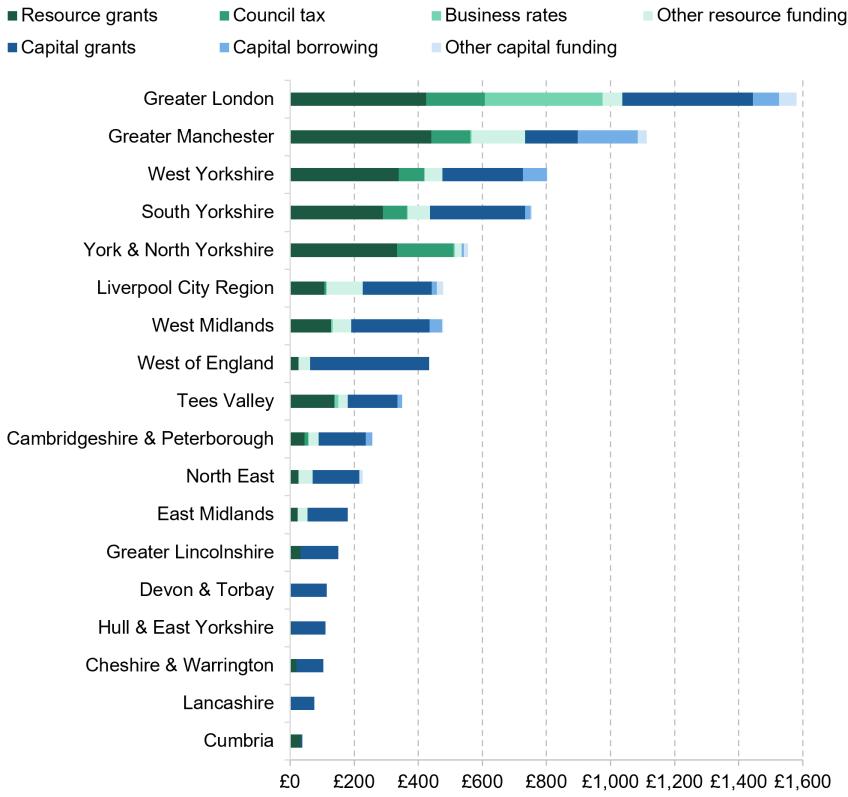
Note: Per-person estimates assume the population of each area grows in line with the projected average across England between mid 2025 and mid 2026. Excludes Hampshire & the Solent and Sussex & Brighton, for which budget data were not available. Excludes income from fees and charges for the non-commercial services that MSAs provide. See Appendix 9A for the specific budget lines included.
Source: Authors’ calculations using Revenue account (RA) and Specific and special revenue grants (SG) budget data from Ministry of Housing, Communities and Local Government (2026b and 2026c) and Office for National Statistics (2024 and 2025).
Overall, funding per person is by far the highest for the Greater London Authority (£1,580 per person), reflecting its costly policing and transport responsibilities. Its resource grant (£424 per person) and capital grant (£408 per person) funding together account for 53% of its overall funding, with council tax revenues (£183 per person) and business rates revenues (£369 per person) accounting for 35%. The Greater Manchester Combined Authority has the second-highest level of funding per person (£1,113) – again driven partly by its policing responsibilities, as well as by it having the highest level of planned capital borrowing (£187 per resident).
Levels of funding per person are much lower for the other strategic authorities – and particularly the newer ones, where the vast majority of the funding is in the form of grants from central government.
These estimates of overall funding include funding received by seven E-MSAs through their integrated settlements. As we discuss in Section 9.5, this subset of grant funding may be the most appropriate to form the core of the new revenue assignment system. Table 9.2 looks specifically at the integrated settlement components of grant funding for recipient authorities for both this year and 2028–29 (the year that income tax assignment is due to start). Differences again reflect differences in the grants and associated responsibilities that have been rolled into the integrated settlements for the different authorities, as well as differences in the amounts received per person under the various agreements and formulas used to allocate funding across places.
Table 9.2. Integrated settlement funding, 2026–27 and 2028–29 (2026–27 prices)
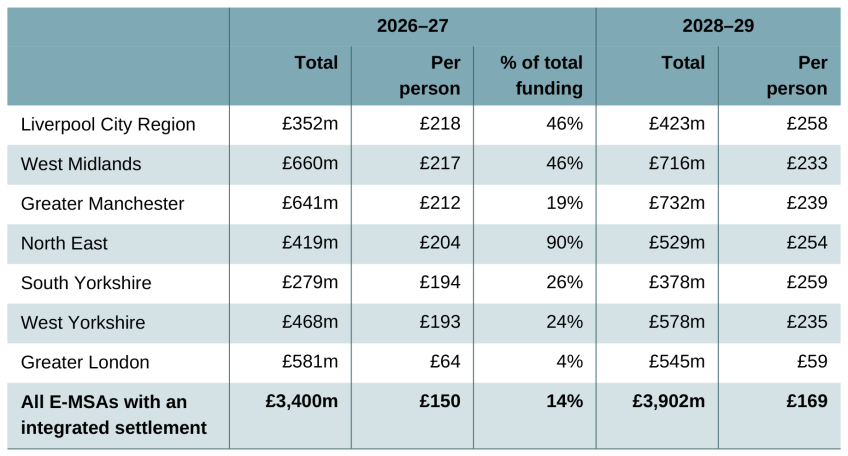
Note: Estimated total funding as shown in Figure 9.2. Real-terms figures in 2028–29 reflect latest OBR forecast for the GDP deflator.
Source: Authors’ calculations using Office for National Statistics (2024 and 2025), Ministry of Housing, Communities and Local Government (2025b) and Office for Budget Responsibility (2026a).
Bearing this in mind, the biggest differences are between Greater London and the other MSAs: integrated settlement funding for Greater London this year amounts to £64 per person, compared with between £193 and £218 per person for other E-MSAs with an integrated settlement. This is despite Greater London’s much higher levels of overall grant funding, and reflects the composition of Greater London’s grant funding – with large shares ring-fenced for police services, social housing investment and Transport for London – and existing retained business rates revenues.
Across all seven of these E-MSAs, the integrated settlements amount to £3.4 billion, or £150 per person. On average, this makes up 14% of their overall budgeted funding – although this varies dramatically across E-MSAs, from 4% in Greater London to 90% in the North East.
Total integrated settlement funding for these E-MSAs is set to increase by £0.5 billion (14%) in real terms over the next two years to £3.9 billion, which is equivalent to £169 per person (an additional £20) in today’s prices. But trends also differ over time: funding is set to fall by 7% in real terms for Greater London, but increase by 34% in real terms for South Yorkshire, reflecting big increases in the amount earmarked for capital spending on transport schemes in the latter.
Comparison with local authority funding
Local authority funding is substantially higher than strategic authority funding, and differs in its composition. Calculated on the same basis as for strategic authorities, English local authorities’ funding for resource and capital purposes (again after netting off fees and charges for the services they provide) is forecast to amount to £158 billion, or £2,680 per person across England as a whole this year.
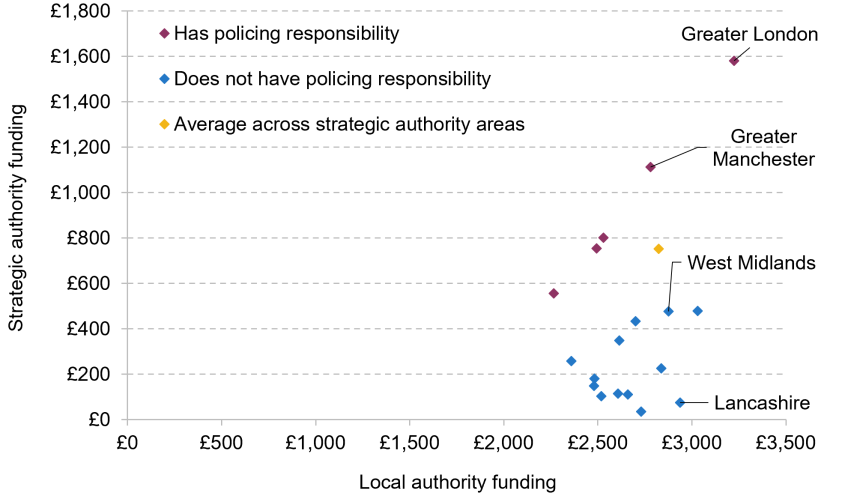
Figure 9.3 compares the amount of funding per person available to strategic authorities this year with the amount available to local authorities in their areas. Even in Greater London, where strategic authority funding is highest, local authority funding is twice as much on average (£3,224 versus £1,580). Overall, local authority funding in all parts of England covered by strategic authorities is just under four times higher than strategic authority funding, on average (£2,824 versus £753). And in most cases, particularly the newer strategic authority areas, the difference is much greater: around sixfold in the West Midlands (£2,876 versus £477); ninefold in Cambridgeshire & Peterborough (£2,360 versus £257); and over twentyfold in Cheshire & Warrington, Cumbria, Devon & Torbay, Hull & East Yorkshire and Lancashire. This pattern reflects the differing and often limited responsibilities of strategic authorities but the common and costly responsibilities of local authorities, including social care services and much of the schools and childcare budget.
Figure 9.3. Estimated strategic and local authority funding per person, by area, 2026–27
Note: Local authority funding estimates are population-weighted averages across local authority areas that were covered by strategic authorities in 2026, and exclude a small number of unitary authorities for which budget data were not available. In addition, see note and source to Figure 9.2.
Figure 9.4 compares the sources of funding for local authorities in areas with strategic authorities with the strategic authorities themselves. Several big differences stand out. First is that a much larger share of local authority funding is for resource spending (the green bars): 78%, compared with 60% across all strategic authorities and just 34% across those strategic authorities without police responsibilities. Second is that local authorities raise more of their funding through local taxes – council tax and business rates – than strategic authorities. Council tax and business rates together account for 35% of all funding, compared with 23% across all strategic authorities and 1% for strategic authorities without police responsibilities. All local authorities charge council tax and all receive a proportion of business rates revenues through the BRRS, discussed in Box 9.1.
Figure 9.4. Estimated strategic and local authority funding per person, by source, 2026–27
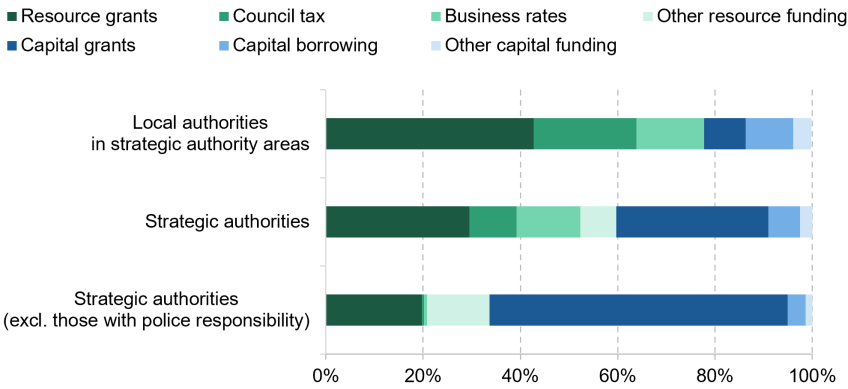
Note: ‘Strategic authorities (excl. those with police responsibility)’ excludes Greater London, Greater Manchester, York & North Yorkshire, South Yorkshire and West Yorkshire. Also see note and source to Figure 9.2.
Compared with local authorities, strategic authorities therefore have more capital-intensive and grant-dependent funding. The former reflects strategic authorities’ economy- and investment-related functions, in contrast to local authorities’ responsibility for delivering core public services such as social care. The latter reflects the fact that many of the responsibilities of strategic authorities have only relatively recently been devolved to them, so the government has devolved associated funding in the form of grants, rather than devolving or assigning tax revenues.
Box 9.1. The business rates retention scheme (BRRS)
Since April 2013, business rates revenues have been partially assigned to local authorities and some strategic authorities under the business rates retention scheme (BRRS), in lieu of the grant funding they previously received. However, as we illustrate in Section 9.4, business rates revenues vary substantially between local authority areas. Assigning the same share of overall business rates revenues to local and strategic authorities in every part of England would therefore have led to some areas gaining substantial funding and others losing substantial funding compared with the previous grant funding. To address this, the BRRS incorporates a system to redistribute business rates revenues across the country, as follows:
- First, at the point the BRRS was introduced, authorities covering each part of England were initially allocated 50% of business rates revenues in their areas.a This was their business rates baseline (BRB).
- Second, the amount of grant funding to be forgone and hence the business rates revenue ‘need’ of each authority was calculated. This was their baseline funding level (BFL).
- Third, the difference between each authority’s BRB and BFL was calculated. An authority whose BRB exceeded its BFL (i.e. with high revenues relative to assessed revenue needs) was required to pay a tariff equal to the difference between the BRB and BFL. In turn, these tariffs paid for revenue top-ups for authorities whose BRB was less than their BFL (i.e. with low revenues relative to assessed revenue needs).
- Then, in subsequent years, the tariffs and top-ups were indexed in line with CPI inflation, maintaining their value relative to business rates bills (which, by default, are also increased in line with CPI inflation each year).
This set-up means that local and strategic authorities in each area ultimately retain a different proportion of the overall stock of business rates raised in their area: those areas where authorities pay tariffs receive less than 50% of the overall business rates revenues raised in their areas, once tariffs are subtracted; while those areas where authorities receive top-ups ultimately receive the equivalent of over 50% (and possibly over 100%) of the overall business rates revenues raised in their area, once top-ups are added on. But the fact that tariffs and top-ups are indexed in line with inflation means that most parts of England bear up to 50% of the real-terms change in local business rates revenues.
It is ‘up to’ 50%, because of two further features of the BRRS designed to limit both downwards and upwards divergences in local authorities’ retained revenues:
- a safety net, which tops up revenues if retained revenues fall below a certain point;
- a levy, which tapers retained growth in areas subject to tariffs from 50% down to a minimum of 25%, depending on how much their BRB exceeds their BFL.
The aim of this system is to provide incentives for local authorities to support the development of commercial and other non-domestic property, while maintaining (in real terms) the redistribution of the initial stock of business rates revenues across the country. We further discuss the rationale for assigning business rates in this way in Section 9.4, and redistribution systems in Sections 9.5 to 9.7.
It is worth noting that local and strategic authorities in some parts of England now operate enhanced business rates retention, with up to 100% of business rates revenues assigned locally, in return for forgoing further grant funding. These include the areas covered by the Greater London, Greater Manchester, Liverpool City Region, West of England and West Midlands strategic authorities.
a In areas with multiple tiers of local government, district councils were allocated 40%, county councils 9% and fire authorities 1%. This 50% assignment (and 40/9/1 split) remains the standard BRRS.
How do revenues compare with those of subnational governments elsewhere?
England’s local authorities and especially its strategic authorities have access to fewer devolved and assigned revenue streams than subnational governments in most other high-income countries, and rely more on grant funding.
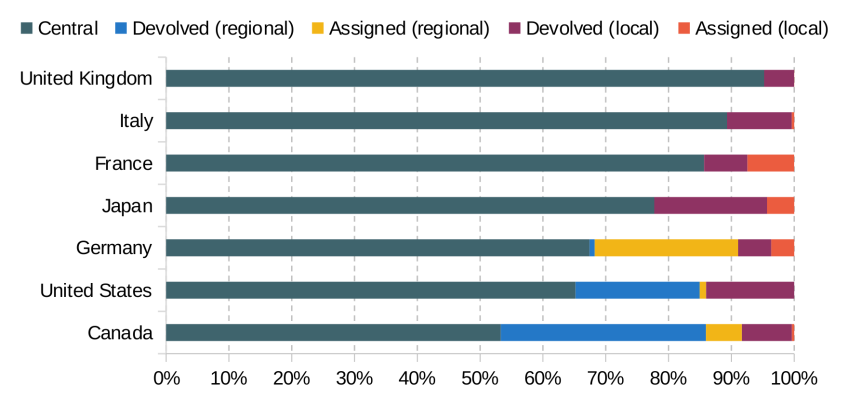
When confirming its revenue assignment plans, the UK government highlighted the low share of overall government revenues retained at a subnational level in England (Cabinet Office, 2026). Figure 9.5 illustrates this using OECD estimates of the share of overall tax revenues that are devolved or assigned to subnational governments in the UK and other G7 countries as of 2023.11
Figure 9.5. Share of overall tax revenues that are devolved or assigned to subnational governments, 2023
Note: For the UK, the Scottish, Welsh and Northern Irish governments are defined as central government and English strategic authorities as part of local government. More generally, with the exception of Colombia and Spain (not included in this figure), in non-federal countries, the OECD classifies regional governments either as part of central government or as part of local government, rather than as a separate regional tier.
Source: OECD, 2025.
Measured on a consistent basis across countries, the OECD classifies just 5% of all government revenues as devolved or assigned to subnational government in the UK – less than half the level of the next-lowest country, Italy (11%). OECD statistics exclude business rates retained under the BRRS from these figures, but even accounting for these revenues, the total assigned or devolved would be less than 7%.12 And the share of overall tax revenues assigned (less than 2% even accounting for retained business rates) is lower than in Japan (4%), Canada (6%), France (7%) and Germany (26%). OECD statistics also show much higher shares of revenues are devolved or assigned to local and/or regional governments in much smaller countries than the UK, including Belgium (15%), Denmark (27%), Sweden (36%) and Switzerland (41%).
To some extent, these differences will reflect differences in the extent to which spending responsibilities are devolved to subnational government. However, OECD statistics suggest that local and regional governments in the UK rely much more on grant funding and less on devolved or assigned tax revenues than most other high-income countries, even relative to their spending: based on these statistics, Selby and Breach (2026) estimate that grant funding from central government accounted for 62% of local and regional government spending in the UK, compared with between 20% and 30% in France, Germany, the US and Canada, 45% in Japan and 56% in Italy.
England’s subnational tax powers are currently restricted to recurrent property taxes (council tax and, to some extent, business rates). However, as illustrated in Table 9.3, subnational governments in other countries often have devolved powers over or assigned revenues from a much wider range of taxes. This includes income tax, where there are several examples of both locally and regionally assigned and devolved taxes.
Table 9.3. Examples of subnational taxation in other countries
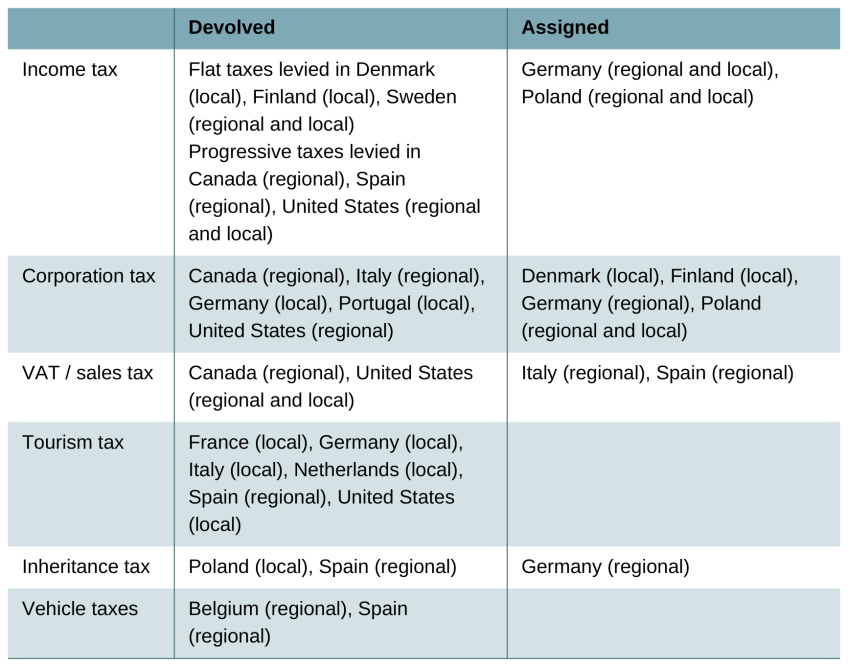
Note: This table provides examples of where different taxes are devolved or assigned to subnational government but it is not exhaustive in its coverage. Not all US states charge income tax, and not all of those that do charge it progressively. Taxes are defined as assigned only where the assigned revenues are based, at least in part, on estimates of revenues raised in particular local or regional authority areas. This excludes examples where subnational governments receive a share of national revenues based on a needs (rather than revenue-based) formula.
Source: European Commission, 2012; Nicol, 2014; Convention of Scottish Local Authorities, 2018; PWC, 2019.
9.3 The case for tax revenue assignment
The rationales for and potential risks of revenue assignment
The fact that other countries make greater use of revenue assignment does not in itself provide a rationale for assigning tax revenues to English mayoral strategic authorities. However, the academic and policy literature has identified several potential rationales for and risks of tax revenue assignment (Martínez-Vázquez, 2008; Boadway and Shah, 2009; Boadway and Eyraud, 2018).
A first rationale is that, by linking funding more closely to the performance of local tax revenues, revenue assignment could provide MSAs – and their residents – with stronger financial incentives to facilitate local economic growth, and hence growth in tax revenues. This will require MSAs to gain or lose at the margin from changes in revenues raised locally, rather than just being assigned a fixed share of national revenues, which would be much less responsive to local economic performance. Stronger financial incentives for MSAs would, of course, mean somewhat weaker financial incentives for central government to grow tax bases – if MSAs in future bear part of the marginal change in revenues, central government will conversely bear less.13 But as it stands, while some of the costs and policy levers to help deliver growth are the responsibility of MSAs, marginal changes in revenues and hence financial incentives lie almost entirely with central government. Revenue assignment could address this imbalance, better aligning costs, powers and incentives.
Second, if MSAs’ revenues increase if their policies and/or investments boost growth, this could help finance mayoral investments. In particular, mayors could borrow against the expected future growth in revenues as a result of an investment to help pay for its up-front cost and then use the resulting revenues to repay the borrowing: so-called tax-increment financing. This is most feasible for investments where the impact on subsequent revenues is forecastable with a high degree of accuracy.
Third, as discussed above, MSAs currently rely overwhelmingly on grant funding, with the amount they can expect to receive mostly confirmed for just a few years in advance at best. Thus, while tax revenues are subject to uncertainty and volatility, assigning them to MSAs – if this is itself credibly permanent – may provide greater long-term clarity about funding availability, enabling longer-term spending and investment decisions even if revenues do not perform particularly strongly. Note that assigning a fixed share of national revenues, rather than a share of local revenues, would likely provide greater long-term clarity over funding: national revenues are subject to less uncertainty and volatility than local revenues. This illustrates how the appropriate design of a revenue assignment systems depends on one’s view of the relative importance of the different ways in which it could facilitate growth-enhancing policies and investment.
Revenue assignment also brings risks both for individual MSAs and for the country more generally.
First, while efforts by MSAs to grow tax bases – including by competing for activity with other parts of the country – will often be beneficial for the country as a whole, that may not always be the case. If they compete for the same types of activity (particularly large-scale, mobile investments), MSAs may overinvest in certain types of infrastructure or skills, or bid up subsidies and other support to investors, relative to a nationally coordinated system (Slattery and Zidar, 2020).
Second, as we show in Section 9.4, there are large differences in the amounts raised per person from most taxes – including income tax and business rates – between different parts of the country. These may be very different from the government’s assessments of local spending needs. Simply assigning the same share of revenues to each MSA would therefore risk exacerbating regional inequalities by increasing funding for already-affluent areas relative to disadvantaged areas.
Third, in addition to potentially being influenceable by MSAs’ policy and investments, tax bases and hence assigned revenues will be affected by many factors outside of strategic authorities’ control – including national and international economic cycles and trends, and policy decisions by the UK and other governments. As well as providing incentives, revenue assignment also transfers potentially significant financial risk to MSAs. Relatedly, tax bases can be subject to both short-term volatility and long-term divergences – both of which are subject to significant uncertainty.
Fourth, the spending needs of MSAs are also likely to change over time, and these changes may differ from the changes in their assigned revenues. There may be negative correlation between some types of spending needs and assigned revenues – for example, for services that are used predominantly by unemployed or low-income people, such as employment support programmes. And as discussed above, over half of the integrated settlements – the grants which seem most likely to be replaced with assigned revenues – are for capital spending, the need for which may vary more significantly over time than the need for resource spending. In part this is because capital spending is lumpy – once a tram system has been built, for example, the ongoing capital spending to maintain it is much lower. But it also reflects the fact that capital spending needs are often driven by changes in local circumstances – such as changes in demographics and economic structure – rather than existing local circumstances. If MSAs’ existing integrated settlements partly reflect temporary variations in their capital spending needs, anchoring long-term assigned revenues on them may lead to future mismatches between funding and spending needs even if each MSA’s assigned revenues were to grow at similar rates.
Fifth, and related to this, as well as mismatches between funding and spending needs across MSAs, revenue assignment could lead to mismatches between funding and spending needs for specific services and types of investments. This is because it bears some relationship to tax hypothecation: assigning a portion of national tax revenues to MSAs means those revenues have to be spent on the function of those MSAs rather than on other functions. This would be of most concern if MSAs had very narrow responsibilities – such as the transport and police authorities some have subsumed. As discussed in Section 9.2, MSAs can spend money on a wide range of economy- and well-being-related functions, and can provide grants to local authorities – which in turn have a wide set of responsibilities for local services – reducing this risk in practice. Government should still be mindful of this when deciding how much revenue to assign to MSAs overall.
As already mentioned, and will be discussed in Sections 9.5 and 9.6, the precise revenues that are assigned and systems of equalisation and insurance can help address revenue inequalities and risks, as well as changes in spending needs – albeit by reducing the potential rewards from good revenue performance, and hence the incentivisation effects of revenue assignment. The balance between incentivisation on the one hand, and redistribution and insurance on the other, is therefore one of the key trade-offs in the design of a revenue assignment system.
How do these rationales and risks compare with tax devolution?
It is important to note that the rationales and risks for assignment differ somewhat from those associated with tax devolution – where MSAs would have powers to directly vary the tax rates or bases of certain taxes, like they already do to some extent with council tax and business rates.
The most obvious difference is that unlike tax devolution, revenue assignment will not enable MSAs to directly increase or decrease their funding, or change the taxes paid by their resident households or businesses.14 Thus, given that the government intends that revenue assignment will be revenue-neutral at the outset (with assigned revenues replacing equivalent grant funding), it does not provide a new, immediate source of funding for mayoral spending. The lack of revenue-varying powers also removes one of the self-insurance mechanisms that tax devolution includes for areas facing significant revenue shortfalls (or indeed increases): the ability to offset this through higher (lower) tax rates.
The lack of revenue-varying powers has two further important implications:
- First, it poses fewer concerns about potentially damaging competition between areas. In particular, MSAs will not be able to reduce tax rates on all or a subset of income tax payers to compete for the underlying tax base. It also avoids the less commonly appreciated upwards pressure to tax rates that can also accompany tax devolution.15
- Second, the administration and compliance costs associated with revenue assignment can be lower than for tax devolution. Devolution would require identifying the exact taxpayers and tax base for each MSA so that any local changes in tax policy can be applied to the correct taxpayers and their liabilities calculated accurately. However, while such accuracy is preferable for revenue assignment too, assignment could be implemented just using proxies for the underlying tax base (including sample-based estimates), provided the proxies are sufficiently strongly linked to the types of activities revenue assignment is designed to encourage (e.g. policies and investments that are conducive to growth).
Thus, while revenue assignment will not provide MSAs with the direct revenue-varying lever that tax devolution would, it also poses fewer issues for tax policy and administration. And, as discussed above, like tax devolution, it can still provide stronger incentives for tax base growth and longer-term clarity over funding than a series of short-term grants. It is therefore a meaningful reform to funding arrangements for MSAs, and a legitimate choice for a government balancing the different opportunities and risks associated with different degrees of fiscal devolution.
What is the evidence on the effects of revenue assignment on economic performance and other outcomes?
Empirical evidence on the effects of revenue assignment is limited, in part because it is difficult to isolate its effects from those of wider fiscal devolution and differences in local institutions. The available evidence is suggestive of positive impacts on economic growth, but is far from definitive.
The most direct evidence on revenue assignment comes from China, where research finds that greater retention of increases in tax revenues is associated with more infrastructure investment and faster economic growth (Jin, Qian and Weingast, 2005; Han and Kung, 2015; Chen, Lyu and Ma, 2024). Evidence from Europe points in a similar direction. Studies of reforms in Germany find that allowing municipalities to retain more of the revenues generated by increases in their tax bases leads them to allocate more spending to infrastructure and other growth-related activities (Hauptmeier, 2007 and 2009; Egger, Köthenbürger and Smart, 2010).
The broader literature on fiscal devolution also provides some suggestive evidence of positive economic effects. But results vary substantially across studies and countries, making causal interpretation difficult. Importantly, impacts appear to depend on institutional capacity and governance quality (Rodríguez-Pose and Ezcurra, 2010; Dougherty and Akgun, 2018; Jong et al., 2021). The main lesson for England is therefore that revenue assignment may support growth, but its effects are uncertain and likely to depend heavily on system design and the capacity of the MSAs receiving it. This includes having sufficiently well-resourced finance and strategy teams, as well as suitable arrangements for political decision-making and scrutiny, to ensure risks and opportunities are identified and responded to.
9.4 Are business rates and income tax suitable for assignment?
What we know about the government’s plans
As discussed in Section 9.1, the government’s plan to assign a share of tax revenues to MSAs was first announced in a speech by then Chancellor Rachel Reeves in March. Reeves said that the plans would see ‘the proceeds of growth benefiting the places that generated that growth’, but would require ‘managing volatile receipts’ and would be ‘fiscally neutral’ (HM Treasury, 2026a). They would be developed in conjunction with stakeholders, and set out in detail in a fiscal devolution ‘roadmap’ alongside this autumn’s Budget.
The principles for reform were fleshed out in the Starmer administration’s Northern Growth Strategy published several days later (HM Treasury, 2026b). These principles were:
- Empowerment. Mayors should benefit from the proceeds of growth, and have both the certainty and flexibility over funding to undertake long-term investments.
- Accountability. Transparent outcomes and a robust assurance process would need to be agreed, so that mayors could be held to account for results.
- Sustainability. Reforms would need to balance rewards for growth with protections for both risks of volatility and poor revenue performance. Reforms would also be designed in a way so as to avoid adding pressure to national public finance challenges.
- Fairness. Confirming that this was a plan for revenue assignment rather than higher or new taxes, and that a system of equalisation would be built in, if necessary, to redistribute from high-revenue to low-revenue areas.
These principles reflect several of the rationales and risks of tax assignment that were discussed above. For example, the ‘empowerment’ principle relates to both the financial incentivisation (‘proceeds of growth’) and certainty of funding rationales. And the ‘fairness’ and ‘sustainability’ principles relate to managing risks associated with differences in revenues between MSAs, and year-to-year volatility in revenues. So far, the government has not indicated how it will make the necessary trade-offs between its principles (and so between incentivisation, equalisation and insurance) when designing its revenue assignment system.
The Burnham administration confirmed it would go ahead with revenue assignment on 31 July 2026 (Prime Minister’s Office, 2026). In doing so, it also confirmed the taxes that would be assigned to MSAs. Starting in April 2027, MSAs as well as local authorities will receive a bigger share of the business rates revenues raised in their areas as part of the business rates retention scheme. Then, from April 2028, MSAs will start receiving a share of the income tax revenues raised in their areas. Again, the government emphasised that the plans were aimed at rewarding growth and enabling investment:
‘This means when places create jobs and grow their economies, they will now keep more of the rewards – giving local leaders new powers to invest in what matters most locally.’
Prime Minister’s Office, 2026
Turning this high-level plan into implementable policy will require not only trade-offs between the government’s different principles, but also answers to a number of specific policy design questions, which we discuss in Sections 9.5 and 9.6. First though, are business rates and income tax suitable taxes for revenue assignment, in principle?
How should we assess whether particular taxes are suitable for assignment?
To answer whether business rates and income tax are suitable for revenue assignment, it is first worth highlighting a set of criteria that can be used to assess the suitability of a tax for assignment. Based in part on the rationales for and risks of tax revenue assignment in general, these are:
- Incentivisation and influenceability. The size of the assigned tax base should be positively linked to stronger economic performance and/or other desirable outcomes that revenue assignment is aimed at providing financial incentives for. In addition, MSAs should be able to influence the size of the tax base in ways that improve targeted outcomes – otherwise assignment is just a source of financial risk rather than actionable incentives. The time it takes for mayoral decisions to influence tax bases is also relevant, as political considerations mean that impacts on tax bases that take many years to develop may have less influence on MSA behaviour than impacts that are felt during an electoral cycle.
- Risk, volatility and uncertainty. Tax bases that are subject to significant changes that are outside of the control of MSAs – due, for example, to economic cycles or structural economic changes – mean assignment entails greater financial risk. This is particularly true if the impact of such factors is uncertain and highly volatile from year to year, which could make it harder for MSAs to plan their spending and investment, and require the holding of bigger reserves to ensure financial resilience.
- Inequality and divergence. Assigning tax bases that are highly unequally distributed would, all else equal, lead to lower funding for economically disadvantaged areas than for successful areas, potentially exacerbating (rather than reducing) geographical economic inequalities. As discussed in Section 9.5, while initial differences in the size of tax bases can be equalised without affecting incentives to grow tax bases subsequently, further divergence cannot be fully offset without destroying these financial incentives. Given that the potential for future divergence is likely greater when tax bases already significantly differ between places, this means that tax bases that are highly unequal and/or expected to diverge over time are generally less suitable for assignment.
- Buoyancy. Given that the aim is for the assigned revenue to be a long-term replacement for grant funding, if possible the revenues should keep pace with changes in the spending needs of MSAs over time. Taxes where revenues automatically grow as prices and economic activity increase – so-called ‘buoyant’ taxes – are more likely to satisfy this than taxes where tax rates need to be frequently manually adjusted to keep pace with inflation and economic growth. However, certain spending needs – such as those related to deprivation and unemployment – may be expected to increase when the local economy shrinks, so buoyancy is no guarantee that revenues will keep pace with spending needs.
- Administrative feasibility. While revenue assignment does not necessarily require identifying the specific taxpayers and tax liabilities for each MSA (it would be possible to use proxies instead), different taxes still entail different administration costs and issues. In particular, if taxes are already collected locally, or taxpayers can be assigned to a specific geographic location, it is generally easier to administer an assignment scheme than for taxes collected nationally from taxpayers operating across multiple geographic areas.
Concerns about political accountability where a tax is paid by non-residents (and non-voters) are less acute for assigned taxes, given the lack of tax-varying powers, than for devolved taxes. However, voters are likely to be more concerned to ensure the revenue generated by assigned taxes is used effectively where these taxes have been paid predominantly by local voters.
There are both synergies and trade-offs between these criteria. For example, a tax that is buoyant is also more likely to provide financial incentives to support growth than a tax that needs to be manually increased to keep pace with increases in prices and economic activity over time. However, such a tax is also likely to be subject to greater uncertainty, volatility and divergence over time as economic performance varies for reasons outside MSAs’ control.
Which criteria to prioritise should depend on the main channel through which the UK government expects assignment to change MSA behaviour and improve outcomes. If it is through financial incentivisation, then greater weight should be placed on the incentives created by assigning different taxes. On the other hand, if it is through the provision of a longer-term funding stream than existing grants, then greater emphasis should be placed on the risk, uncertainty and volatility associated with different taxes – as risky, uncertain, volatile revenue streams are less likely to support long-term decision-making. The government should also consider its longer-term plan for devolution: if revenue assignment is a stepping stone to fiscal devolution, it should also consider suitability for devolution when choosing the taxes to initially assign.16
How suitable are business rates for assignment?
Business rates score highly on two of these criteria:
- Administrative feasibility. Business rates are collected by local authorities (and so can easily be summed at the MSA level) and, as discussed earlier, some MSAs already receive a share of business rates under the BRRS. Administratively, it should therefore be straightforward to assign a (bigger) share to all rather than some MSAs. One issue that will need to be addressed is what to do in areas where the combination of local authorities, fire authorities and MSAs already retains 100% of business rates revenues (see the last two columns of Table 9.4 later). Increasing the share of business rates revenues assigned to MSAs in these areas would require reductions in the share assigned to local authorities. Local authorities could be compensated for the initial impact of this change through higher grant funding, paid for by the reductions in MSAs’ grant funding when they start receiving a higher share of business rates instead. But local authorities would no longer benefit from (or lose from) any subsequent real-terms changes in that reassigned share of business rates – which would instead flow to MSAs.
- Incentivisation and influenceability. The business rates tax base – the value of non-domestic property in an area – is both linked to economic activity and potentially influenceable by MSAs through their powers over strategic planning, economic development and transport. For example, new or improved commercial or industrial space could support economic growth, and be facilitated by mayoral investments in land remediation and transport – and by wider efforts to make an area attractive for business and investment, including adult skills and business support programmes. Currently, authorities receiving a share of business rates revenues under the BRRS gain (and lose) as a result of changes in the quantity of non-domestic property – for example, through construction, renovation and demolition – but not changes in the estimated value of properties when they are revalued every three years.17 In its current guise, therefore, the BRRS incentivises local and strategic authorities to support the development and physical improvement of non-domestic properties rather than activities to increase the value of existing properties.
On the other criteria, business rates revenues are not particularly buoyant: tax rates (the ‘multiplier’) need to be manually increased and legislation caps increases at the rate of inflation. This is true even when properties are revalued every three years: individual properties see their bill increase or decrease in real terms if their rateable values increased or fell relative to the average since the previous revaluation, but the tax rate is adjusted so that the change in the average business rates bill is still linked to inflation. And political pressure has led the government to increase the tax rates by less than inflation in several recent years.
Business rates revenues are also highly unequally distributed around the country. This is illustrated in the first two columns of Table 9.4, which shows forecast business rates revenues in 2026–27 for the different English MSAs.18 It shows that forecast revenues per person in Greater London (£1,214) are just over three times higher than in the North East MSA (£400), reflecting both the concentration of commercial office space, and higher property values and rents in the capital. Outside London, revenues per person are around 1.5 times higher in Cambridgeshire & Peterborough (£669) than in most of the Northern and Midlands MSAs. Allowing all MSAs to retain the same share of business rates revenues would, all else equal, therefore lead to significant differences in their funding. But as we discussed in Box 9.1 in Section 9.2, the current BRRS includes a system of ‘tariffs’ and ‘top-ups’ to redistribute revenues across England based on assessments of local and strategic authorities’ spending needs and initial revenues when the BRRS was first set up. It would be natural to extend this to any additional assigned business rates for MSAs, although assessing their spending needs may not be straightforward.
Table 9.4. Forecast business rates revenues per person by mayoral strategic authority, 2026–27
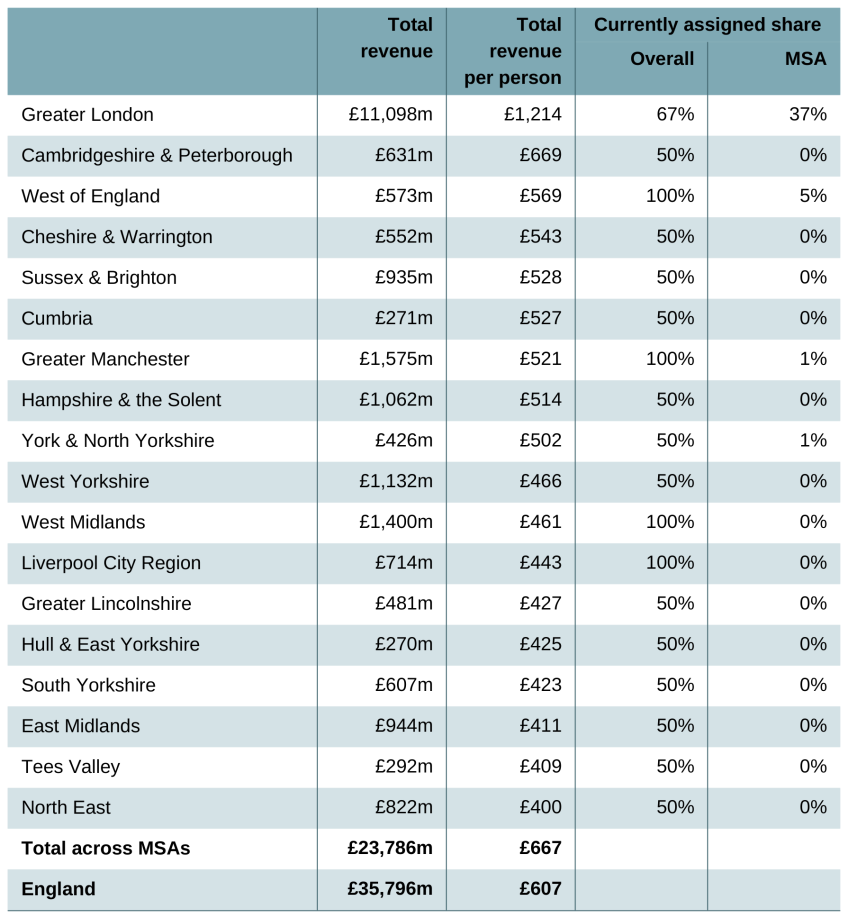
Note: Total forecast non-domestic rating income collected in 2026–27 by billing authorities in areas covered by mayoral strategic authorities (E-MSAs and MSAs) as of July 2026. The foundation strategic authorities (Devon & Torbay and Lancashire) are excluded.
Source: Authors’ calculations using Office for National Statistics (2024 and 2025) and Ministry of Housing, Communities and Local Government (2026d).
Business rates revenues are also potentially risky and volatile at a local level due to reliance on a relatively small number of high-value properties for a large share of overall revenues. For example, a third of overall estimated rateable value of non-domestic property in England is accounted for by the 1% of properties with an estimated rateable value of more than £500,000. If several of the most valuable properties in an area – such as major shopping centres – were demolished, this could lead to a meaningful reduction in the revenues assigned to some MSAs. However, the BRRS’s ‘safety net’ system, also discussed in Box 9.1, caps declines in revenues, ameliorating this concern somewhat.
The design of the BRRS also protects local authorities from another risk: the risk that UK government business rates policy directly reduces their retained business rates revenues. In particular, the government compensates local authorities for revenue-reducing policies through so-called section 31 grants, where the amount of grant received equals estimates of the lost revenues. Again it would be natural to extend both the ‘safety net’ and compensatory section 31 grants to MSAs’ (higher) assigned share of business rates.
How suitable is income tax for assignment?
Assigning income tax also looks administratively feasible, and would provide a different (arguably complementary) set of financial incentives to MSAs from business rates assignment. Income tax is a more buoyant tax than business rates, but it is also subject to significant geographical inequalities, and risk and uncertainty over time.
- Administrative feasibility. As income tax is collected nationally, a system would need to be set up to calculate each MSA’s assigned revenues. This would be easiest if assignment was on the basis of taxpayers’ primary residence: this is how income tax is already partially devolved to Scotland and Wales, and extending this approach would be easier than trying to assign revenues on the basis of where people work. First, whereas income tax records generally include taxpayers’ primary residential address, they do not include the address of their place of work, only their employer (which might operate from multiple sites). Second, whereas everyone has a primary residence, not everyone has a fixed place of work – for example, self-employed tradespeople and non-workers such as pensioners. In fact, HMRC already estimates income tax revenues on a residence basis for each local authority based on a sample of tax records, which could be summed at MSA level. Sample-based estimates are subject to statistical margins of error, which could increase the volatility and uncertainty of assigned revenues, but may be easier to implement quickly than a system requiring the primary residence of all taxpayers to be identified and verified.
- Incentivisation and influenceability. The income tax base is also linked to economic performance. Residence-based income tax assignment would provide MSAs with a financial incentive to increase the taxable income of people with primary residences in their area. This could encourage a greater focus on policies, services and investments that might attract higher-income residents to live in an area, and that might improve the skills, employment and progression prospects of existing residents – including in jobs involving remote working or commuting to neighbouring areas. Residence-based income tax assignment could therefore provide a useful complement to greater business rates assignment which will provide financial incentives to support the construction and improvement of non-domestic property in an area.19 The link between MSAs’ behaviour and increases in residents’ incomes may be less direct than for property construction and redevelopment, but increases in incomes are more closely linked to improvements in local living standards – one of the key ‘end goals’ of economic growth.
However, as with business rates, income tax revenues per person are highly unequally distributed across MSAs, as shown in Table 9.5.
Table 9.5. Estimated income tax revenue per person by mayoral strategic authority, 2023–24 (2026–27 prices)
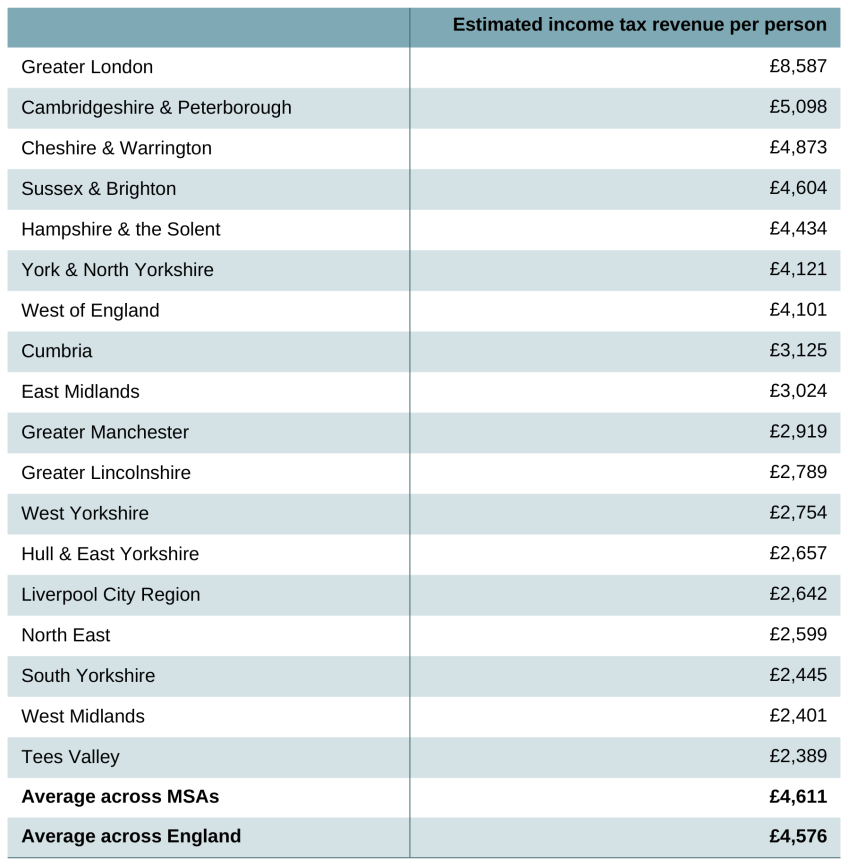
Note: The foundation strategic authorities (Devon & Torbay and Lancashire) are excluded.
Source: Authors’ calculations using Office for National Statistics (2025), HM Revenue and Customs (2026) and Office for Budget Responsibility (2026a).
The combination of higher income levels and the UK’s progressive income tax schedule, with higher rates of tax applied to higher incomes, means that in 2023–24 (the latest year for which estimates are available), estimated revenues per person were approximately 3.6 times higher in Greater London (£8,587) and over two times higher in Cambridgeshire & Peterborough (£5,098) than in the West Midlands (£2,401) and the Tees Valley (£2,389). As with business rates, assigning the same share of income tax revenues to all MSAs would, all else equal, lead to big differences in the funding they would receive.
Figure 9.6 shows that over the period between 2011–12 and 2023–24, there was also significant divergence in revenue growth between MSAs, with estimated revenues per person growing by an average of 2.5% per year in real terms in Greater London and 2.2% in Cambridgeshire & Peterborough, compared with 0.6% in the North East and the Tees Valley. Such annual differences rapidly accumulate: over the 12-year period analysed, estimated revenues per person increased by 35% in real terms in Greater London, compared with 7% in real terms in the Tees Valley.
Figure 9.6. Growth in real-terms income tax revenue per person by mayoral strategic authority, 2011–12 to 2023–24
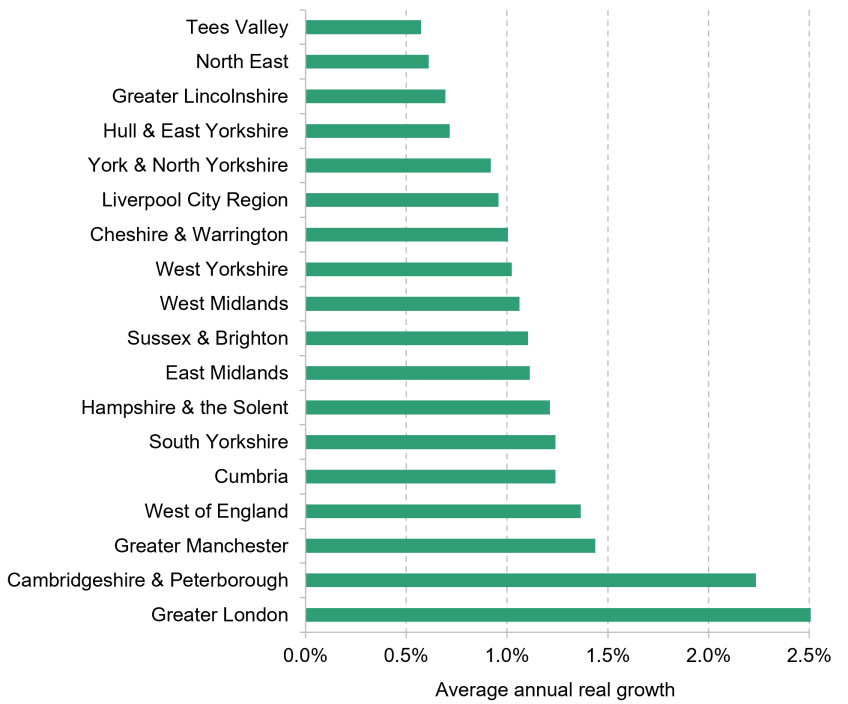
Source: Authors’ calculations using Office for National Statistics (2025), HM Revenue and Customs (2026) and Office for Budget Responsibility (2026a).
Part of these historical differences in revenue growth rates may reflect differences in the growth of underlying taxable incomes by MSA: for example, Greater London’s employment rate for all adults increased from around 1 percentage point above the all-England average in 2011–12 to around 5 percentage points above by 2023–24 (Office for National Statistics, 2026), although it is worth noting that average pay among those in employment grew less quickly in the capital. But likely more important is the effect of UK government income tax policy. In particular, the 2010s saw substantial above-inflation increases in the tax-free personal allowance – in today’s prices from around £11,300 in 2011–12 to around £16,400 by 2019–20 – but a real-terms reduction in the higher- and top-rate tax thresholds. These policy changes acted to reduce income tax revenues in areas where average taxable incomes are relatively low (such as Northern and Midlands MSAs) but increase them in areas where average taxable incomes are relatively high (such as Greater London and Cambridgeshire & Peterborough).
This is therefore a stark illustration that revenue assignment could potentially expose MSAs to significant risk and uncertainty related to central government tax policy changes – and that impacts for a given policy change could differ significantly between MSAs, potentially exacerbating inequalities in revenues.
More generally, income tax revenues are subject to uncertainty, risk and volatility – potentially exacerbated if assignment were on the basis of existing sample-based estimates of MSA-level revenues (which is subject to sampling variation). At a national level, during the 2010s, revenues in a given year were typically 2–5% different from forecasts made the prior autumn – although this increased to around10% in the early 2020s as a stronger-than-expected recovery from the COVID-19 pandemic and then inflation pushed up revenues more than expected.20 Sample-based estimates of MSA revenues also exhibit year-to-year volatility: the average absolute change in the year-on-year growth rates of estimated MSA revenues between 2011–12 and 2019–20 was around 4–9 percentage points. Following the COVID-19 pandemic, it was generally higher, ranging from 6 to 11 percentage points from 2020–21 to 2023–24.
As with business rates, an income tax revenue assignment system could partially mitigate both policy and wider revenue risks. For example, the UK government could directly compensate MSAs for the direct revenue effects of income tax policy changes that reduce (or increase) their revenues. A ‘safety net’ system could be used to protect MSAs from the biggest falls in assigned revenues. And, as we discuss in the next section, there are ways to assign income tax revenues that would reduce MSAs’ exposure to both policy and wider revenue risks in the first place.
9.5 The key decisions to be made on revenue assignment
The assignment of (more) business rates revenues and a share of income tax revenues is therefore administratively feasible and would provide complementary incentives to support economic development. But to turn a high-level idea into actionable policy, the government’s fiscal devolution roadmap will need to address several important questions – including in relation to the management of revenue inequalities, risks and volatility. The key issues to address include:
- how rapidly to roll out revenue assignment to different mayoral strategic authorities, and what to do in areas not governed by MSAs;
- the form of income tax revenue assignment to pursue;
- how much tax revenue to assign and which grants to replace;
- the design of equalisation arrangements and, in particular, how such arrangements are updated over time.
We discuss the first three in this section, before looking in depth at the last issue in Section 9.6.
Rolling out revenue assignment
One option would be to roll out revenue assignment to all MSAs at the same time, so that all start retaining (more) business rates in April 2027 and all start receiving a share of income tax revenues in April 2028. Alternatively, the government could begin revenue assignment to a subset of MSAs initially, before rolling it out more widely at a later date. Chancellor John Healey said last month that ‘every Mayoral Strategic Authority beginning in 2028’ will be assigned a share of income tax revenues (HM Treasury, 2026c). This could be read in a way that is consistent with either approach: with revenue assignment beginning for every mayor in 2028, or a process beginning in 2028 that will eventually reach every mayor. There are pros and cons of both approaches, which the government will need to weigh up.
There is a reasonable case to roll out revenue assignment to more established MSAs first. It may be easier to replace grant funding with an assigned share of business rates and income tax revenues for MSAs where a significant fraction of grant funding has already been rolled into the somewhat more flexible ‘integrated settlements’ than for MSAs still receiving funding via a range of ring-fenced specific grants. MSAs’ ability to manage the risks and take advantage of the opportunities brought by revenue assignment may also vary based on their institutional capacity and governance arrangements and, as discussed in Section 9.3, international evidence suggests such factors can be an important determinant of the effects of fiscal devolution. Relatedly, starting first with the more institutionally mature MSAs may enable and encourage improvements in the capacity and governance of other MSAs too.
However, if revenue assignment proves to be successful and leads to changes in MSAs’ behaviour and associated economic outcomes, a phased roll-out based on existing capacity could end up exacerbating inequalities in MSA capacity and local economic outcomes. In addition, while there may be scope for lesson-learning on the operation of the assignment system from a staggered roll-out (e.g. how large tax revenue forecast errors are, and the implications for budget management), the scope to learn much about the financial and economic effects of revenue assignment would likely be limited: significant funding divergences and economic effects are likely to take at least several years to develop, and it is unlikely a roll-out or ‘pilot’ phase would last this long. And having long-term differences in how strategic authorities are funded would run counter to the effort put into rationalising their spending powers and responsibilities in the English Devolution and Community Empowerment Act.
The government will also need to consider the implications of revenue assignment for areas of England that do not have mayors, including the foundation strategic authorities of Lancashire and Devon & Torbay, as well as the areas that currently have no form of strategic authority.
Starting first with FSAs, the government has justified devolving more spending and revenue powers to MSAs than to FSAs on the basis that directly elected mayors provide greater accountability to both local residents and central government than the boards of local authority representatives that lead FSAs – because mayors are accountable solely for MSA performance, whereas local authority representatives are primarily responsible for local authority performance. While this may justify differences in how much is devolved and how spending in areas without mayors is funded relative to MSAs, it does not in itself justify differences in how much is spent in such areas relative to MSAs (which revenue assignment may affect).
Around a third of the population of England live in areas that do not currently have any strategic authority – their new middle tier of government does not yet exist. This is still likely to be the case when the roll-out of revenue assignment for other areas begins: the government intends for all of England to be covered by strategic authorities only by the end of 2028, and does not have the power to compel areas to set up strategic authorities.
When considering the design of the revenue assignment and associated equalisation systems, the government should therefore consider effects not only on funding levels and risks for MSAs but also on spending in other parts of the country (which will continue to be undertaken directly by central government or funded via grants). And if, over time, evidence suggests that revenue assignment is associated with higher funding and/or better outcomes, the government should consider how to prevent areas without mayors from falling permanently behind – whether through mandating mayoralties, strengthening the accountability arrangements of FSAs, or assigning revenues directly to local authorities in areas without mayors. We discuss the possibility of extending income tax revenue assignment to local authorities – which exist in all parts of England – in Section 9.8.
The form of income tax assignment to pursue
The government will also need to decide which form of income tax revenue assignment to pursue. As discussed in Section 9.4, while in principle there is a choice between assignment on the basis of primary residence and assignment on the basis of place of work, the latter approach would be substantially more difficult to implement. We therefore assume in the rest of this chapter that the government will assign based on primary residence.
Instead, the more relevant choice is how to assign the revenues from each income tax rate.
The simplest option would be to assign MSAs a flat percentage (e.g. 10%) of revenues raised in their areas from all tax rates. Such an approach would mean that, like central government’s, MSAs’ revenues would be particularly dependent on the incomes of high-income taxpayers. This is because income tax is progressive, so higher-income taxpayers pay a greater proportion of their incomes than lower-income taxpayers. For example, 10% of all income tax revenues is equivalent to 2% of taxable income in the basic-rate tax band (10% of the 20% basic rate of tax) plus 4% of all income in the higher-rate tax band (10% of 40%) and 4.5% of income in the top-rate tax band (10% of 45%). An increase in income subject to the higher and top rates would therefore generate two or more times as much funding for the MSAs as an equivalent-sized increase in income subject to only the basic rate.
An alternative approach would be to allocate the revenues from a fixed number of percentage points of the tax rates for these different tax bands – for example, 3 percentage points for each tax band, or for just the basic-rate band as suggested by the think tank Re:State (Walker, Ganesharatnam and Kaye, 2026). The former would assign revenues equivalent to the same 3% of taxable income for income in each tax band, while the latter would assign revenues equivalent to 3% of taxable income in the basic-rate band and 0% for income in the other tax bands.
Which approach the government chooses will have several important implications. In particular, it will affect:
- The financial incentives MSAs have to support increases in the incomes of different taxpayers. This is because different approaches mean MSAs would benefit to different extents from growth in different taxpayers’ incomes.21
- Assigning a flat 10% of income tax revenues, for example, would provide stronger financial incentives for MSAs to boost incomes in the top-rate band than in the basic-rate band. Such an approach would make most sense if the government aims to incentivise MSAs to implement policies and investments that support growth in overall income tax revenue.
- Assigning 3 percentage points of the tax rate in each band would provide the same financial incentive to increase income in all tax bands. This approach would therefore make most sense if the government wishes to incentivise MSAs to boost overall local economic growth, and support growth in taxable incomes across the income distribution.
- Assigning 3 percentage points of the tax rate in just the basic-rate band would focus financial incentives on increasing incomes in that band.22 This would make sense if the government wants MSAs to focus specifically on increasing employment and the incomes of their low- to middle-income residents – for example, to reduce poverty and inequality.
- The scale of (pre-equalisation) revenue inequalities between MSAs. Geographical inequalities in incomes are concentrated towards the top of the income distribution (Agrawal and Phillips, 2020), and so geographical inequalities in income tax revenues are driven to a large extent by differences in revenues from the higher- and top-rate tax bands. This is illustrated in Table 9.6, which compares estimates of how much revenue per person each MSA would receive relative to the average if revenue assignment was based on (1) 10% of revenues, (2) 3 percentage points of each tax rate and (3) 3 percentage points of just the basic rate. The estimates are for the latest year of available data, 2023–24, prior to any equalisation that might subsequently be applied to address revenue inequalities. The (weighted) average across all MSAs is normalised to 100 for each option.
The table shows that whereas Greater London would have received 186% of the average revenue per person from 10% of all income tax revenues, it would have received an estimated 163% of the average from 3 percentage points for each tax band and an estimated 121% of the average from 3 percentage points for the basic-rate band. Conversely, the Tees Valley would have received 52% of the average revenue per person from 10% of all income tax revenues, but 60% from 3 percentage points for each tax band and 76% from 3 percentage points for the basic-rate band. By-band approaches – especially if focused on revenue from the basic rate of income tax – could therefore reduce the scale of inequality in pre-equalisation revenues between MSAs, thereby reducing the amount of equalisation that the government would subsequently want to undertake.
Table 9.6. Income tax revenue per person by mayoral strategic authority relative to the MSA average, 2023–24
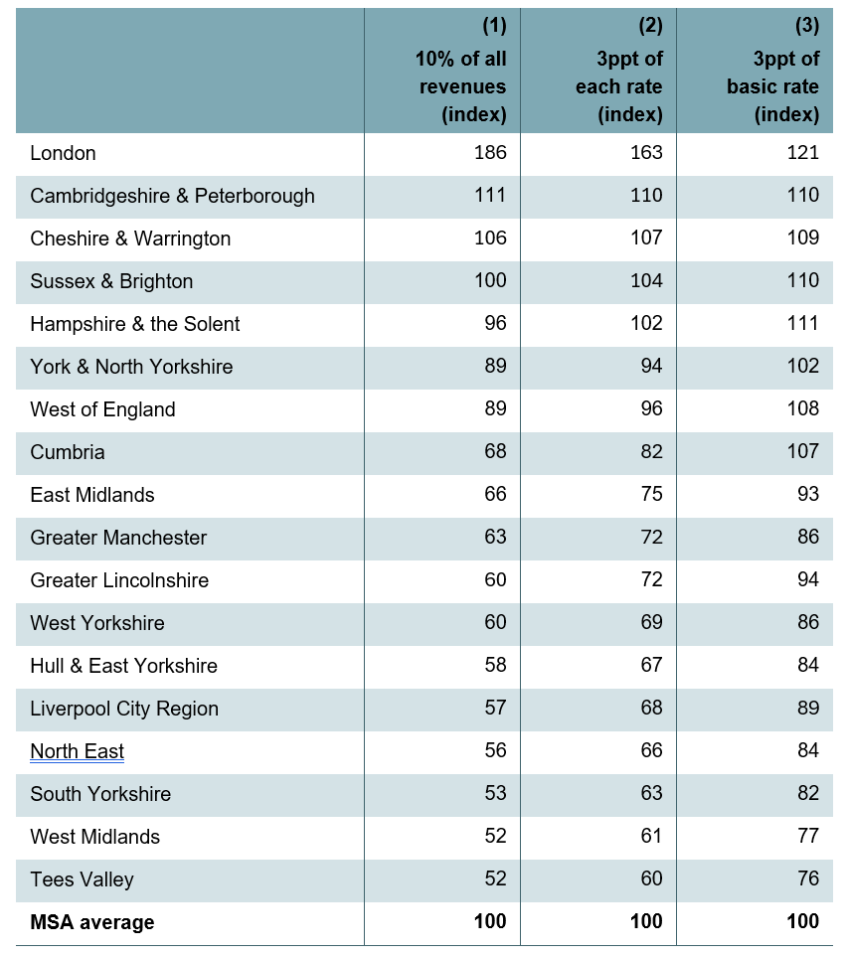
Note: Indexed to the MSA average income tax revenue per person, a population-weighted average across the 18 mayoral strategic authorities only, rather than to the average across all of England. Weighting uses ONS mid-year population estimates for 2023. See Appendix 9A for details of how estimates are constructed.
Source: Authors’ calculations using Office for National Statistics (2023 and 2025) and HM Revenue and Customs (2025 and 2026).
- Cyclical revenue risks and volatility faced by MSAs. It is incomes subject to the higher and top rates of tax that are typically most uncertain and volatile – due, for example, to variation in bonus payments and dividend receipts. In contrast, revenues from basic-rate taxpayers tend to be more predictable and stable from year to year. By reducing exposure to changes in incomes in the higher- and top-rate bands relative to a flat-percentage-of-revenue approach to assignment, by-band approaches can therefore reduce revenue risk and volatility for MSAs.
- How UK government income tax policy decisions affect MSAs’ revenues. Assigning a flat percentage of income tax revenues would mean that if the UK government changed income tax rates or thresholds, reducing or increasing overall income tax revenues, this would affect the revenues assigned to MSAs. While, as discussed in Section 9.4, in principle it would be possible for the UK government to compensate MSAs for such effects, calculating the amount of compensation due to (or from) MSAs would require HMRC to calculate tax payments under two systems: the actual one and the counterfactual ‘no reform’ system. This could become increasingly complicated as the actual and counterfactual systems diverge over time.
Assigning a fixed number of percentage points of all tax rates instead would mean that the revenues assigned to MSAs would not be directly affected by changes in either tax rates or the higher- or top-rate band thresholds – 3 percentage points of all tax rates would still be 3 percentage points of all tax rates, irrespective of whether overall tax rates had increased or decreased.23 A by-band approach to revenue assignment could therefore reduce the revenue uncertainty and risk associated with UK government decisions on tax rates and thresholds – although changes in the tax-free personal allowance would still affect assigned revenues.
- How easy it is to move from revenue assignment to true revenue devolution in future. While the current government’s plan is for income tax revenue assignment, future governments may want to partially devolve income tax to MSAs to enable them to directly increase or reduce their funding. The most straightforward way to do this would be to reduce the tax rates set by the UK government and allow MSAs to set rates on top of these, as is the case with Wales, where the UK government reduces each tax rate by 10 percentage points and the Welsh Government sets its tax rates on top. A by-band approach to revenue assignment would be a more natural stepping stone to this than a flat-percentage-of-revenue approach.
By-band approaches to income tax assignment would therefore reduce the revenue inequalities and risks that subsequent revenue equalisation and insurance systems would need to address. But in deciding which approach to revenue assignment to pursue – a flat percentage of revenues or a by-band approach – the government’s long-term vision for fiscal devolution and the precise incentives it wants to provide MSAs with are also important.
How much revenue to assign and which grants to replace
As well as deciding how to assign income tax revenues, the government will also need to decide how much revenue to assign, and which grants that assigned revenue should replace.
In making these decisions, it is important to distinguish between the stock of revenues assigned to MSAs and the amount of any subsequent change in revenues that MSAs bear once the assignment system is in place. These do not need to be the same. But first, we discuss the factors the government should account for when deciding which grants that assigned revenue should replace.
Which grants the assigned revenues should replace
As discussed in Section 9.2, MSAs receive a range of different grants, with different strings attached. Many are subject to strict ring fences, mandating their use for particular services. The integrated settlements received by seven of the E-MSAs provide some flexibility to move funding between broader ‘thematic pots’. And the investment funds provide flexible grant funding that MSAs are able to spend as they see fit, as long as it relates to one of their responsibilities.
Assigned tax revenues could replace any or all of this grant funding. But the suitability of these different types of grants for assignment differs. In principle, revenue assignment is most suitable as a replacement for grants that MSAs have significant flexibility over, rather than those subject to ring-fencing. This is for two interrelated reasons. First, replacing a single ring-fenced grant with assigned revenues would mean future spending on the service for which the grant is ring-fenced may need to rise and fall as assigned revenues rise and fall, irrespective of changes in needs for said service: a potentially problematic case of tax hypothecation. Second, replacing several ring-fenced grants together could help address this concern, provided that MSAs have some flexibility to allocate spending between services following assignment (e.g. to insulate a service seeing a particular increase in spending needs from a fall in assigned revenues). But presumably there is a reason why the government has strictly ring-fenced funding in the first place: it wants to guarantee certain funding it provides goes to particular services – such as policing, for example.
Replacing MSAs’ investment funds with assigned revenues would avoid such concerns. However, these are generally a very small proportion of overall grant funding, especially in E-MSAs (e.g. £30 million a year for Greater Manchester, equivalent to less than 0.3% of projected income tax revenues from this area in 2028–29)24 – and the Greater London Authority does not receive an investment fund grant at all. In addition, it is unclear whether MSAs would want to replace guaranteed 30-year investment funds with assigned revenues that are subject to at least some uncertainty; it is their other grant funding which some have argued is too short-term.
This suggests the ‘integrated settlements’ may be the most appropriate grants to form the core of the new revenue assignment system. They are substantially larger than the investment funds (e.g. a planned £732 million for Greater Manchester in 2028–29, equivalent to 6.8% of projected income tax revenues). They are currently only confirmed for a few years at a time, so MSAs may welcome greater long-term clarity via a revenue assignment system. And the government has already relaxed ring-fencing requirements, suggesting it is more comfortable with MSAs moving funding between the services the integrated settlements fund – easing concerns about the risks of revenue hypothecation.
As discussed in Section 9.2 though, the fact that a large proportion of the existing integrated settlements are capital funding – the need for which is particularly hard to assess and is potentially lumpy – may increase the likelihood of significant mismatches between spending needs and assigned revenues opening up over time, even if the amount of revenue initially assigned matched the integrated settlement for that year. The government should therefore consider either excluding from assignment the elements of the integrated settlements that are likely to be most lumpy (e.g. one-off funding for transport schemes the MSAs inherited from the Department for Transport) or undertaking an assessment of the average need for such capital spending over a long time horizon, matching initial assigned revenues to this level, and then allowing MSAs to borrow or save to reallocate this funding over time to fund lumpy investments.
As only some authorities receive ‘integrated settlement’ funding – seven currently, with a further four E-MSAs eligible to in future – restricting the new revenue assignment system to replacing this component of funding could also limit the set of authorities to which assignment could be rolled out, at least initially, unless the government can identify the equivalent ring-fenced grants received by other MSAs.
In addition, while the integrated settlements of the Northern and Midlands MSAs that receive them are of broadly similar scale (between a planned £233 and £259 per person in 2028–29), they are less than a quarter as large (£59 per person) for Greater London. As we see below, when combined with Greater London’s high income tax revenues per person, this poses some challenges for the design of a revenue assignment system.
How much of the stock of revenues to assign to MSAs
As already highlighted, the government’s plan is for revenue assignment to be revenue-neutral at the point of introduction. This means that at a national level, the stock of revenues initially assigned to MSAs must equal the amount of grant funding that they will forgo. This would ensure that revenue assignment does not cause an immediate worsening of the UK government’s difficult fiscal situation.
However, there is significant variation in both MSAs’ existing grant funding per person and their business rates and income tax revenues per person – particularly between Greater London and the Northern and Midlands MSAs. This is illustrated in Table 9.7, which compares the planned integrated settlements for 2028–29 for the seven E-MSAs that currently receive them with projected income tax revenues for the same year. It shows that the integrated settlements vary between 6.8% and 8.7% of projected income tax revenues (equivalent to the revenue from between 1.7 percentage points and 2.1 percentage points for all tax bands) for the Northern and Midlands MSAs, but just 0.6% (and 0.2 percentage points for all tax bands) for Greater London.
Table 9.7. Comparison of integrated settlements with projected income tax revenues, 2028–29 (2026–27 prices)
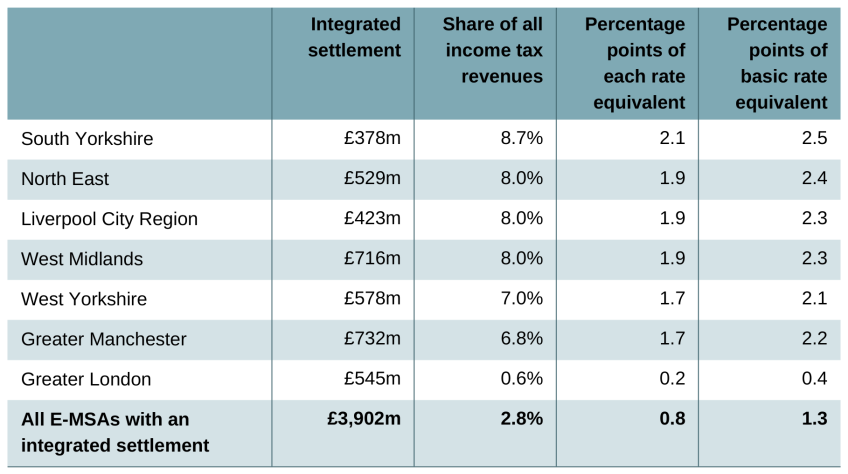
Note: See Appendix 9A for details of how estimates are constructed.
Source: Authors’ calculations using Office for National Statistics (2023 and 2025), Ministry of Housing, Communities and Local Government (2025b) and HM Revenue and Customs (2025 and 2026).
On its own, replacing the same set of existing grants – for example, the integrated settlements – with the same assigned portions of business rates and income tax revenues would therefore lead to some MSAs seeing an overall increase in funding and others an overall decrease, even if the shift from grant funding to revenue assignment was revenue-neutral for England as a whole. These windfall gains and losses could, reasonably, be seen as unfair.
To avoid this, three options would be possible.
First, the same share of revenues could be assigned to each MSA but the amount of grant funding that they would forgo could be varied to match the initial amount of revenues assigned to them – with MSAs with higher revenues forgoing more grants (or more of each grant). For example, assigned revenues could replace more grants in Greater London than in the Northern and Midlands MSAs.
Second, MSAs could forgo the same grants but the share of revenues assigned to each MSA could be calibrated to match the value of those grants – with MSAs with higher revenues having a lower share of those revenues assigned to them. For example, a lower share of tax revenues could be assigned in Greater London than in Greater Manchester than in South Yorkshire.
Both of these options come with drawbacks though. Varying the grants (or share of each grant) that are replaced and/or the share of revenues assigned to each MSA in this way would be complex. As discussed above, different grants are more or less suitable to be replaced by assigned revenues. Varying the rate of revenue assignment between MSAs would also vary the financial incentives and risks associated with marginal changes in revenues – those with higher (lower) assignment would bear a larger (smaller) fraction of the gains or losses associated with increases or decreases in the revenues from the taxes assigned to them. There may be a case for some variation across MSAs in this way – giving stronger financial incentives to those MSAs in traditionally poorer-performing regions, to give an extra boost to growth, and/or more incentives to those MSAs with the most spending responsibilities and powers, and so the greatest ability to influence the local economy. But it is unlikely to be the case that the optimal level of incentives and risk for each MSA to bear will be perfectly correlated with how its initial revenues and grant funding compare.
A third, and in our view better, option would be a formal system of equalisation to offset differences between assigned revenues and the grants due to be replaced. We discuss the options for the detailed design of such a system in Section 9.6. But one way such a system could work is as follows:
- Any MSAs for which the initial revenues that will be assigned are lower than the grants they will forgo would receive a transfer from central government to offset the difference.
- Any MSAs for which the initial revenues that will be assigned are higher than the grants they will forgo would pay a transfer to central government to offset the difference.
After accounting for these equalisation payments, the stock of revenues initially assigned would equal the grants being replaced not only nationally but also for each MSA. This would ensure that MSAs do not face immediate windfall gains or losses simply as a result of the introduction of the revenue assignment system, which would be consistent with the ‘no detriment’ principle that has guided tax devolution for both Scotland and Wales (Smith Commission, 2014).
Appendix 9B illustrates graphically how equalisation payments can be used to deliver revenue neutrality for individual MSAs and fiscal neutrality overall, whatever grants government chooses to replace with assigned revenues and whatever stock of those revenues it wants to assign initially.
How much of the change in revenues to assign to MSAs
By offsetting any differences between initial assigned revenues and the grant funding to be replaced, these equalisation payments would therefore allow the government to assign the same pre-equalisation portion of revenues and replace the same grants for each MSA – avoiding the need to vary assignment and grant decisions on a case-by-case basis to ensure ‘no detriment’.
Assigning the same pre-equalisation portion of local revenues to each MSA would mean that they would have the same financial incentives to grow local tax bases – because they would each bear the same portion of any subsequent change in revenues once the assignment system is in place – for example, the same X% of the increase in the resulting business rates revenues, or the extra revenues from the same Y percentage points for each income tax band. The choice of what portion of revenues (X and Y) should be assigned, prior to any equalisation, should depend on how the government, MSAs and other stakeholders trade off incentives to grow local tax bases, with the uncertainty, risk and volatility that greater exposure to changes in local tax bases entails:
- If incentives are highly prioritised, the government should assign a relatively high pre-equalisation share of local revenues, so that MSAs bear a relatively large share of any changes in local tax bases – even though this means more risk too. In this case, it is possible that all MSAs would receive more in the way of pre-equalisation revenues than the grants that will be replaced – meaning that all would pay equalisation transfers back to the government, albeit of different sizes.
- If, on the other hand, the government prioritises protection against tax revenue uncertainty, it should assign a relatively low pre-equalisation share of local revenues, so that MSAs bear a relatively small share of any changes in local tax bases – even though this means weaker incentives too. In this case, it is possible that all MSAs would receive less in the way of pre-equalisation revenues than the grants that will be replaced – meaning that all would receive equalisation transfers from the government, albeit again of different sizes.
As we have highlighted already, this incentives–insurance trade-off is inherent to any tax revenue assignment and equalisation system. But as we now discuss, certain design choices can ameliorate this trade-off somewhat – keeping equalisation transfers more ‘up to date’ and providing more insurance against certain types of revenue risks, without undermining the financial incentives MSAs would have to enact policies that help grow local tax bases.
9.6 The options for equalisation and insurance arrangements
In designing equalisation and insurance arrangements to accompany mayoral strategic authorities’ newly assigned revenues, the government can learn from two approaches already used as part of existing revenue assignment and devolution policies in the UK:
- the redistributive tariffs and top-ups that are used to equalise the business rates revenues already assigned to local and some strategic authorities as part of the business rates retention scheme, discussed in Box 9.1 in Section 9.2;
- the block grant adjustments (BGAs) used as part of the devolution of a range of tax revenues and powers, including income tax, to the Scottish and Welsh Governments.
The government also needs to decide how to update any initial equalisation payments over time. This includes any regular annual indexation of the payments, as well as any more general ‘resets’ of the system to account for changes in different MSAs’ pre-equalisation assigned revenues and spending needs. The government may also want to include mechanisms to insure MSAs against particularly large changes in their revenues. And it needs to consider what arrangements may be needed to help MSAs address uncertainty in revenues – including differences between forecasts for revenues when they set their budgets, and actual revenue collections. We discuss each of these options in turn.
Option 1. Tariffs and top-ups
‘Tariffs’ and ‘top-ups’ are the terms used in the BRRS for the equalisation payments to offset initial differences in authorities’ pre-equalisation (gross) assigned revenues and the grants those revenues are replacing. As discussed in Box 9.1, tariffs are payments from authorities whose initial business rates revenues exceeded the grant funding being replaced, while top-ups are payments to authorities whose initial business rates revenues were lower than the grant funding being replaced. Panel A of Figure 9.7 illustrates how this could work for authorities that were initially in each of these positions, equalising their post-equalisation (net) revenues; Panel B expresses this in the form of an equation.
Figure 9.7.
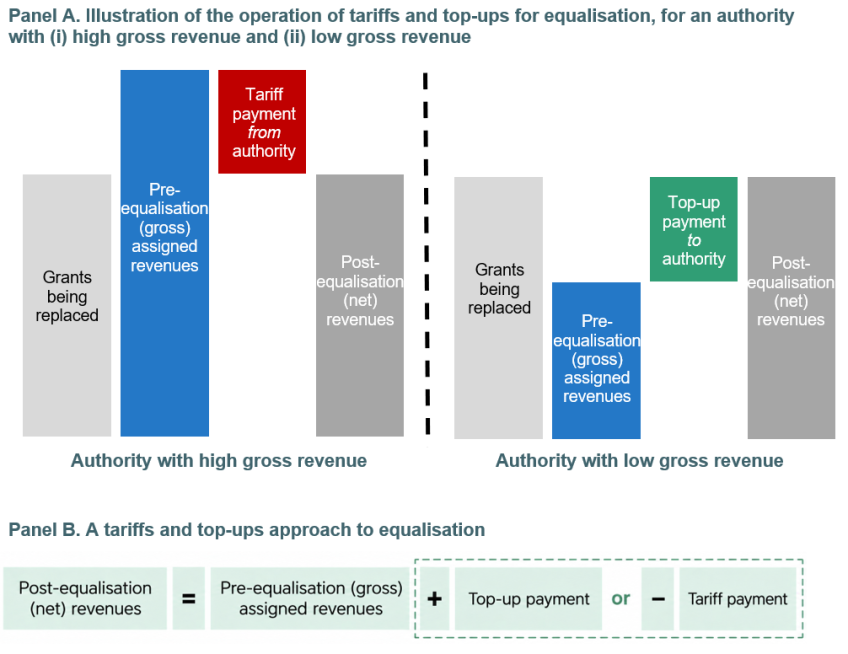
It would be natural to use the existing BRRS and its system of tariffs and top-ups to undertake equalisation for MSAs’ increased share of business rates revenues. It is a scheme that local authorities, strategic authorities and central government are used to, and its continued operation has already been confirmed as part of recent reforms to the local government finance system. Using a different system for authorities’ additional shares of business rates revenues from the one used for their existing shares would be complex administratively, and likely to make it harder for local policymakers to understand the incentives and risks they face.
A tariff and top-up system could be utilised to equalise assigned income tax revenues too. However, rather than simply replicate how they operate in the BRRS, the government should consider changing how initial tariffs and top-ups are indexed over time – a key factor in how redistributive they are in the years following the start of revenue assignment.
The choice of indexation approach
As set out in Box 9.1, under the BRRS, tariffs and top-ups are indexed in line with CPI inflation each year – specifically the rate of CPI inflation from the prior September, which is also used to index taxpayers’ business rates bills. Indexing tariffs and top-ups in this way means that the amount of redistribution they do is maintained in real (CPI-adjusted) terms. This reduces the risk of authorities heavily reliant on top-ups seeing real-terms reductions in their funding.
However, if overall revenues increase at a rate faster than inflation – as is the norm for income tax – the amount of redistribution undertaken by the inflation-linked tariffs and top-ups would fall relative to these faster-growing revenues. Over time, authorities receiving top-ups would see their overall (net) funding fall relative to authorities paying tariffs, even if their pre-equalisation (gross) revenues grew at the same rate – because a falling share of those gross revenues would be redistributed via the tariffs and top-ups.
This is illustrated in Panel A of Figure 9.8, which shows the evolution of post-equalisation (net) revenues (in grey) for two hypothetical MSAs that start with different levels of pre-equalisation (gross) revenues (in blue). Their underlying gross revenues are assumed to grow at the same 2% real-terms rate each year, while their tariffs and top-ups are indexed in line with inflation and so are fixed in real terms. The tariffs and top-ups are initially set to fully equalise for differences in these MSAs’ gross revenues (as in Figure 9.7 earlier). But over time, their net revenues diverge. This is because the inflation-linked tariff offsets less of the high-gross-revenue MSA’s growing revenues, while the inflation-linked top-up provides a proportionally smaller boost to the low-gross-revenue MSA over time.
Figure 9.8. Illustration of indexation systems for tariffs and top-ups
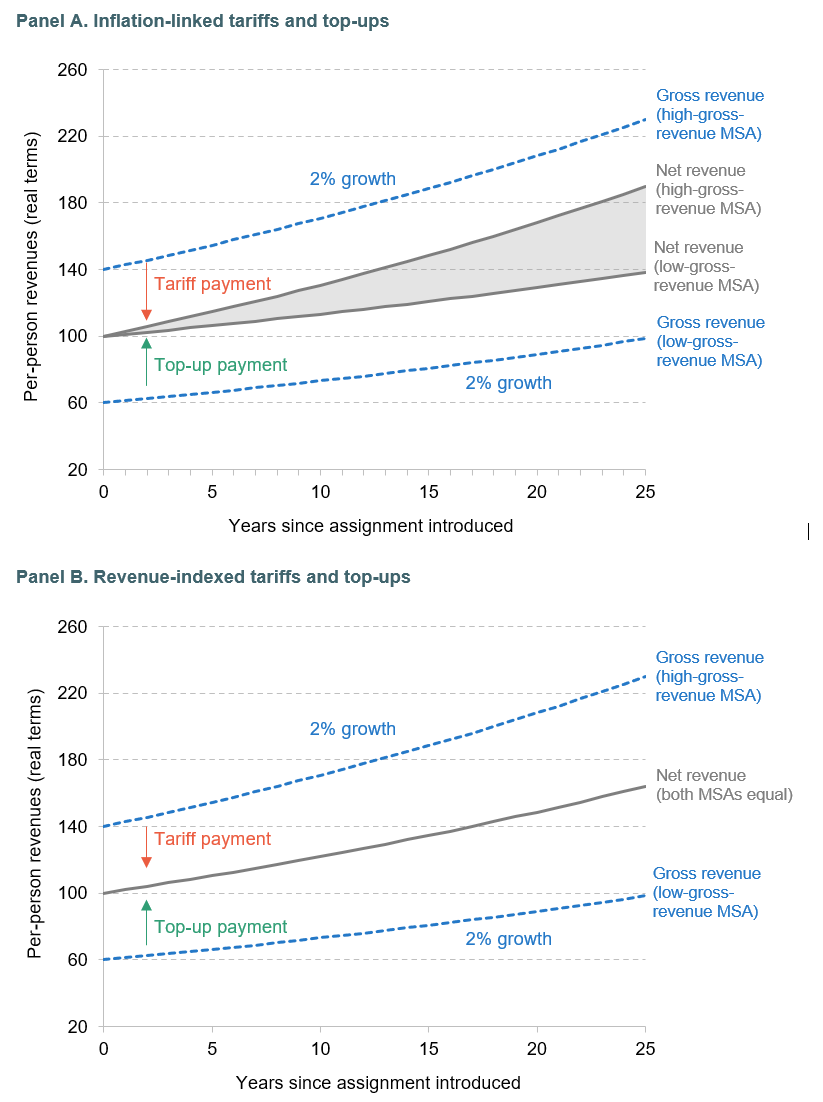
Note: This figure is based on two hypothetical MSAs that have different gross revenues, with initial tariffs and top-ups designed to fully equalise their net revenues at year 0. Gross revenues grow by 2% in real terms for each MSA and tariffs and top-ups are either fixed in real terms (Panel A) or increased in line with the average 2% real-terms growth in gross revenues (Panel B).
Such divergence in net revenues would take place even if all MSAs paid tariffs or all received top-ups. For example, with gross revenues growing at the same rate, the net revenues of MSAs with bigger tariffs would pull ahead of those with smaller tariffs – because bigger tariffs mean that how they are indexed has a bigger effect on growth in net revenues. The patterns would reverse if gross revenues were to fall in real terms: the inflation-linked tariffs and top-ups would increase relative to the falling gross revenues, such that the net revenues of high-gross-revenue MSAs would fall behind those of MSAs with low gross revenues.
However, the amount of redistribution could be maintained relative to revenues by indexing tariffs and top-ups in line with national growth in the assigned tax revenues rather than inflation. If revenues nationally were growing in real terms, this would ensure that the areas reliant on top-ups benefit more fully from the growth and that areas paying tariffs would not see their net revenues pull ahead (unless their gross revenues were growing more quickly than the national average). This is illustrated in Panel B of Figure 9.8.
Indexation based on national revenue growth would also still maintain MSAs’ financial incentives to grow their own assigned income tax revenues – because they would still gain or lose from marginal changes in their own revenues.25 Revenue-based indexation could therefore ameliorate (although not eliminate) the trade-off between incentivisation and equalisation, compared with inflation-based indexation.
Option 2. Block grant adjustments
Tariffs and top-ups, whether inflation- or revenue-linked, would provide relatively little insurance against one significant source of revenue uncertainty and volatility, particularly for income tax – the national economic cycle. And automatic falls and rises in MSA funding when the UK economy shrinks and booms and assigned tax revenues fall and rise could risk exacerbating the economic cycle. Insurance against this risk could be provided by another approach to equalisation: a system of revenue-indexed block grant adjustments (BGAs) as used alongside Scottish and Welsh tax devolution.26
This approach is illustrated in Figure 9.9. The first thing to note with a BGA-based system is that even after tax revenue assignment commences, the UK government would continue to calculate and allocate the underlying grant funding it wants to provide to MSAs. But this grant funding would be adjusted to account for the revenues assigned to each MSA. In particular, at the point the revenues are assigned, a BGA equal to the amount of gross revenue being assigned would be subtracted from the block grant. This means that at the point of introducing the assignment scheme, MSAs’ net revenues would exactly equal their block grant funding – thereby achieving both revenue neutrality at a national level and no detriment to any MSAs.
Figure 9.9. A block grant approach to equalisation

In subsequent years, the BGAs would be increased in line with national growth in the assigned tax revenues, maintaining their value relative to national revenues. This means that an MSA would neither gain nor lose from tax revenue assignment if its assigned (gross) revenues grew in line with the national average. But it would gain if its assigned revenues grew at a faster rate than the national average and would lose if its assigned revenues grew at a slower rate than the national average. This would maintain MSAs’ incentives to grow their own assigned revenues – as they would still benefit from the marginal growth in local revenue.27
Indexing BGAs in this way would also provide protection against revenue risks and volatility affecting the whole of the country – unlike the tariff and top-up system described above. To see this, consider a recession that reduces tax revenues nationwide. This would reduce the MSAs’ gross assigned revenues. But the fall in national tax revenues would mean that the BGAs would also fall, offsetting the falls in the MSAs’ gross revenues. The BGA-based approach therefore means that the UK government rather than the MSAs would bear the revenue risk and volatility associated with the national economic cycle – through lower or higher BGAs.
Revenue-indexed BGAs would also offer some protection against UK government policies that affect revenues nationally. Consider an increase in the nationwide tax-free personal allowance. This would reduce the MSAs’ gross assigned revenues, but because it would also reduce revenues nationally, it would also reduce the BGAs too. These lower BGAs would then offset the reductions in gross revenues – insulating MSAs’ net revenues from the change in the tax-free personal allowance.
The offset would not be exact though. As discussed in Section 9.4, differences in MSAs’ income distributions mean that the same policy can have somewhat different effects on their revenues. For example, lower-than-average incomes in the Northern and Midlands MSA areas mean that an increase in the personal allowance would reduce their gross revenues by proportionately more than the national average. This would mean that the fall in these MSAs’ gross revenues would be larger than the fall in the BGAs: their net funding would still fall somewhat as a result of the UK government’s decision to increase the tax-free personal allowance. Further refinement of the BGA approach – such as separate BGAs for revenues from the different income tax bands, as in Wales – could provide some insurance against economic shocks or UK government policies affecting different parts of the income distribution and hence different MSAs differently.28
But the continued existence of underlying grant funding in a BGA system does introduce one element of risk for MSAs that would not exist in a tariff and top-up system: the UK government’s decision about the levels of those underlying grants. Indeed, the Scottish and Welsh Governments highlight the uncertainty associated with block grant funding which can be changed multiple times during the course of a year (e.g. House of Commons Scottish Affairs Committee, 2025).
The uncertainty associated with grant funding for MSAs is perhaps not as extreme as for the Scottish and Welsh Governments, for which the Barnett formula means that every change in spending in England leads to a change in grant funding: most MSAs’ grants are set out for a period of one to a few years. But if one of the objectives of revenue assignment is to provide MSAs with not only greater financial incentives but also longer-term clarity over future funding than currently, a BGA approach and continued reliance on short-term underlying grants would not achieve this.
However, the insurance against nationwide tax revenue shocks and tax policy changes provided by the BGA approach to equalisation means this approach would be worth considering if either:
- The UK government could provide longer-term grant funding spanning multiple Spending Review periods, on a much larger scale than the long-term ‘investment funds’ it already guarantees for 30 years. Whether this is feasible is not just a political question: setting MSAs’ grant funding a decade or more in advance may increase the risk to the UK government’s finances given uncertainty about the overall long-term fiscal outlook and so the affordability of any long-term grant commitments.29
- Or the government and MSAs decide that it is worth continued uncertainty about grant funding in order for MSAs to be insured against nationwide tax revenue shocks.
Floors, tapers, resets and other insurance mechanisms
A key feature of both the tariff and top-up approach and the BGA-based approach to equalisation described above is that they equalise only for initial differences in revenues and spending needs – albeit indexed in some way over time. This is what provides the financial incentive to support economic and tax base growth: as discussed above, MSAs would benefit from the marginal growth in their assigned tax revenues, because the equalisation they benefit from or contribute to does not get updated if they fall further behind or pull further ahead of the national average.
Over time, though, this could lead to very large divergences in funding opening up, potentially due to factors largely outside of MSAs’ control. MSAs struggling economically would see their funding fall behind MSAs in economically thriving areas, reducing their capacity for investment and spending to support growth, and so potentially exacerbating differences in their economic fortunes.
If the government wants to provide financial incentives for growth, some divergence is inevitable. But, especially if factors outside MSAs’ control are a big driver of differential revenue performance – as seems likely to be the case – the government might still want to prevent divergence growing too large or persisting indefinitely. Here we discuss a number of methods it could use to do this.
Floors, ceilings and tapers
One option is a mechanism to limit the largest relative falls and increases in revenues. For example, as highlighted in Box 9.1, the BRRS includes a ‘safety net’: payments that top areas’ retained business rates revenues up to a minimum floor level if they would otherwise be below that level. These are funded by ‘levies’ on revenue growth in areas that started with relatively high initial revenues, which reduce the marginal retention of changes in business rates revenues down to a minimum of 25% (from the standard 50%).30 Similar floors and/or tapers exist in equalisation systems in several other countries, including Australia, Canada, Denmark, Germany, Sweden and Switzerland.31
A feature of both the BRRS and many systems elsewhere is that they are asymmetric: equalisation is stronger for areas whose tax base either falls significantly or is low than it is for areas whose tax base either rises significantly or is high. Contrast, for example, the hard floor provided by the BRRS’s safety net with the partial tapering of its levies. Hard floors (and ceilings) significantly reduce the financial incentives that areas subject to them have to boost their revenues – for example, authorities on the BRRS’s safety net do not gain from underlying revenue growth at all until they get back above the safety-net threshold. In contrast, tapers preserve some financial incentives, but do less to offset big falls or increases in revenues.
An asymmetric system such as that used in the BRRS makes sense if it is funding levels that are of paramount importance for authorities whose revenues have fallen substantially – for example, to fund a core set of services and investments – and the government still wants to provide at least some financial incentive for successful areas to support further growth. But a system could be symmetric or asymmetric in the other direction – using a tapered system to limit falls in revenues but a hard cap to limit increases.
The appropriate choice of floors, ceilings and tapers depends on how the government trades off funding levels and financial incentives for the affected MSAs. For example, if it wanted those MSAs whose gross revenues have fallen significantly to still have at least some incentive to increase them, a taper rather than a hard floor would make sense – although that would do somewhat less to protect them from the fall in their revenues.
Resets
Another option to prevent divergences between MSAs growing indefinitely is some form of update or reset to the tariffs and top-ups or BGAs. This would allow MSAs to retain the benefits (and bear the costs) of good (and poor) performance of their assigned gross revenues for some period of time, before fully or partially updating the equalisation system to reflect the new revenues (and potentially spending needs) of different MSAs. For example, after retaining above-inflation increases in business rates revenues from 2013–14 to 2025–26, authorities’ funding is now being updated on the basis of new assessments of business rates revenues and spending needs between 2026–27 and 2028–29. Authorities will again gain or lose from real-terms changes in business rates until a further periodic reset is made (the date of which has not yet been confirmed).
There are several considerations when designing such a reset.
First is the design. The periodic reset used in the BRRS has the benefit of being relatively straightforward conceptually: an area will bear the marginal changes in its assigned revenues up until a given year T, when the system is reset again. However, this fixed cut-off year T can, in principle, distort incentives. In the immediate run-up to a reset, it would be more financially beneficial to an MSA if activity that boosts revenue could be delayed until just after the reset – the revenue increase would then be retained for several years, rather than being redistributed away as part of an imminent reset. Conversely, if actions that reduce revenues could be brought forward, the revenue loss could be compensated for as part of the reset. Whether such incentives would affect MSA behaviour in practice is unclear – although it seems like more of a risk for business rates than for income tax. This is because MSAs may have more direct influence over the timing of business rates revenues, given the role they play in both facilitating and authorising property development.
A rolling or phased reset is one way to avoid this distortion to incentives. Rather than a reset applying to all assigned gross revenue in a given year T, a rolling reset allows changes in gross revenues from any given year to be kept for up to T years. For example, for T=10, changes in revenues in 2026–27 would be retained until 2035–36, while changes in revenues in 2027–28 would be retained until 2036–37. MSAs would know that any changes in revenue in a given year would be retained for the full 10 years, whichever year they occur in – with no incentive to artificially delay or bring forward activities. The drawback of this approach, though, is greater complexity: each year, assigned revenues need to be portioned out into growth and declines associated with each previous year, so that the appropriate portion can be reset. This complication means it is probably only worthwhile if the distortions created by periodic resets in fixed years are likely to have a meaningful impact on MSAs’ behaviour.
A second issue is how often any resets should take place – and whether they should be full or partial. Less frequent and partial resets would mean stronger financial incentives for increasing the tax base and economic growth – because the revenue gains resulting from growth (or reductions from poor economic performance) would be borne by the MSA for longer. Conversely, more frequent and fuller resets would provide greater insurance against large divergences in funding opening up, likely due in many cases to factors largely outside of MSA control.
Forecasts and reconciliations
Tax revenues are not just volatile, divergent and uncertain in the longer term; they are also subject to uncertainty in-year. It is unclear in advance exactly how much taxable activity there will be during the year, and some taxes – including self-assessed income tax bills – are paid once the tax year is over. This means the government cannot assign MSAs their actual revenues in a given year, because it does not know what they will be.
Existing approaches used in the BRRS and tax devolution to the Scottish and Welsh Governments provide examples of how this can be addressed. The key thing is that in both cases, the amount of revenue retained in respect to a given year is initially based on forecasts. Any differences between forecasts and actual revenues are then reconciled in subsequent years – with authorities and the devolved governments receiving a reconciliation payment if actual revenues exceed forecasts and making a reconciliation payment if actual revenues are lower than forecasts.32 Using a similar approach for MSAs’ assigned income tax revenues would give them time to plan how to respond if revenues under- or over-shoot forecasts.
The Scottish and Welsh Governments are also able to borrow to smooth the cost of paying reconciliation payments back to the UK government when initial forecasts for revenues are overly optimistic. Currently, MSAs – like local authorities – cannot borrow for day-to-day (resource) expenditure, only capital expenditure. There is therefore a question as to whether MSAs should be given the flexibility to borrow to address forecast errors, or whether their existing reserves and re-timing of capital borrowing would be sufficient to address this risk. If borrowing powers are deemed necessary, these should probably be accompanied by independent forecasting for the assigned revenues of MSAs (as the Office for Budget Responsibility does for Wales and as the Scottish Fiscal Commission does for Scotland). This would avoid the risk of MSAs purposefully over-forecasting revenues and delaying the financial consequences through the use of the resource borrowing powers.
9.7 Modelling different assignment and equalisation options for income tax
We now illustrate how big an effect different assignment and equalisation options for income tax could have on the future funding of different mayoral strategic authorities using a number of scenarios for revenue and income growth. It is important to note that these are not forecasts of how different MSAs will actually fare; they are instead projections based on a range of reasonable alternative paths for revenues. The scenarios illustrate how the design of the new assignment system will impact the post-equalisation (net) funding received by different MSAs.
All monetary amounts presented are in 2026–27 prices using the GDP deflator. Further information on our data and modelling assumptions can be found in the methodological appendix to this chapter. Our scenarios start in 2028–29, the year in which the government plans income tax revenue assignment to begin. MSA-level revenues in that year are projected forward from the estimates for 2023–24 set out in Table 9.5, under the assumption that they increase in line with the Office for Budget Responsibility (OBR)’s March 2026 forecasts for national income tax revenue growth. We assume from that point onwards that assigned income tax revenues will replace the integrated settlement grants received by each MSA. For that reason, our analysis focuses on the MSAs that already receive integrated settlements: Greater London, Greater Manchester, Liverpool City Region, North East, South Yorkshire, West Midlands and West Yorkshire. As shown in Table 9.7 above, integrated settlements account for approximately 7–9% of projected income tax revenues for the Northern and Midlands E-MSAs, but less than 1% for Greater London.
Our baseline assumption is that the government assigns each MSA 10% of income tax revenues. While this exceeds the integrated settlement for all of the authorities currently receiving them, meaning they would all be subject to tariffs (albeit of different sizes) under a tariff and top-up equalisation system, we choose this as it represents an easy-to-communicate round number. In reality, the government could choose to assign more or less revenue and replace more or less grant funding than the integrated settlements. Appendix 9B illustrates how a formal equalisation system could operate with different stocks of grant funding replaced and different rates of assignment, by offsetting these with tariffs or top-ups for each MSA. A higher rate of assignment would mean stronger financial incentives but also greater financial risk, while a lower rate of assignment would mean weaker financial incentives but also lower financial risk.
We set up the different equalisation systems so that, post-equalisation, the net revenue retained by each MSA is equal to its confirmed integrated settlement in 2028–29, satisfying the ‘revenue neutrality’ and ‘no detriment’ principles. Again, the government could choose a different approach in practice. For example, as discussed earlier, existing grant allocations are based in part on previous negotiations, the investment priorities as of past Spending Reviews, and differences in assessed spending needs. The government may choose to anchor a longer-term revenue assignment and equalisation system on updated funding allocations for each MSA: for example, the same funding per resident for a given set of responsibilities; or an updated estimate of spending needs. If the government does make such changes, we will analyse them in due course, but we do not model the (infinite) range of potential changes to existing integrated settlements here.
Our scenarios for revenue growth are used to illustrate the quantitative importance of the following key points already discussed qualitatively:
- Revenue-based indexation of equalisation would better maintain equalisation.
- A lower assignment share for London would reduce the risk of funding divergence between the capital and other MSAs.
- By-band assignment would reduce scope for funding divergence under inflation-linked tariffs but not necessarily under revenue-indexed tariffs.
- A BGA-based approach would provide meaningful protection against common revenue shocks.
Our analysis focuses on growth and volatility of net revenues measured relative to the integrated settlements that revenue assignment is assumed to replace. The figures below therefore illustrate the growth in net funding or the volatility in net funding relative to existing funding for the range of services and investments covered by integrated settlements. However, as illustrated in Table 9.2 above, the integrated settlements represent only part of MSAs’ overall funding: around 90% for the North East, just under half for Liverpool City Region and the West Midlands, around a fifth to a quarter in Greater Manchester, South Yorkshire and West Yorkshire (where large police budgets are the responsibility of the MSAs), and 4% in Greater London (where large police budgets, social housing budgets and transport budgets are the responsibility of the mayor). While large parts of MSAs’ overall funding – notably funding for police services – is ring-fenced, and so could not be cut back if assigned tax revenues disappointed, increases in assigned revenues could be spread across services funded by other parts of MSAs’ funding (remaining grants, council tax, existing assigned business rates revenues). We therefore also report changes in net revenues and volatility in net revenues measured as a share of MSAs’ overall funding to show implications of assignment for MSAs’ overall spending power.
Scenario 1. Revenue-based indexation would better maintain equalisation
Our first scenario illustrates that the choice of indexation for tariffs and top-ups would have significant effects on the scale of net revenue growth that will be seen by different MSAs – even if underlying income tax revenues in all areas grow by the same rate.
With 10% of revenue assigned, the tariffs required so that the initial post-equalisation revenues equal the integrated settlement grants to be forgone in 2028–29 would vary from £54 million in today’s prices (£37 per person) for South Yorkshire to £9.2 billion (£994 per person) for Greater London – reflecting both Greater London’s relatively much higher income tax revenues and its much lower integrated settlement. Importantly, this means the tariffs would account for a much smaller share of assigned income tax revenues in South Yorkshire (13%) than in London (94%). In other words, while South Yorkshire’s initial post-tariff revenues would be 87% of its initial assigned income tax revenues, Greater London’s would be just 6%.
For future years, we assume that inflation is 2% (in line with the OBR’s long-term assumptions for CPI inflation) and that every MSA’s assigned (gross) revenue grows by 2% above inflation. Figure 9.10 shows how post-tariff (net) revenues would evolve under this scenario if tariffs were indexed in line with prices (in green) or in line with national income tax revenues (in yellow).
Figure 9.10. Revenue divergence under different tariff and top-up indexation schemes if 2% real-terms growth in income tax revenues in all areas
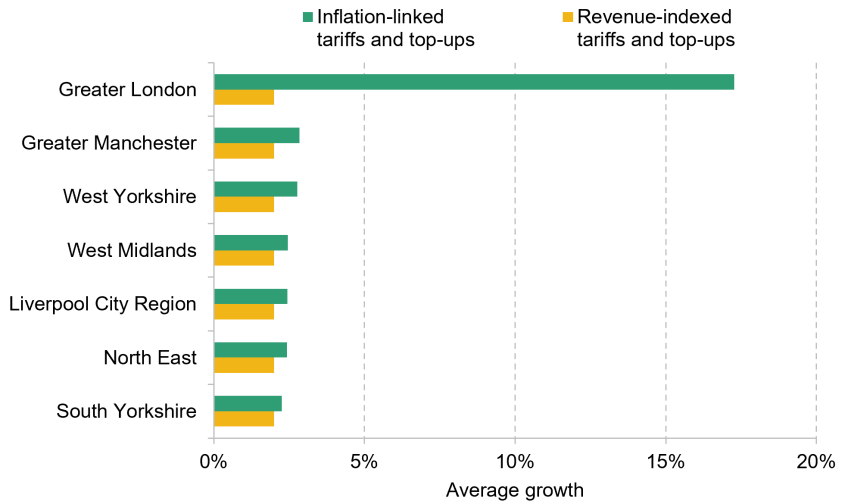
Source: Authors’ calculations using Office for National Statistics (2025) and HM Revenue and Customs (2026).
As discussed above, with gross revenues increasing faster than inflation, inflation-linking would see the tariffs become progressively smaller compared with growing income tax revenues over time. In turn, this would mean post-tariff (net) revenues would grow faster than pre-tariff (gross) revenues. But differences in the size of the tariffs mean that just how much faster would vary across MSAs. In particular, the bigger the initial tariffs, the more important is the gap between the inflation-linked tariffs and the growth in underlying gross revenues – meaning faster growth in net revenues.
Greater London illustrates this most clearly: its very high tariff means it would benefit most when tariffs increase less quickly than revenues. Indeed, even with 2% real-terms growth in pre-tariff (gross) revenue, its post-tariff (net) revenue would increase by 17% in real terms a year on average, compared with between 2% and 3% in the other MSAs. This is a huge difference: after 10 years, an average of 17% real-terms growth would amount to an additional £2.0 billion in funding (£170 per person) for Greater London compared with 2.5% real growth, for example. The difference between Greater Manchester (2.8%) and South Yorkshire (2.3%) would amount to an extra £54 million a year in funding for the former after ten years – although this is only equivalent to £14 per person. The decline in equalisation, particularly between Greater London and the other MSAs, if tariffs are indexed in line with prices would therefore be economically meaningful.
Indexing tariffs in line with average revenue growth would instead mean that if all MSAs’ pre-equalisation (gross) revenues grew in line with that national average, so would their post-equalisation (net) revenues, as illustrated by the yellow bars in Figure 9.10. In other words, equalisation between MSAs would be better maintained over time.
Under our scenario, all MSAs would see slower growth in their net revenues if tariffs were linked to average revenue growth (yellow bars) rather than inflation (green). This is because all would be paying a tariff and – if gross revenues are growing in real terms – these tariff payments grow faster if linked to revenue growth than if linked to inflation. Again the amounts involved are not insubstantial: after 10 years, even for South Yorkshire, where the effect would be smallest, tariffs would be £12 million higher in today’s prices, and the strategic authority’s funding £12 million lower.
But it is not necessarily the case that all MSAs would have lower incomes under revenue indexation: income tax revenues could grow less quickly than prices, meaning revenue-indexed tariffs would grow less quickly; or if either a lower share of revenues were assigned or more grant funding replaced than just the integrated settlements, some MSAs would receive top-ups, and so benefit from revenue-indexed top-ups if gross revenue growth outpaced inflation.
In addition, revenue indexation is arguably more consistent with the government’s ‘revenue neutrality’ principle. It ensures that if MSAs’ pre-equalisation (gross) revenues were to grow in line with the national average, so would their net revenues. In contrast, if gross revenues grow in real terms, inflation-linkingwould see authorities’ net revenues outpace their gross revenues. This would increase the share of overall income tax revenues flowing to MSAs and reduce the share flowing to the UK government for allocation across the country as a whole.
Changes in net revenues measured as a share of overall MSA funding
Figure 9.10 shows changes in net revenues measured relative to the integrated settlements that we assume revenue assignment would replace. If we instead measure changes in net revenues relative to MSAs’ overall funding, the picture looks rather different.
While under inflation-linked tariffs, growth in net revenues for Greater London would be very high (17% a year in real terms) measured relative to the integrated settlement being replaced, it would be much slower (1.4% a year in real terms) relative to the capital’s large overall budget (including for police, social housing and transport). This would be more comparable to the situation in other MSAs, where measured as a share of MSAs’ overall funding, growth in net revenues would be between 0.7% a year (in Greater Manchester) and 2.3% a year (in the North East) in real terms. Under revenue indexation, net revenue growth for Greater London would equate to an average of 0.1% a year in real terms relative to the mayor’s overall budget, and range from 0.5% to 1.9% a year in real terms relative to overall budgets for the other MSAs.
This is because if only integrated settlements are replaced with assigned revenues, Greater London’s small integrated settlement and large overall budget mean any growth in assigned revenues, while large relative to the integrated settlement, would be only small relative to the capital’s overall funding. If the government wanted Greater London to be exposed to bigger changes in its overall funding as a result of revenue assignment, it should therefore replace more of its grant funding beyond just the integrated settlement. Inflation- rather than revenue-linking tariffs would be a poor substitute for this.
Scenario 2. A lower assignment share for London would reduce the risk of funding divergence between the capital and other MSAs
Scenario 1 illustrated the effects of different tariff and top-up indexation methods under the assumption that revenues grew at the national average in all MSAs – an unlikely scenario. Our second scenario illustrates that even if tariffs were revenue-indexed, Greater London’s high revenues mean it could still see its net income pull far ahead (or indeed fall behind) the other MSAs.
To show this, we assume that income tax revenues in Greater London grow by 4% per year above inflation each, compared with 2% elsewhere.33 The first two bars in Figure 9.11 show that under this scenario, if Greater London were assigned the same 10% share of revenues as the other MSAs, its net revenues would increase by an average of 25% a year in real terms with inflation-linked tariffs and by 16% under revenue indexation – far outstripping the 4% growth in its underlying gross revenues.34 This compares with growth of just 2.6% and 1.7%, respectively, for the other MSAs, as illustrated in the last two bars in the figure.
Figure 9.11. Revenue divergence under different assignment shares for London if 4% real growth in income tax revenues in London and 2% elsewhere
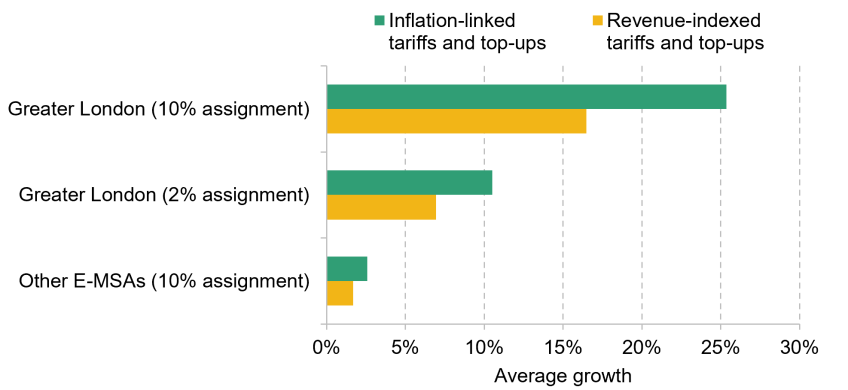
Source: Authors’ calculations using Office for National Statistics (2025) and HM Revenue and Customs (2026).
The middle two bars show that reducing Greater London’s share of assigned revenues to 2% would substantially reduce the divergence in net revenues: Greater London’s net revenues would grow by an average of 11% a year in real terms with inflation-linked tariffs and 7% with revenue-indexed tariffs.
Again, the amounts of funding involved could be substantial: real-terms growth of 7% a year rather than 11% would mean £219 million a year less in funding for Greater London on average, over 10 years – and £1.1 billion less in the tenth year – and an equivalent amount extra for the UK government to distribute across the country. And while our scenario illustrates the effects of different assignment rates for Greater London if revenues in the capital outpace those in the rest of the country, they could also lag: a lower assigned share of revenues would mean Greater London’s exposure to this risk is less outsized than it would be if the same share of revenues was assigned as nationally. Of course, as well as reducing the upside and downside risk to Greater London’s net revenues, a lower revenue assignment share would also significantly reduce the financial incentives it faces to grow its income tax base: the usual insurance–incentive trade-off.
Again, if we examine changes in net revenue measured as a percentage of MSAs’ overall funding, the picture looks somewhat different. For example, with 10% of revenues assigned to Greater London, its net revenue growth would equate to an increase in overall funding of 2.9% a year in real terms under inflation-linked tariffs and 1.3% under revenue-indexed tariffs. And with 2% of revenues assigned, Greater London’s growth in net revenues would equate to increases in overall funding of 0.6% and 0.4% a year, respectively, under inflation-linking and revenue indexation. Again this illustrates that the potential for Greater London’s net revenues to pull away or fall behind other MSAs’ is significant relative to the integrated settlement that seems almost certainly set to be replaced – but much smaller relative to Greater London’s overall budget.
Scenario 3. By-band assignment would reduce scope for funding divergence under inflation-linked tariffs but not necessarily under revenue-indexed tariffs
Differences in revenue growth between MSAs can sometimes reflect differences in revenue growth from different parts of the income distribution – whether due to underlying economic trends or policy changes (such as the changes in income tax thresholds seen during the 2010s).
Figures 9.12 and 9.13 show how post-equalisation (net) revenues for the different MSAs would evolve under the two approaches to assigning income tax revenues discussed in Section 9.5 – a flat percentage of revenues and the by-band approach – under such a scenario. In particular, we assume that income in the basic-rate band grows by 1% a year in real terms, while income in the higher- and additional-rate bands grows more quickly, at 3% a year in real terms. The red bars in the charts show the average annual real-terms change in net revenues for each MSA if 10% of overall income tax revenues were assigned, and the blue bars if 3 percentage points for each tax band were assigned. We illustrate this separately with inflation-linked tariffs and top-ups in Figure 9.12 and revenue-indexed tariffs and top-ups in Figure 9.13.
Figure 9.12. Revenue divergence with inflation-linked tariffs and top-ups, and different portions of income tax assigned, if differential growth in revenues by band
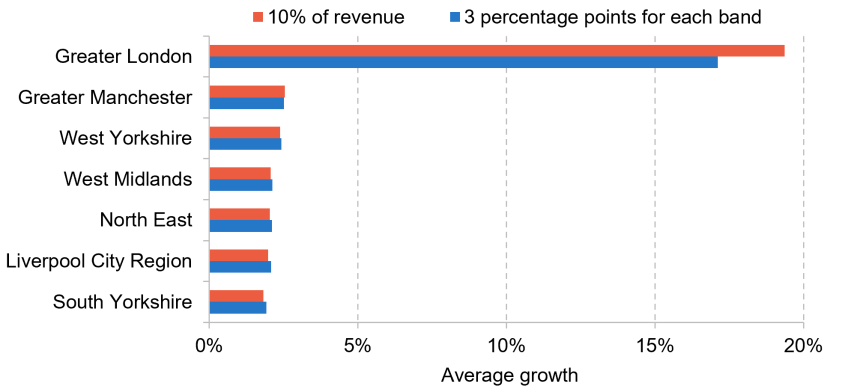
Note: Both assignment options modelled using inflation-linked tariffs for equalisation, and assume income tax revenues from the basic-rate band grow by 1% a year in real terms in every area, and revenues from the higher- and additional-rate bands grow by 3% a year in real terms. See Appendix 9A for details of how estimates of income tax revenues by band have been constructed.
Source: Authors’ calculations using Office for National Statistics (2023 and 2025) and HM Revenue and Customs (2025 and 2026).
Figure 9.13. Revenue divergence with revenue-indexed tariffs and top-ups, and different portions of income tax assigned, if differential growth in revenues by band
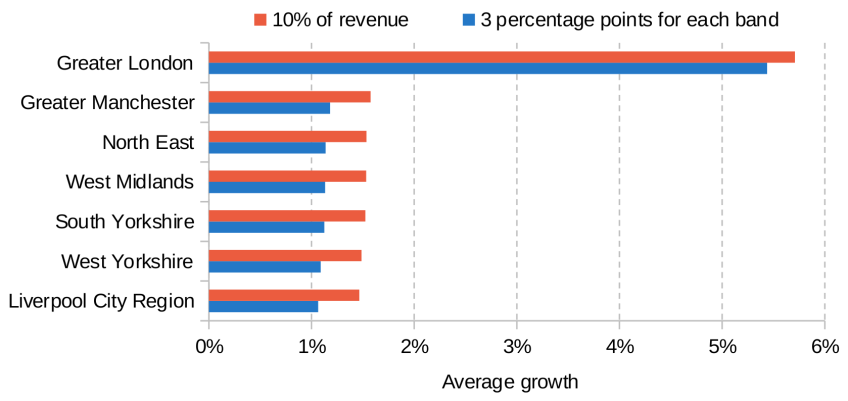
Note: Both assignment options modelled using revenue-indexed tariffs for equalisation, and assume income tax revenues from the basic-rate band grow by 1% a year in real terms in every area, and revenues from the higher- and additional-rate bands grow by 3% a year in real terms. See Appendix 9A for details of how estimates of income tax revenues by band have been constructed.
Source: Authors’ calculations using Office for National Statistics (2023 and 2025) and HM Revenue and Customs (2025 and 2026).
The combination of real-terms growth in income tax revenues and the concentration of that growth in the higher- and top-rate tax bands means that Greater London’s post-equalisation (net) income would significantly outpace that of the other MSAs: growing by almost 20% a year in real terms over 10 years with inflation-linked tariffs and top-ups, compared with between 1.8% and 2.6% for the other MSAs under the flat-percentage-of-revenue model. With revenue-indexed tariffs and top-ups, Greater London’s funding would grow by 5.7%, compared with 1.5–1.6% in the other MSAs.
Under the by-band approach, growth in Greater London’s net revenues would still be very high, but would be reduced somewhat: with inflation-linked tariffs and top-ups, it would be reduced from 19.4% to 17.1%; with revenue-indexed tariffs and top-ups, it would be reduced from 5.7% to 5.4% a year in real terms over 10 years. This would entail £555 million less funding a year for Greater London by the tenth year with inflation-linking and £24 million less with revenue indexation.
With inflation-linking, there would be modest increases of about 0.1 percentage point a year in the growth of net revenues under the by-band approach for the other MSAs (other than Greater Manchester) – which total £23 million a year extra in the tenth year. In contrast, there would be reductions of 0.4 percentage points a year under revenue-indexed tariffs and top-ups – a total reduction of £120 million a year in the tenth year for the same five MSAs.
These results reflect three different impacts of the by-band approach relative to the flat-percentage-of-revenue approach:
- Less exposure to increases in income tax revenues from the higher- and additional-rate tax bands. This reduces the growth in net revenues across all MSAs under the by-band approach relative to the flat 10% of revenue approach. It is particularly pronounced for Greater London given a larger fraction of its tax base is in the higher- and top-rate tax bands.
- Effects on the amount of revenue initially assigned and hence the size of tariffs and top-ups. For Greater London, 3 percentage points for each band represents less than 10% of all revenues. This means assigning 3 percentage points for each band would require a smaller tariff for Greater London – and so, for a given increase in gross revenue, the increase in post-tariff (net) revenue would be smaller. Conversely, for the other MSAs, 3 percentage points for each band represents more than 10% of all revenues. This means assigning 3 percentage points for each band would require bigger tariffs for the other MSAs – and so, for a given increase in gross revenue, the increase in post-tariff (net) revenue would be larger. This is why under inflation-linked tariffs, the other MSAs see faster growth in net revenue under the by-band approach than under the flat 10% of all income tax revenues approach.
- Effects on the indexation of tariffs and top-ups. Under revenue-indexed tariffs and top-ups, the slower average growth rate for gross revenues from 3 percentage points for each band than from 10% of all revenues under our scenario means that tariffs would increase by less. This slower increase in tariffs particularly benefits Greater London with its still very high tariff. This is why with revenue-indexed tariffs and top-ups, the by-band approach does not narrow the gap in the growth in net revenues between Greater London and the other MSAs as one might initially expect it to.
These complicated interactions between assignment approach, size of tariffs and top-ups, and indexation of tariffs and top-ups illustrate the importance of the government considering the design of the revenue assignment and equalisation system in the round. A by-band approach, by reducing differences in income tax revenues per person between Greater London and the other MSAs, would reduce the likelihood and scale of divergences arising from different rates of revenue growth from different tax bands if tariffs and top-ups are linked to inflation. But if tariffs and top-ups are linked to average growth in assigned (gross) revenues, and if Greater London is subject to a large tariff, it is possible that by-band approaches could even increase divergences in the funding received by Greater London and other MSAs.
Scenario 4. A BGA-based approach would provide meaningful protection against common revenue shocks
Our final scenario illustrates the potential for a BGA-based approach to meaningfully reduce the volatility of net revenues for MSAs – provided that the UK government can set the accompanying block grant funding on a long-term basis. In particular, we assume that each MSA’s pre-equalisation (gross) revenues grow by 2% a year in real terms, on average, but that year-on-year growth rates are volatile and correlated across MSAs (with a correlation coefficient of 0.75), so that each MSA’s revenues usually (but not always) follow the same national cycle. The volatile part of the growth rate is calibrated to have a standard deviation of 5.9 percentage points to match the degree of volatility observed for non-London MSAs from 2011–12 to 2019–20. We then compare the volatility of net revenues for the tariff and top-up approaches and the BGA-based approaches, assuming that the block grant that would be required alongside the BGA-based approach is increased at a steady 2% a year in real terms. Our measure of volatility is the average year-on-year difference in the growth rate of net revenues, measured in percentage points. To ensure our results reflect the most likely effect of these systems, we run 1,000 simulations (for each MSA for 10 years) and report the median degree of volatility in net revenue across all simulations (to avoid extreme values affecting the measure disproportionately).
Figure 9.14 shows the resulting estimates of volatility: the green bars if equalisation was undertaken by inflation-linked tariffs, the purple if it was undertaken by revenue-indexed tariffs and top-ups, and the yellow bars if it was undertaken by BGAs. The figure shows that for the Northern and Midlands MSAs, the average difference in year-on-year growth rates in net revenues would be 7.5 percentage points under inflation-linked tariffs, 5.8 percentage points for revenue-indexed tariffs and 3.2 percentage points under the BGA-based system. In other words, revenue-driven volatility would be around half as high under the BGA-based approach as under the tariff-based approaches.
Figure 9.14. Volatility in growth of net revenues under block grant adjustment (BGA) approach and tariffs and top-ups, if underlying income tax revenues grow by around 2% a year in real terms in each area but are subject to shocks
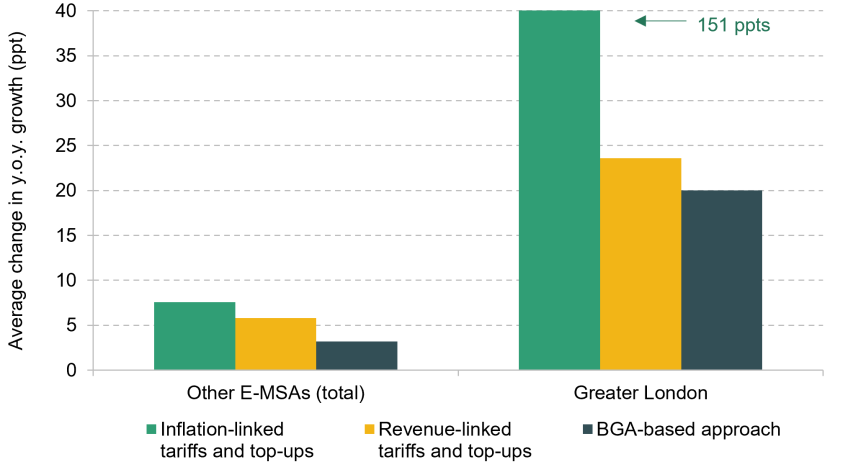
Note: Vertical axis for Greater London is truncated at 40 percentage points. Median volatility for Greater London with inflation-linked tariffs and top-ups was 151 percentage points across 1,000 simulations. Reflects volatility in post-equalisation (net) revenues under same assumptions as Scenario 1, but with year-to-year volatility in growth in underlying income tax revenues (around the same 2% trend real-terms growth rate).
Source: Authors’ calculations using Office for National Statistics (2025) and HM Revenue and Customs (2026).
For Greater London, volatility would be extremely high under inflation-linked tariffs: the average difference in year-on-year growth rates in net revenues would be 151 percentage points. This reflects the fact that Greater London’s large tariffs (initially 94% of gross revenues given a 10% assignment share) would mean even modest volatility in pre-equalisation (gross) revenues would translate into very high volatility in net revenues. Indexing the tariffs in line with average revenues would address most of this excess volatility: the average difference in year-on-year growth rates in Greater London’s net revenues would be 24 percentage points. This is because with Greater London’s tariff being so large and revenue shocks correlated across the country, varying the tariff up and down with national revenue growth would insulate Greater London from most of the volatility in its own assigned income tax revenues. The BGA-based approach would further reduce the average difference in year-on-year growth rates in net revenues to 20 percentage points – a smaller proportionate fall than for the Northern and Midlands MSAs.
Once again, if we were to examine volatility in net revenues relative to overall funding, this would make a very substantial difference for Greater London in particular. In fact, as shown in Figure 9.15, volatility in overall funding in the capital would be similar to that in other MSAs with inflation-linked tariffs (4.7 percentage points compared with 3.2 percentage points); with other approaches, it would be less volatile from year to year than the average across other MSAs. This reflects that London’s integrated settlement funding – which we assume in these scenarios will be replaced by revenue assignment – represents a much smaller share of its overall funding (4%) than the average across other MSAs (around 31%). How difficult managing volatility in assigned revenues is in practice for MSAs will depend on the extent to which other parts of their overall funding is ring-fenced – a large share of Greater London’s funding is ring-fenced for police services and social housing investment, for example – as well as on their existing reserves and capital borrowing powers.
Figure 9.15. Volatility in growth of overall funding under block grant adjustment (BGA) approach and tariffs and top-ups, if underlying income tax revenues grow by around 2% a year in real terms in each area but are subject to shocks
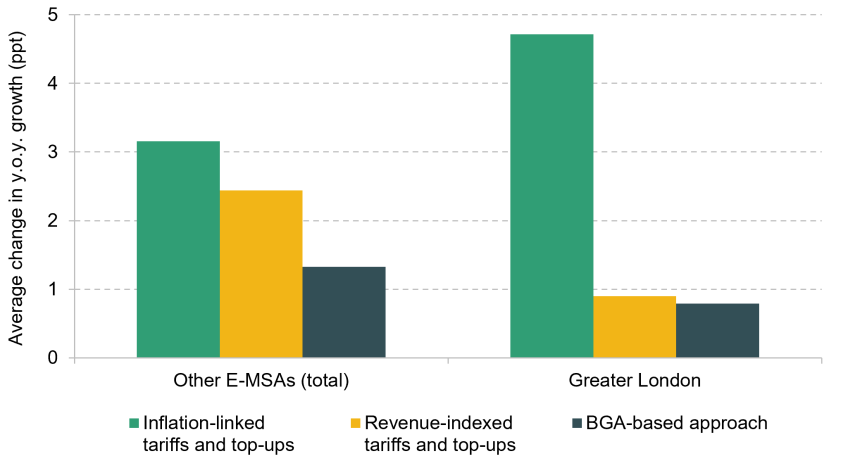
Note: Reflects volatility in MSAs’ overall funding, assuming the portion of each MSA’s total funding in 2026–27 (Figure 9.2) which is not from their integrated settlement is fixed in real-terms every year. Scale of y axis differs from that in Figure 9.14.
Source: Authors’ calculations using Office for National Statistics (2025) and HM Revenue and Customs (2026).
Summary
Taken together, these scenarios therefore illustrate that choices over the precise revenues to assign to (different) MSAs and the design of equalisation arrangements will have very important implications for both the funding levels and risks faced by different MSAs. Increasing initial tariffs (and top-ups) in line with average revenue growth rather than inflation could prevent Greater London’s net income pulling ahead to the tune of billions of pounds a year even if its pre-equalisation (gross) revenues grew in line with the rest of the country – and mean more for the UK government to redistribute around the rest of the country (Scenario 1). A lower assignment share for London would also limit the risk of Greater London pulling ahead or falling behind, albeit by reducing its financial incentives for growth (Scenario 2). And the amount of insurance against cyclical volatility that a BGA-based system could provide relative to a tariff and top-up system would be meaningful – provided that underlying block grants could be set out on a long-term basis (Scenario 4). Finally, comparisons of net revenue growth under assignment on a by-band approach and on a flat-percentage-of-revenue approach illustrate how different aspects of the assignment and equalisation system – how much revenue is assigned, what form assignment takes, and the indexation of tariffs and top-ups – interact (Scenario 3). The UK government should account for this in its modelling and decision-making.
9.8 Should income tax revenue assignment extend to local authorities too?
While the government has confirmed that most local authorities as well as mayoral strategic authorities will from April 2027 see part of their grant funding replaced with an increased share of business rates revenues, local authorities are not currently set to receive an assigned share of income tax.
There are a number of reasonable arguments in favour of focusing on MSAs rather than local authorities for income tax assignment in the first instance. First is the function of strategic authorities, with both their powers and spending relating to economy-related services and investments. In contrast, local authorities spend the largest share of their budgets on demand-led services for vulnerable residents, such as social care services – and the government may be less willing for funding for such services to vary based on local income tax revenue performance (particularly given local authority funding already varies due to the pre-existing business rates retention scheme).35
Second is the geography of strategic authorities, which are closer to covering functional economic areas, including the more affluent and more deprived parts of city regions (such as Trafford and Rochdale in Greater Manchester, or Kensington & Chelsea and Barking & Dagenham in Greater London). In contrast, local authorities cover much smaller areas, and there is even greater variation in revenue levels and trends, and volatility, than at strategic authority level. This is illustrated in Figure 9.16, which compares differences in revenues per person as of 2023–24 for selected MSAs and their constituent local authorities (in today’s prices). For example, while at an MSA level revenues per person varied by a factor of just over 3.5-fold between the highest (Greater London, £8,590) and the lowest (West Midlands, £2,400), at a local authority level they varied by a factor of over 25 (City of London, £47,260, versus Sandwell, £1,820).36 Indeed, nine local authorities in Greater London had revenues over £10,000 per person, while all bar one of those in the West Midlands (Solihull) had revenues below the West Midlands MSA average.
Figure 9.16. Comparison of income tax revenues per person for selected MSAs and their constituent local authorities, 2023–24 (2026–27 prices)
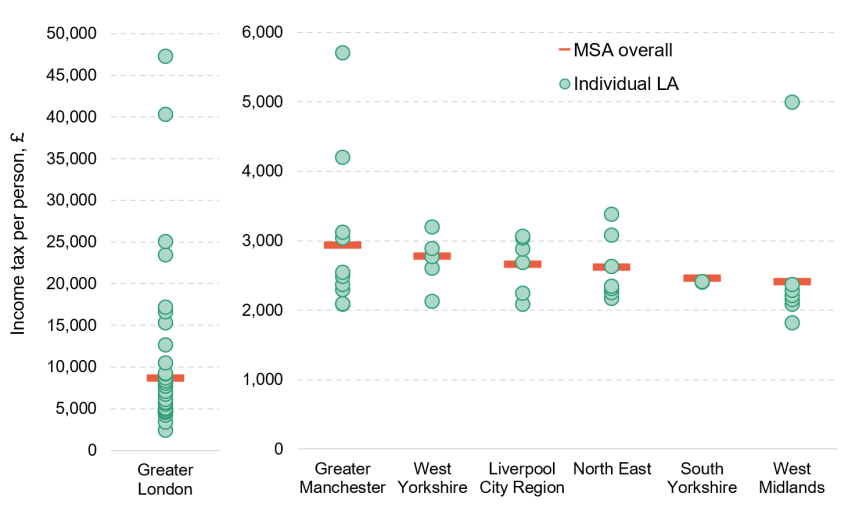
Note: Shows the seven E-MSAs that received an integrated settlement in 2026–27. A separate vertical axis has been used for Greater London.
Source: Authors’ calculations using Office for National Statistics (2025), HM Revenue and Customs (2026) and Office for Budget Responsibility (2026a).
There have, though, been multiple calls for greater devolution of revenues to local authorities as well as strategic authorities, including by the Local Government Association (2020, 2022 and 2024), the County Councils Network (2025) and the All Party Parliamentary Group on Local Government (2026). These mostly emphasise the potential for devolved tax and revenue-raising powers to enable councils to have more ways to directly raise funding than solely council tax.
Assigning local authorities a share of income tax would not provide them with such direct revenue-raising powers. But, as with strategic authorities, it could provide a stronger financial reward and incentive for supporting economic growth, as well as a long-term buoyant source of revenue stretching beyond annual or three-yearly local government finance settlements. However, the nature of the services provided by local authorities would suggest more focus on equalisation, insurance and long-term stability of funding (and less on incentivisation) than at the strategic authority level, if a share of income tax or other tax revenues were to be assigned in future.
Assignment for local authorities could be operated in several ways. The government could directly assign revenues to them in place of part of their grant funding (as with MSAs), enabling it to implement a standardised equalisation system for all local authorities. Alternatively, it could assign further revenues to MSAs, and require them and their constituent local authorities to agree how revenues should be shared within their areas. However, if MSAs wanted to insulate local authorities from revenue divergences, volatility and uncertainty, that would mean the MSAs bearing the associated risks instead.
If in future, rather than assigning income tax revenues, the government decides to allow subnational variation in tax rates, there would perhaps be a stronger case for granting such rate-varying power to local authorities as well as strategic authorities. In particular, local authorities are responsible for a set of services – most notably, adult social care services – for which spending needs are expected to increase substantially over time (Office for Budget Responsibility, 2026b). Currently, local authorities can raise revenues directly only via council tax, otherwise relying on (uncertain) growth in retained business rates and central government grant funding. The power to raise revenues through a major tax such as income tax would provide an important additional way for local authorities to vary their budget (up or down) to better reflect local preferences and to support financial sustainability. More local revenue-raising powers could reduce the pressure on the UK government to raise revenues to pay for the increasing demand for (and costs of) local as well as national public services. Greater reliance on local revenue-raising powers need not imply less redistribution across the country: as it now once again does for council tax, the UK government could continue to redistribute between local authorities on the basis of how much they would raise if they set the average local income tax rate.
Amin-Smith, Harris and Phillips (2019) discuss the options for the design of a local income tax. They argue that a flat-rate local income tax (such as in Scandinavia) would have several advantages over a progressive one, including less inequality in revenues, less uncertainty and volatility over revenues, and less scope for either upwards or downwards pressure on the tax rates charged on the highest incomes. However, the design of a local income tax is a potential issue for a future Budget, rather than the upcoming Budget and fiscal devolution roadmap.
9.9 Concluding remarks: the key decisions
The UK government has confirmed its intention to assign a (bigger) share of business rates revenues and a share of income tax revenues to England’s mayors in lieu of part of their current grant funding. This chapter has shown there are several important decisions on how this will work in practice that need to be made.
First and foremost is the main objective of revenue assignment. This should then guide decisions about how much revenue to assign and how much ongoing equalisation of revenues to undertake. The government has made clear it wants the system to balance rewards for growth with fairness between places with different spending needs; but where should the balance lie?
If the government decides that it is the provision of financial rewards for growth (and the ability to borrow against and re-invest these rewards) that is the most important way in which the policy could improve outcomes, then assigning a larger share of revenues and equalising less of the subsequent changes in revenues would make sense: mayoral strategic authorities need sufficient skin in the game to make it worth playing.
On the other hand, if the government decides that the biggest potential benefit is longer-term clarity over funding and hence greater scope for longer-term planning and investment by mayors that is the main benefit of revenue assignment, then it would make sense to equalise more: funding will be more predictable if MSAs are insulated from more of the volatility and potential divergences in local revenues over time.
The government may decide both rationales for revenue assignment (‘rewards’ and ‘funding clarity’) are important, but it will still need to decide which is more important. Answers to several related questions should help with this question, and guide how much revenue to assign and how much to equalise for post-assignment changes in the revenues of different MSAs:
- How much influence the government, MSAs and other stakeholders believe mayors have over local business rates and income tax bases. As we have discussed, there are clear links between MSAs’ powers and responsibilities and these tax bases, but how important MSA policy and investment are for local revenue growth relative to other factors is uncertain. The bigger the potential influence of MSA behaviour, the more scope there is for financial incentives to improve outcomes. Conversely, if the major drivers of local assigned revenue performance are believed to be outside MSA control, then more of the changes in revenue represent ‘luck’ (or a lack thereof) rather than ‘reward’ (or ‘punishment’) for local policies. In that case, more ongoing equalisation of revenues would make sense to insulate MSAs from this financial risk.
- How changes in the spending needs of MSAs relate to changes in assigned revenues. Greater divergences between spending needs and underlying trends in business rates and income tax revenues would imply more ongoing equalisation – to limit the scope for divergence. As we have discussed, given a large share of the grants that are likely to be replaced by assigned revenues relate to capital spending, and capital spending tends to be ‘lumpier’ than resource spending, the potential for divergences between MSAs’ assigned revenues and spending needs may be relatively high.
- How willing the government, MSAs and other stakeholders are to see divergences in revenue performance lead to divergences in funding for mayors’ economy-related functions and investment. In part, this should reflect views on how important MSA spending and investment are for local economic development and well-being. But fundamentally it is a political question about where we, as a society, think the balance between local and national responsibility for funding the type of services and investments MSAs are responsible for lies.
Our analysis has also shown that while the trade-off between incentives for revenue growth and equalisation according to needs cannot be avoided, it can be ameliorated. Assigning income tax revenue on a by-band basis, increasing initial equalisation payments (such as ‘tariffs’ and ‘top-ups’) over time in line with average growth in assigned tax revenues, and assigning a lower share of revenues to London than to the other MSAs could all reduce the scope for divergences in funding over time, and should be seriously considered by the government. But as our scenario analysis has shown, the impacts of these different choices do interact – by-band approaches do not always reduce the scope for divergence, depending on other design choices – and these approaches come with trade-offs that need to be considered:
- Assigning revenues from a fixed number of percentage points of each tax band (e.g. 3ppt) would mean MSAs gain just as much from boosting the income of basic-rate taxpayers as of higher- and top-rate taxpayers – rather than less, as is the case if a flat share (e.g. 10%) of all revenues is assigned. It would also insulate MSAs from the revenue effects of some central government decisions, such as changes in tax rates and in the higher- and top-rate thresholds. But such a system would also mean MSAs would not benefit as much from ‘fiscal drag’ – the boost to revenues from people moving up over tax thresholds as incomes outpace tax thresholds. Thus, while such a system may reduce divergences in revenue trends between MSAs, it will also likely mean lower average growth in assigned revenues too – with more of the growth instead continuing to flow to the UK government to allocate across the country as a whole.
- Increasing initial equalisation payments in line with average revenue growth would keep redistribution between individual MSAs and between MSAs and the UK government more up to date without weakening incentives for growth – but would be a little more complex to operate. It would also tend to favour different areas from the inflation-linked equalisation payments that mayors may already be familiar with from the business rates retention scheme (BRRS).
- Assigning a lower share of local tax revenues to the Greater London Authority than to other MSAs would reduce the scope for Greater London’s net revenues to diverge (upwards or downwards), but would also weaken the financial incentives of policymakers in the capital to boost local growth.
Decisions will need to be taken on a range of other issues. The existing BRRS and systems in other countries suggest floors, ceilings and/or tapers to insulate MSAs’ funding from the biggest decreases or increases in assigned revenues could be sensible – especially if big changes are more likely to be due to factors outside mayors’ control. A system of revenue forecasting and reconciliation to out-turns will also be needed – which the BRRS and devolved tax arrangements for Scotland and Wales can provide templates for. Consideration needs to be given to whether such a process, when combined with MSAs’ existing reserves and capital borrowing powers, will provide sufficient flexibility to address remaining volatility in assigned revenues, or whether further borrowing powers may be required, again as in Scotland and Wales.
The fiscal devolution roadmap will also need to confirm the pace of change: although the government has confirmed that income tax assignment will apply to all MSAs and begin in April 2028, it is not fully clear whether this marks the start of a roll-out or the date all MSAs will swap grants for assigned revenues. With international evidence suggesting institutional capacity and governance quality are important elements of successful fiscal devolution, a phased roll-out, starting with the most mature E-MSAs, may be less risky. This would enable investment in the finance and strategy teams of other MSAs, as well as provide time for improvements to political decision-making. However, if revenue assignment does prove successful, too long a delay in rolling it out to the rest of England may risk entrenching inequalities in strategic authority performance – and hence local economic outcomes.
It is unclear how long-term the roadmap will be. Increased business rates assignment will start next April, with income tax assignment beginning from April 2028. But given the Burnham administration’s clear belief in devolution as a way to improve services, support growth and rebuild engagement between government and the public, the government will need to decide whether to set a longer-term destination for reform. This could include powers for mayors to introduce new taxes beyond their planned tourism tax powers and/or to move from income tax assignment to partial devolution in the future. Such a move towards greater fiscal devolution would bring additional administration and compliance costs, as well as the potential for tax rate differences to distort the location of economic activity. But it would also give MSAs a more direct lever to vary both their funding and the post-tax incomes of their residents. And it may increase the benefits of extending arrangements to local authorities too, given their currently limited options to raise revenues to cover the rising costs of the core public services they provide – although the government would need to think carefully about the balance between local and national responsibility for raising these revenues.
With devolution at the heart of the government’s agenda, evidenced and justified decisions on these different issues will be important not only for the upcoming roadmap and Budget – but for the government’s broader direction and legacy.
Appendix 9A. Methodology
Estimating strategic and local authority funding in 2026–27
To estimate funding on a consistent basis across strategic and local authorities (Figures 9.2, 9.3 and 9.4), we use budget/forecast data published by MHCLG for 2026–27, from three sources: Revenue account (RA) data and Specific and special revenue grants (SG) budget data, both from Ministry of Housing, Communities and Local Government (2026b) and Local authority capital expenditure and receipts (CER) from Ministry of Housing, Communities and Local Government (2026c). Components of funding are calculated as follows:
- Resource grants = Revenue Support Grant (RA line 951) + Police Grant (RA line 956) + Total Revenue Grants within AEF (SG line 699)
- Council tax = Council tax requirement (RA line 990) + Collection fund surpluses and deficits for Council Tax (RA line 980)
- Business rates = Retained income from Rate Retention scheme (RA line 970) + Business Rates Supplement (GLA only) (RA line 893)
- Other resource funding = Appropriations to/from other earmarked financial reserves (RA line 915) + Appropriations to/from unallocated financial reserves (RA line 916) + Community Infrastructure Levy (RA line 894) + Interest and investment income: external receipts and dividends (RA line 886) – Capital Expenditure charged to the GF Revenue Account (RA line 865) + External Trading Accounts net surplus/deficit (RA line 831) + Integrated Transport Authority levy (RA line 822) + Waste Disposal Authority levy (RA line 824) + London Pensions Fund Authority levy (RA line 827) + Other levies (RA line 828)
- Capital grant funding = Grants from central government departments (CER) + Grants from non-departmental public bodies (CER) + Grants from other local authorities (CER) + Grants from GLA bodies (CER)
- Capital borrowing = Total prudential borrowing (CER)
- Other capital funding = Total capital receipts used to finance capital expenditure (CER) + General Fund Revenue Account (CER) + Grants from private developers & leaseholders (CER)
For South Yorkshire and West Yorkshire strategic authorities, we add in funding for the South Yorkshire and West Yorkshire Police and Crime Commissioners respectively, to reflect that the mayors of these authorities have responsibility for police services in their areas.
Note that our approach aims to avoid double counting of funding that can be reflected in both resource and capital accounts and has been checked with officials from the Ministry of Housing, Communities and Local Government. However, the design of the forms means some relatively small expenditures may unavoidably be double counted.
For forecast business rates revenues in each area (Table 9.4), we use line 12 from part 1 of published NNDR1s for 2026–27 (Ministry of Housing, Communities and Local Government, 2026d). These reflect the total forecast non-domestic rating income collected by billing authorities in areas currently covered by mayoral strategic authorities, whether or not they are retained locally. This includes rates actually collectable from rate payers, as well as section 31 grants which are paid to compensate authorities for the cost of changes to the business rates system.
Modelling income distributions and tax revenue by local authority
Estimates of actual revenue from income tax, by MSA (Table 9.5 and Figure 9.6) and local authority (Figure 9.16), are taken from HMRC estimates (HM Revenue and Customs, 2026). Revenues from a 10% share of overall income tax revenues can be directly calculated from these.
To estimate the revenues that would be obtained from a given number of percentage points of each tax band, we combine three data sources:
- For the bottom 90% of the earnings distribution, we use the Annual Survey of Hours and Earnings (ASHE), which provides earnings at each percentile for local authorities within the relevant MSAs (Office for National Statistics, 2023).
- We then use the Survey of Personal Incomes (SPI) to derive region-specific ratios between earnings and taxable income at each percentile and apply these ratios to scale ASHE earnings up to an estimate of taxable income for the same 90% of the distribution (HM Revenue and Customs, 2025).
- For the top 10% of the distribution, we fit a Pareto distribution to each local authority’s taxable income distribution, choosing the shape parameter so that simulated income tax receipts – calculated by applying the historical tax schedule to the combined distribution – match HMRC’s published receipts for that local authority as closely as possible (HM Revenue and Customs, 2026).
Combining the bottom 90% and the fitted top 10% gives a full estimated income distribution for each local authority in each year, from which we calculate revenue raised from each income tax band. These are then aggregated to MSA level. The proportion of total income tax revenues in each MSA area that we estimate were raised from each tax band are shown in Table 9A.1. Note that these are estimates only.
Table 9A.1. Estimates of income tax revenues from each tax band by mayoral strategic authority, 2023–24
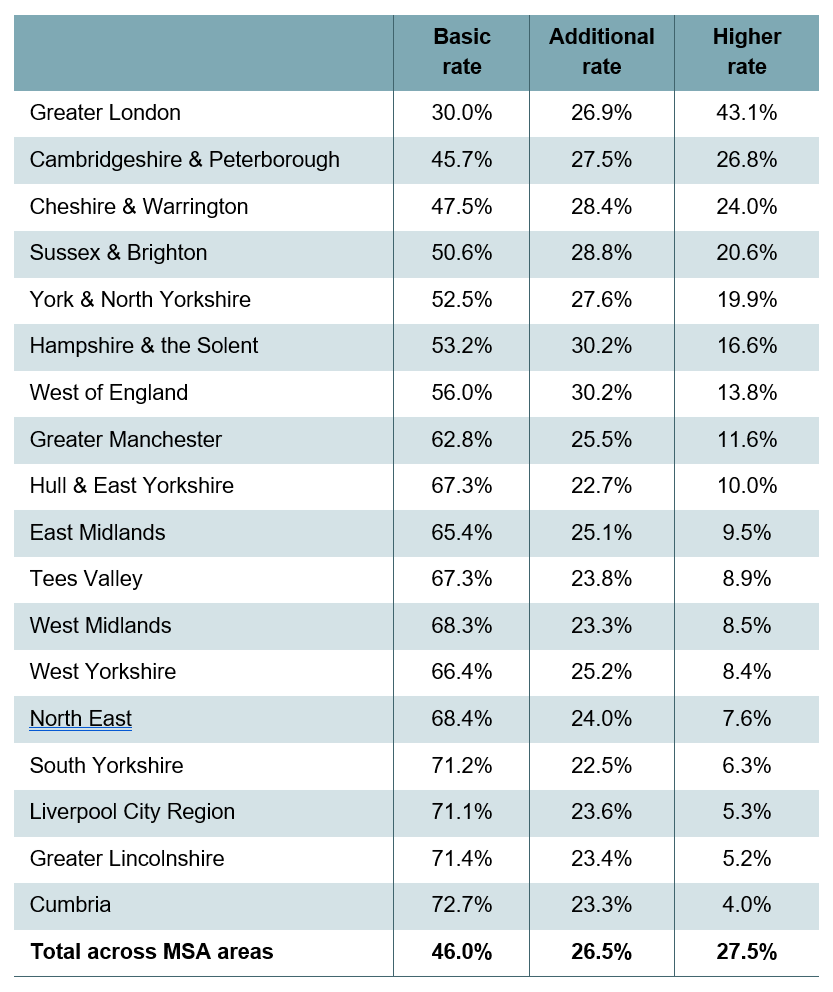
Source: Authors’ calculations using Office for National Statistics (2023) and HM Revenue and Customs (2025 and 2026).
The forward-looking scenarios in the analysis in Section 9.7 start from 2028–29 estimates of income tax revenue, overall and by band, for each MSA. These figures are derived by projecting 2023–24 out-turns forward in line with projected UK-wide income tax growth to 2028–29. These are used as the starting point for all scenario modelling.
Appendix 9B. Illustration of how equalisation payments could operate
A formal system of equalisation payments to/from MSAs could allow government to achieve overall fiscal neutrality in the first year that revenue assignment is introduced, as well as revenue neutrality for each MSA. This is true whatever initial stock of income tax revenues government wants to assign to MSAs, and whatever grant funding it wants these assigned revenues to replace. If an MSA’s assigned revenues exceed the grants it forgoes, it pays a tariff equal to the difference, reducing its net revenues to the same level as if revenue assignment had not been introduced. If an MSA’s assigned revenues are lower than the grants forgone, it receives a top-up payment from central government equal to the difference, increasing its net revenues to the same level.
The green line on Figure 9B.1 shows the options open to government if it decided to replace integrated settlement funding for the seven MSAs that receive it in 2028–29 and wanted to achieve overall fiscal neutrality. The share of overall income tax revenues assigned would then imply different equalisation payments to or from MSAs on average. Total planned integrated settlement funding in 2028–29 is equivalent to 2.8% of total projected income tax revenues collected from these MSA areas in the same year; if this share of revenues were assigned, equalisation payments could average zero (although individual MSAs would need to pay tariffs or receive top-up payments). Assigning these areas a 10% share of income tax revenues would be consistent with MSAs paying a tariff to central government of £446 per person on average.
Figure 9B.1. Combinations of share of income tax revenues assigned and average equalisation payments that deliver overall fiscal neutrality
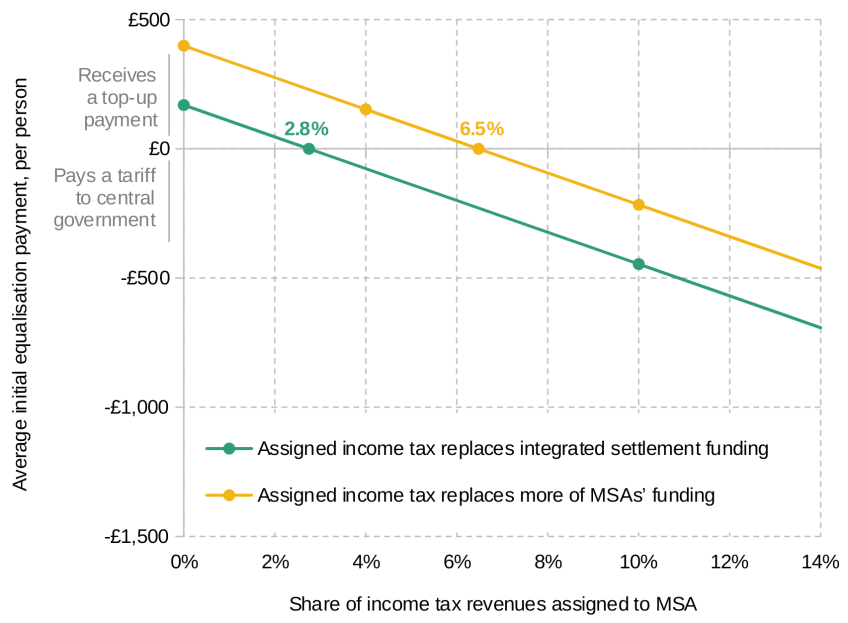
Note: Real-terms (2026–27 prices) assuming assigned income tax revenues replace funding in 2028–29 for the seven MSAs that receive integrated settlements. Income tax revenues in each MSA area are projected based on 2023–24 receipts by local authority and the OBR’s March 2026 estimates for UK-wide increases in nominal income tax receipts.
Source: Authors’ calculations using Office for National Statistics (2024 and 2025), HM Revenue and Customs (2026) and Office for Budget Responsibility (2026a).
Government could choose any other set of existing grant funding to replace with assigned income tax revenues. As an illustrative example, it could choose to replace funding equal to 6.5% of income tax revenues in these areas. This would be approximately the same as replacing all of the resource and capital grants and council tax revenues they budgeted to receive in 2026–27, less the amount they expected to spend on police services. The yellow line shows the combinations of shares of income tax assigned and average tariff or top-up payments that would be consistent with overall fiscal neutrality in that case. If government assigned MSAs 10% of income tax revenues, they would need to pay a tariff of £217 per person on average to deliver fiscal neutrality. If it assigned only 4% of income tax revenues, MSAs would need to receive a top-up payment of £153 per person on average.
Figure 9B.2 shows the options open to government if it decided to replace integrated settlement funding for the seven MSAs that receive it in 2028–29 and wanted to deliver revenue neutrality for each MSA – leaving them no better or worse off in 2028–29 than if revenue assignment has not been introduced. The intercept of the line for an MSA (the diamond marker) reflects its per-person integrated settlement funding; the slope reflects estimated income tax revenues per person in its area. Higher income tax revenues result in a steeper line, as any given percentage point increase in the share of income tax revenues assigned to an MSA yields more gross revenue per person, and must be offset by a larger tariff payment if the MSA is not to see an immediate boost to its overall funding.
Figure 9B.2. Combinations of share of income tax revenues assigned and equalisation payments that deliver revenue neutrality for individual MSAs when assigned revenues replace integrated settlement funding
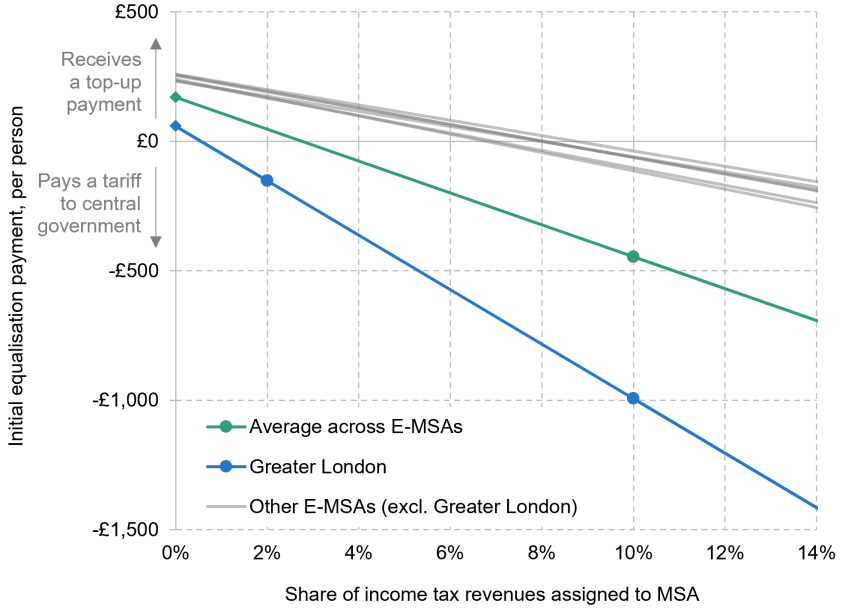
Note: Real-terms (2026–27 prices) assuming assigned income tax revenues replace funding in 2028–29 for the seven MSAs that receive integrated settlements. Income tax revenues in each MSA area are projected based on 2023–24 receipts by local authority and the OBR’s March 2026 estimates for UK-wide increases in nominal income tax receipts. Lines represent combinations such that each MSA would be no better or worse off if assigned income tax revenues replaced their integrated settlement funding in 2028–29.
Source: Authors’ calculations using Office for National Statistics (2024 and 2025), HM Revenue and Customs (2026) and Office for Budget Responsibility (2026a).
The blue line shows the combinations that would deliver revenue neutrality for Greater London, and the grey lines for the other six MSAs. The intercept of Greater London’s line (the blue diamond) is lower as it receives less integrated settlement funding (£59 per person) than the other MSAs. The blue line slopes more steeply downward, reflecting that income tax revenues per person are higher in the capital. The combination of these two factors explains why our scenarios in Section 9.7 involved Greater London paying a much higher per-person tariff than other MSAs. If government rolled in integrated settlement funding and assigned London 10% of income tax revenues, we estimate it would need to pay a tariff of £994 per person to be made no better off in 2028–29. With a smaller assignment share (e.g. 2% of overall revenues), the required tariff would be much smaller (£152 per person). The other six MSAs that receive integrated settlements would need to receive a top-up payment if they were assigned less than
7–9% of income tax revenues, and to pay a tariff if they were assigned a greater share.
References
Agrawal, S. and Phillips, D., 2020. Catching up or falling behind? Geographical inequalities in the UK and how they have changed in recent years. https://ifs.org.uk/publications/catching-or-falling-behind-geographical-inequalities-uk-and-how-they-have-changed.
All Party Parliamentary Group on Local Government, 2026. APPG inquiry on fiscal devolution. https://lgiu.org/news-views/all-party-parliamentary-group-on-local-government/appg-inquiry-on-fiscal-devolution/.
Amin-Smith, N., Harris, T. and Phillips, D., 2019. Taking control: which taxes could be devolved to English local government? IFS report, https://ifs.org.uk/publications/taking-control-which-taxes-could-be-devolved-english-local-government.
Boadway, R. and Eyraud, L., 2018. Designing sound fiscal relations across government levels in decentralized countries. International Monetary Fund, WP/18/271, https://www.elibrary.imf.org/view/journals/001/2018/271/article-A001-en.xml.
Boadway, R. and Shah, A., 2009. Fiscal Federalism: Principles and Practice of Multiorder Governance. Cambridge University Press, https://doi.org/10.1017/CBO9780511626883.
Burnham, A., 2026. Andy Burnham speech at the People’s History Museum, Manchester – 29 June 2026. https://andyburnham.org.uk/2026/07/20/andy-burnham-speech-at-the-peoples-history-museum-manchester-29-june-2026/.
Cabinet Office, 2026. Rewiring the state – Cabinet Statement. https://www.gov.uk/government/publications/rewiring-the-state-cabinet-statement/rewiring-the-state-cabinet-statement-html.
Chen, Y., Lyu, B. and Ma, G., 2024. Revenue sharing, fiscal incentives, and economic growth: evidence from China. Kyklos, 77(1), 149–83, https://doi.org/10.1111/kykl.12362.
Convention of Scottish Local Authorities, 2018. Transient visitor tax. COSLA, Edinburgh, https://www.cosla.gov.uk/__data/assets/pdf_file/0027/16389/coslatransientvisitortax.pdf.
County Councils Network, 2025. Fiscal devolution: exploring the options in England’s counties. https://www.countycouncilsnetwork.org.uk/publications/grant-thornton-fiscal-devolution---exploring-the-options-in-englands-counties.
Department of the Environment, 1983. Streamlining the cities: government proposals for reorganising local government in Greater London and the metropolitan counties.
Dougherty, S. and Akgun, O., 2018. Globalisation, decentralisation and inclusive growth. In J. Kim and S. Dougherty (eds), Fiscal Decentralisation and Inclusive Growth, OECD Publishing, https://doi.org/10.1787/9789264302488-5-en.
Egger, P., Köthenbürger, M. and Smart, M., 2010. Do fiscal transfers alleviate business tax competition? Evidence from Germany. Journal of Public Economics, 94(3–4), 235–46, https://doi.org/10.1016/j.jpubeco.2009.10.002.
European Commission, 2012. Report on public finances in EMU: 2012. European Economy 4/2012, http://ec.europa.eu/economy_finance/publications/european_economy/2012/pdf/ee-2012-4.pdf.
Fiscal Commission for Northern Ireland, 2022. FCNI Final Report – more fiscal devolution for Northern Ireland? https://www.fiscalcommissionni.org/evidence/fcni-final-report-more-fiscal-devolution-northern-ireland.
Han, L. and Kung, J. K-S., 2015. Fiscal incentives and policy choices of local governments: evidence from China. Journal of Development Economics, 116, 89–104, https://doi.org/10.1016/j.jdeveco.2015.04.003.
Hauptmeier, S., 2007. The impact of fiscal equalization on local expenditure policies – theory and evidence from Germany. ZEW Discussion Paper 07-081, https://www.zew.de/publikationen/the-impact-of-fiscal-equalization-on-local-expenditure-policies-theory-and-evidence-from-germany.
Hauptmeier, S., 2009. Fiscal competition and the impact of fiscal equalisation. Dissertation, LMU Munich, https://edoc.ub.uni-muenchen.de/9691/.
HM Revenue and Customs, 2025. Survey of Personal Incomes, 2022-2023: Public Use Tape. [data collection]. UK Data Service. SN: 9422, http://doi.org/10.5255/UKDA-SN-9422-1.
HM Revenue and Customs, 2026. Income and tax by borough and district or unitary authority, confidence intervals: 2023 to 2024. https://www.gov.uk/government/statistics/income-and-tax-by-borough-and-district-or-unitary-authority-confidence-intervals.
HM Treasury, 2026a. Mais Lecture 2026. https://www.gov.uk/government/speeches/mais-lecture-2026.
HM Treasury, 2026b. Northern Growth Strategy: next steps. https://www.gov.uk/government/publications/northern-growth-strategy-case-for-change/northern-growth-strategy-next-steps.
HM Treasury, 2026c. Chancellor John Healey’s Growth Speech 2026. https://www.gov.uk/government/speeches/chancellor-john-healeys-growth-speech-2026.
House of Commons Scottish Affairs Committee, 2025. The financing of the Scottish Government. First Report of Session 2024–25, https://publications.parliament.uk/pa/cm5901/cmselect/cmscotaf/456/report.html.
Jin, H., Quian, Y. and Weingast, B. R., 2005. Regional decentralization and fiscal incentives: federalism, Chinese style. Journal of Public Economics, 89(9–10), 1719–42, https://doi.org/10.1016/j.jpubeco.2004.11.008.
Jong, D., Tsvetkova, A., Lembcke, A. and Ahrend, R., 2021. A comprehensive approach to understanding urban productivity effects of local governments. OECD Regional Development Paper, https://www.oecd.org/en/publications/a-comprehensive-approach-to-understanding-urban-productivity-effects-of-local-governments_5ebd25d3-en.html.
Local Government Association, 2020. Fiscal devolution: adopting an international approach. https://www.local.gov.uk/publications/fiscal-devolution-adopting-international-approach.
Local Government Association, 2022. Reforming revenues – options for the future financing of local government. https://www.local.gov.uk/publications/reforming-revenues-options-future-financing-local-government.
Local Government Association, 2024. Local Government White Paper. https://www.local.gov.uk/local-government-white-paper.
Martínez-Vázquez, J., 2008. Revenue assignments in the practice of fiscal decentralization. In N. Bosch and J. Durán (eds), Fiscal Federalism and Political Decentralization, Edward Elgar, https://www.elgaronline.com/edcollchap/9781847204677.00010.xml.
Ministry of Housing, Communities and Local Government, 2024. English Devolution White Paper: power and partnership: foundations for growth. https://www.gov.uk/government/publications/english-devolution-white-paper-power-and-partnership-foundations-for-growth.
Ministry of Housing, Communities and Local Government, 2025a. Full steam ahead for Devolution Priority Programme. https://www.gov.uk/government/news/full-steam-ahead-for-devolution-priority-programme.
Ministry of Housing, Communities and Local Government, 2025b. Integrated settlement funds for 2026 to 2030. https://www.gov.uk/government/publications/integrated-settlement-funds-for-2026-to-2030.
Ministry of Housing, Communities and Local Government, 2026a. Review of local government reorganisation launched. https://www.gov.uk/government/news/review-of-local-government-reorganisation-launched.
Ministry of Housing, Communities and Local Government, 2026b. Local authority revenue expenditure and financing England: 2026 to 2027 budget individual local authority data. https://www.gov.uk/government/statistics/local-authority-revenue-expenditure-and-financing-england-2026-to-2027-budget-individual-local-authority-data.
Ministry of Housing, Communities and Local Government, 2026c. Local authority capital expenditure and receipts in England: 2025 to 2026 provisional outturn and 2026 to 2027 forecast. https://www.gov.uk/government/statistics/local-authority-capital-expenditure-and-receipts-in-england-2025-to-2026-provisional-outturn-and-2026-to-2027-forecast.
Ministry of Housing, Communities and Local Government, 2026d. National non-domestic rates collected by councils in England: forecast 2026 to 2027. https://www.gov.uk/government/statistics/national-non-domestic-rates-collected-by-councils-in-england-forecast-2026-to-2027.
National Audit Office, 2026. Devolution in England: funding and accountability. https://www.nao.org.uk/reports/devolution-in-england-funding-and-accountability/.
Nicol, S., 2014. Fiscal devolution – some comparative examples. Scottish Parliament Information Centre (SPICe) briefing.
OECD, 2025. Tax autonomy of state and local government. https://www.oecd.org/content/dam/oecd/en/topics/policy-sub-issues/fiscal-federalism-network/table_taxpower-2025.xlsx.
Office for Budget Responsibility, 2026a. Economic and fiscal outlook – March 2026. https://obr.uk/efo/economic-and-fiscal-outlook-march-2026/.
Office for Budget Responsibility, 2026b. Fiscal risks and sustainability – July 2026. https://obr.uk/frs/fiscal-risks-and-sustainability-july-2026/.
Office for National Statistics, 2023. Annual Survey of Hours and Earnings: 2023 revised results. https://www.ons.gov.uk/employmentandlabourmarket/peopleinwork/earningsandworkinghours/datasets/placeofresidencebylocalauthorityashetable8.
Office for National Statistics, 2024. National population projections: 2024-based with variants. https://www.nomisweb.co.uk/datasets/ppsyoav2024.
Office for National Statistics, 2025. Population estimates – local authority based by single year of age. https://www.nomisweb.co.uk/datasets/pestsyoala.
Office for National Statistics, 2026. HI00 Regional labour market: headline Labour Force Survey indicators for all regions. https://www.ons.gov.uk/employmentandlabourmarket/peopleinwork/employmentandemployeetypes/datasets/headlinelabourforcesurveyindicatorsforallregionshi00.
Prime Minister’s Office, 2026. PM hands mayors share of income tax to make lives better in every postcode. https://www.gov.uk/government/news/pm-hands-mayors-share-of-income-tax-to-make-lives-better-in-every-postcode.
PWC, 2019. Worldwide Tax Summaries Online. https://taxsummaries.pwc.com/.
Rodríguez-Pose, A. and Ezcurra, R., 2010. Does decentralization matter for regional disparities? A cross-country analysis. Journal of Economic Geography, 10(5), 619–44, https://doi.org/10.1093/jeg/lbp049.
Selby, O., and Breach, A., 2026. Fiscal devolution for England. Centre for Cities, https://www.centreforcities.org/publication/fiscal-devolution-for-england/.
Slattery, C. and Zidar, O., 2020. Evaluating state and local business incentives. Journal of Economic Perspectives, 34(2), 90–118, https://doi.org/10.1257/jep.34.2.90.
Smith Commission, 2014. Report of the Smith Commission for further devolution of powers to the Scottish Parliament. https://webarchive.nationalarchives.gov.uk/ukgwa/20151202171017/http:/www.smith-commission.scot/.
Walker, A., Ganesharatnam, L. and Kaye, S., 2026. Taxing for take-off: a new plan for fiscal devolution. Re:State, https://re-state.co.uk/publications/taxing-for-take-off-a-new-plan-for-fiscal-devolution/.
Endnotes
Authors

Martin Brogaard
Martin joined the IFS in 2025 and works in the IOD sector, researching consumer behaviour and nutrition. He also works on devolved government policy.

Kate Ogden
Kate joined the IFS in 2020 and works on local government finance and higher education.

David Phillips
David is Head of Devolved and Local Government Finance. He also works on tax in developing countries as part of our TaxDev centre.
More from IFS
Understand this issue


Policy analysis


Academic research


