
During 2014-2017, the share of adults using electronic payments in the developing world increased by over a third, and policymakers have expressed optimism regarding the role of this trend in promoting tax compliance. Leveraging the 2016 demonetisation in India, this article shows that areas that were more impacted by the policy, experienced faster growth in electronic payments and, in turn, average sales reported to the tax authority increased.
Transactions in developing economies are becoming increasingly cashless. Between 2014 and 2017, the share of adults using electronic payments in the developing world increased by over a third, from 32% to 44% (Demirguc-Kunt et al. 2018), and it is likely that Covid-19 has accelerated this shift in some places. The impact of this technological and structural change will be widespread – one area where policymakers have expressed optimism is the role that digital payments may play in promoting tax compliance (Rogoff 2016, OECD (Organisation for Economic Co-operation and Development), 2017, Awasthi and Engelschalk 2018).
Low levels of tax compliance are a major constraint on revenue collections in developing economies (Pomeranz and Vila-Belda 2019). Increasing electronic payments may be a boon to revenue authorities, since in principle they provide a paper trail which can aid in enforcement. However, this is not a given – while third-party information can improve tax compliance, authorities are not always able to utilise the information available to them effectively (Almunia et al. 2021), and taxpayers can strategically respond to enforcement activities to reduce their liabilities in other ways (Carillo et al. 2017).
Demonetisation and electronic payments
In a recent study (Das et al. 2022), we explore how a sudden and substantial increase in the use of electronic payments affects the tax reporting of firms in the context of the 2016 demonetisation in India. This reform wiped out the country’s two largest denomination notes (Rs. 500 and Rs. 1,000 notes) – representing 86% of currency in circulation – overnight. Due to printing press constraints and challenges in distributing new notes, new cash was only gradually reintroduced into the economy, resulting in substantial increases in the value of transactions through electronic payments (Lahiri 2020).
We focus on the state of West Bengal, where we combine administrative VAT (value-added tax) data with detailed local (postcode-level) data on these electronic payments, bank deposits, and proxies for economic activity1. Figure 1 shows that the national trend of increased electronic payments is replicated in West Bengal. In the first two quarters after the demonetisation announcement, local electronic payments for the average firm in our data were 500% higher than the previous three quarters. At the same time, average sales reported by VAT-registered firms increased by 11% after controlling for local economic activity.
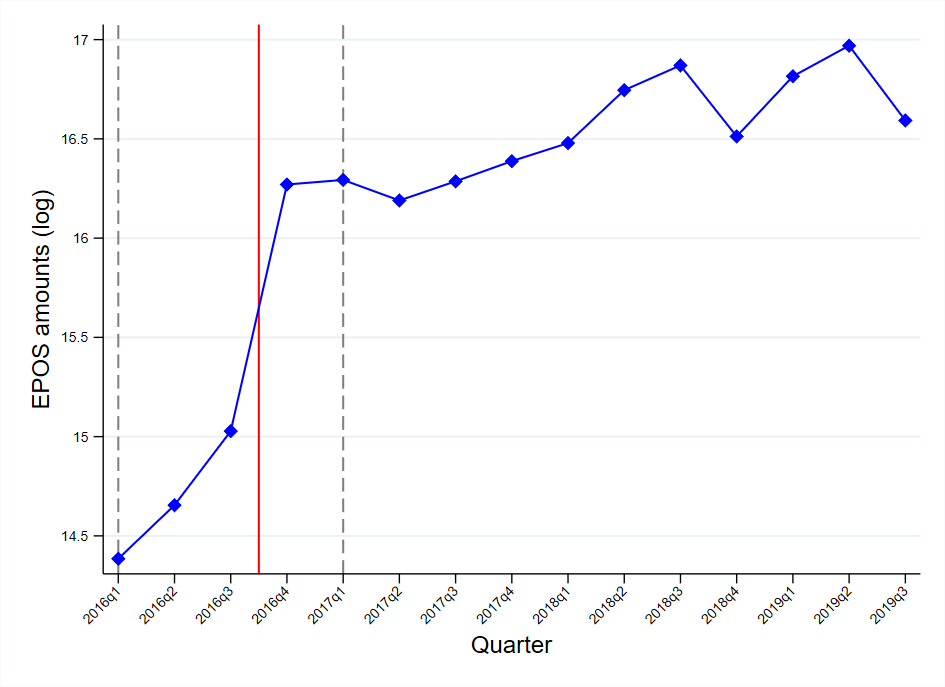
Figure 1. Total quarterly sales through electronic point-of-sale (EPOS) machines in West Bengal
Notes: (i) Figure shows (log) sales through India’s RuPay system in West Bengal, aggregated at the quarterly level to match the tax return data. (ii) The grey dashed lines indicate the period that overlaps with our tax return data; the red line indicates the beginning of demonetisation.
Electronic payments and tax reporting by firms
Reverse causality is a potential cause for concern when studying the effect of electronic payments on tax compliance: firms that experience tax enforcement shocks (such as visits by tax inspectors) may start paying more taxes and therefore find it less costly to offer electronic forms of payments to their consumers. To study the causal relationship between trends in local electronic payments and average sales reported by VAT-registered firms, we therefore exploit geographical variation in exposure to the demonetisation shock, measured on the basis of the presence of ‘currency chest’ banks in the local banking market2. Currency chest banks were responsible for distributing new bank notes, and the market share of these banks at the local level strongly predicts the increase in electronic payments during demonetisation. Figure 2 summarises this rationale: in areas with an above-average demonetisation ‘shock’ based on this currency chest measure, the subsequent increase in electronic payment values is much greater.
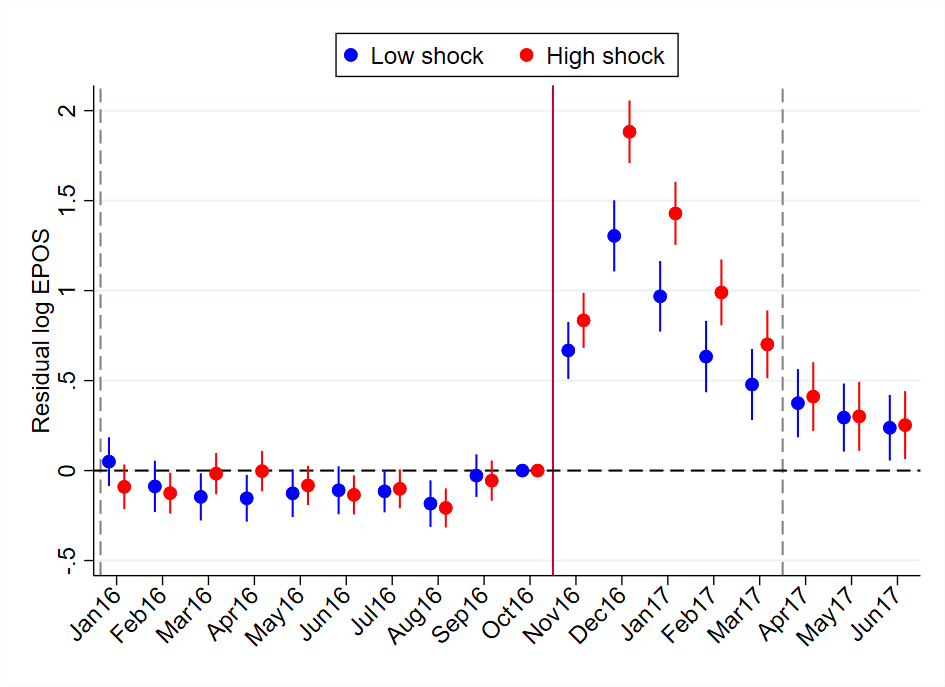
Figure 2. Growth in electronic payment volumes in areas with below- and above-median exposure to the demonetisation shock
Notes: Figure shows the monthly mean residualised value of log total electronic payments sales in areas (postcodes) with a value of the demonetisation shock variable above and below the median value (where the median is determined by weighting each postcode by the number of firms present in the administrative tax data). (ii) The demonetisation shock variable corresponds to one minus the currency chest market share in a postcode; see the Das et al. (2022) for more details. (iii) The grey dashed lines indicate the start and end of the period defining our estimation sample and the red line indicates the start of demonetisation. (iv) The residuals are obtained by regressing log EPOS sales in a postcode, on postcode fixed effects3 and a linear time trend in the pre-demonetisation period. The figure shows coefficient estimates from a linear regression of these residuals on monthly fixed effects, estimated separately for areas below and above the median shock value, with 95% confidence intervals4 based on robust standard errors.
We instrument5 for the value of electronic payment transactions at the local level using this proxy for the demonetisation shock, to estimate the causal impact on tax reporting, after accounting for overall economic activity as measured by night-time lights captured from satellites. This measure allows us to capture economic activity with more spatial and temporal granularity than official statistics. Previous work with the same data has suggested that nightlights can effectively capture short-term variation in economic activity, including the effect of demonetisation specifically (Beyer et al. 2018).
With this approach, we find that increases in electronic payments led firms to increase their reported sales. Specifically, we find that a 10% increase in electronic payments at the local level led to a 0.3% increase in average sales reported by firms. In a VAT system, tax liabilities also depend on reported purchases and the tax rates applying to inputs and outputs. Looking at firms’ tax liabilities, we find effects of a similar magnitude to our results for reported sales, though slightly smaller and less precisely estimated than in our main specification.
We interpret our results as a compliance effect since we control for economic activity. However, because our measure of electronic payments is at the local level and not at the firm level, we cannot distinguish between two related interpretations. One is a firm-level compliance story – whereby firms use electronic payments more, and in response report more of their sales to the tax authority due to the risk of non-compliance being detected. Another possibility is that firms that were more compliant prior to demonetisation and already used electronic payments gained market shares. While we cannot formally distinguish between these two possibilities, two facts suggest firm-level compliance is at least part of the story. Firstly, part of the increase in electronic payments during demonetisation is driven by an increase in the number of EPOS machines, rather than just greater transaction volumes and values. Secondly, the increase in reported sales is relatively the highest among the smallest VAT-registered firms. Given evidence that smaller firms are more likely to evade taxes (Kleven et al. 2016, Bachas et al. 2021), this may be suggestive of individual firms becoming more compliant.
Prior to demonetisation, electronic payments represented a small fraction of overall sales reported by VAT firms. Thus, we do not expect a one-to-one relationship between electronic sales and sales reported to the tax authority. Instead, electronic transactions may provide information to form the basis of an audit investigation, or provide tax authorities with a better proxy of firms’ true sales. Overall, our results suggest that electronic payments can explain half of the increase in sales reported to the tax authority during demonetisation. The remainder could, for instance, reflect firms reporting higher sales in order to justify deposits of hoarded cash.
Policy implications
Overall, our results provide some optimism for policymakers seeking to expand the use of electronic payments in pursuit of improvements in tax compliance and revenue collections. However, we note several important caveats. Firstly, as mentioned above we are not able to disentangle the mechanisms behind our results, which may have different implications for policy. Second, because of data limitations our analysis focusses only on short-term impacts. While electronic payments remained more popular in West Bengal than before demonetisation, we cannot say whether the effect on tax compliance has persisted. Finally, while our results suggest that demonetisation may have had some positive impact on tax compliance, the negative economic impacts of demonetisation are well-documented (Chodorow-Reich 2019), including more severe impacts on the informal sector and poorer households (Banerjee and Kala 2017). Thus, while demonetisation provides a way to study the link between electronic sales and tax compliance, our results should not be read as suggesting that demonetisation was an effective policy.
This blog was first published by Ideas for India and is reproduced here with kind permission.
Notes:
- The administrative VAT data was shared with us by the Directorate of Commercial Taxes of West Bengal, we use electronic payments data from the National Payments Corporation of India, and the bank deposit data from the Reserve Bank of India.
- We use an identification strategy similar to the ones used in Chodorow-Reich et al. (2019) and Crouzet et al. (2019).
- Fixed effects control for time-invariant unobserved individual characteristics.
- A confidence interval is a way of expressing uncertainty about estimated effects. A 95% confidence interval, means that if you were to repeat the experiment over and over with new samples, 95% of the time the calculated confidence interval would contain the true effect.
- Instrumental variables are used in empirical analysis to address endogeneity concerns. An instrument is an additional factor that allows us to see the true causal relationship between the explanatory factor and the outcome of interest. It is correlated with the explanatory factor but does not directly affect the outcome of interest.
Almunia, M, J Hjort, J Knebelmann and L Tian (2021), ‘Strategic or Confused Firms? Evidence from “Missing" Transactions in Uganda’, NBER Working Paper No. 29059.
Awasthi, R and M Engelschalk (2018), ‘Taxation and the shadow economy: how the tax system can stimulate and enforce the formalization of business activities’, World Bank Policy Research Working Paper No. 8391.
Bachas, P, L Gadenne and A Jensen (2021), ‘Informality, Consumption Taxes, and Redistribution’, NBER Working Paper No 27429.
Banerjee, A and N Kala (2017), ‘The economic and political consequences of India's demonetisation’, Ideas for India, 26 July.
Beyer, R, E Chhabra, V Galdo and M Rama (2018), ‘Measuring districts' monthly economic activity from outer space’, World Bank Policy Research Working Paper No. 8523.
Carrillo, Paul, Dina Pomeranz and Monica Singhal (2017), “Dodging the taxman: Firm misreporting and limits to tax enforcement”, American Economic Journal: Applied Economics, 9(2): 144-64.
Chodorow-Reich, Gabriel, Gita Gopinath, Prachi Mishra and Abhinav Narayanan (2020), “Cash and the economy: Evidence from India’s demonetization”, Quarterly Journal of Economics, 135(1): 57-103.
Chodorow-Reich, G (2019), ‘Cash and the economy: Evidence from India’s demonetisation’, Ideas for India, 18 October.
Crouzet, N, A Gupta and F Mezzanotti (2019), ‘Shocks and technology adoption: Evidence from electronic payment systems’, Northwestern University Working Paper.
Das, S, L Gadenne, T Nandi and R Warwick (2022), ‘Does going cashless make you tax-rich? Evidence from India’s demonetization experiment’, IFS Working Paper No W22/03.
Demirguc-Kunt, A, L Klapper, D Singer and S Ansar (2018), The Global Findex Database 2017: Measuring financial inclusion and the fintech revolution, World Bank Publications, Washington DC.
Kleven, Henrik Jacobsen, Claus Thustrup Kreiner and Emmanuel Saez (2016), “Why can modern governments tax so much? An agency model of firms as fiscal intermediaries”, Economica, 83(330): 219-246.
Lahiri, Amartya (2020), “The Great Indian Demonetization”, Journal of Economic Perspectives, 34(1), 55-74.
OECD (2017), ‘Shining light on the shadow economy: Opportunities and threats’, Report.
Pomeranz, Dina and José Vila-Belda (2019), “Taking state-capacity research to the field: Insights from collaborations with tax authorities”, Annual Review of Economics, 11: 755-781.
Rogoff, K (2017), The curse of cash, Princeton University Press, Princeton.
Authors

Lucie Gadenne
Lucie is an Associate Director at the IFS and an Associate Professor at Queen Mary University of London.

Ross Warwick
Ross joined the IFS in 2016 and works in a couple of areas of IFS research.

Tushar Nandi
More from IFS
Understand this issue


Policy analysis


Academic research


