
Downloads

Download chapter as a PDF
PDF | 1.56 MB
UK government borrowing costs are near multi-decade highs and have risen sharply since March, making the upcoming Budget much more challenging. The UK is not an outlier since this most recent rise has been in line with that seen across similar countries, as inflation has risen and central banks have increased policy rates. The attention of the bond market is currently elsewhere, and John Healey should be trying to keep it that way.
Key findings
- UK government borrowing costs have risen further since last year’s Autumn Budget. Yields on 30-year gilts – long seen as an indicator of bond market sentiment – have risen from around 5.2% on the eve of the Spring Forecast to reach 5.9% (2 October). Over the same period, yields on 10-year gilts rose from 4.4% to 5.4%. This further increase in the cost of borrowing is an important contributor to the difficult outlook for the public finances.
- The rise in yields on UK sovereign debt over the last year have been in line with – or even slightly smaller than – the increases seen across other major economies. Whereas 30-year gilt yields have increased by around 0.6 percentage points, this compares with 0.7–1 percentage points for other comparable sovereign bonds.
- Global rises in yields mostly reflect expectations of both inflation and central bank policy rates rising and staying higher for longer, in light of the price shock from conflict in the Middle East. Market pricing implies that annual UK CPI inflation is expected to increase from just over 3% currently to 4.5% in early 2027. Inflation is expected to stay higher for longer in the UK than in the US or the Eurozone, and is not expected to return to the Bank of England’s 2% target in the near term. Market pricing also implies that central bank policy rates are expected to increase – by at least 0.75–1 percentage point over the next 12 months in the UK, the US and the Eurozone.
- The UK is no longer the focus of global bond markets, with attention now mostly on other governments, notably the US and France. The UK’s term premium – the compensation required by investors for the additional uncertainty associated with holding a longer-term bond – is elevated, but has not materially increased in the last year. This suggests that the increases in long-term UK government borrowing costs over the last year have been mainly driven by moves in central bank policy rate expectations, rather than by changes in views of the riskiness of holding UK government debt specifically.
- Expectations of UK fiscal policy have remained relatively unchanged over the last 12 months. Survey evidence suggests that market participants expect a government deficit of around 3.3% of GDP in 2027 and 2.9% in 2028, which is broadly in line with the OBR’s March forecast for borrowing.
- The UK bond market is not risk-free, but the risk of a domestic catalyst for a gilt crisis has fallen. The bond market still views the UK partly through the lens of the 2022 gilt crisis, which followed the mini-Budget. Rebuilding fiscal credibility takes time, but UK policymakers have learned lessons from 2022 and taken significant steps to improve monitoring of system-wide financial risks and leverage. The main immediate risks in the bond market are more likely to come from international markets, which could be the genesis of a crisis and are a source of uncertainty and volatility to the UK market.
- From a bond market management perspective, it would be best for the Chancellor to deliver a Budget that reaffirms the fiscal rules and has no discussion of flexibility or indications of creative fiscal accounting. For now, the focus of the bond market is on other countries, which is to the UK’s advantage. The government should try to keep it that way.
3.1 Introduction
John Healey will be delivering his first Budget against a backdrop of persistent inflation and rising bond yields across the world. The UK government faces much higher borrowing costs than many similar nations. UK government debt stands at around 90% of national income and the share of national income needed to service that debt (nearly 4%) is now twice as high as it was in the 10 years preceding the COVID-19 pandemic. The upcoming OBR forecast will revise up the debt interest bill, which, in the March forecast, was already due to reach £137 billion in 2030–31. Given these factors, maintaining the confidence of a wary bond market will be a key consideration for the Chancellor in a few weeks’ time. An adverse market reaction to the Budget would once again draw attention to the UK’s ongoing fiscal vulnerability and could overshadow the more substantive debate of policy measures in the Budget. This chapter explores the current state of the gilt market and highlights how, out of the spotlight, the gilt market is stabilising at a new equilibrium.
Section 3.2 examines market expectations for the path of inflation and central bank policy rates. Section 3.3 shows how global bond yields have changed over time, and the extent to which UK yields have moved in tandem with those of other countries. Section 3.4 examines differences in the yields of gilts of differing maturities and market expectations about government borrowing. Section 3.5 discusses the risk of bond crises, and particularly a repeat of the 2022 bond crisis, before Section 3.6 concludes.
3.2 ‘This time it’s different’ – maybe not for government bonds
‘This time it’s different’ is perhaps the most seductive but loaded phrase in the financial lexicon. Time and time again across all types of financial assets, investors assure themselves (and are assured) that history will not repeat itself. But while equity and corporate bond markets grapple with the new challenge of valuing AI-related assets, global sovereign bond markets are assessing an altogether more familiar combination of factors. As Chapter 1 describes, the conflict in the Middle East has seen oil prices and, more importantly for the UK, natural gas prices rise significantly. Across the world, high and rising inflation is underpinning a turn in the central bank cycle, and all against a backdrop of high government indebtedness.
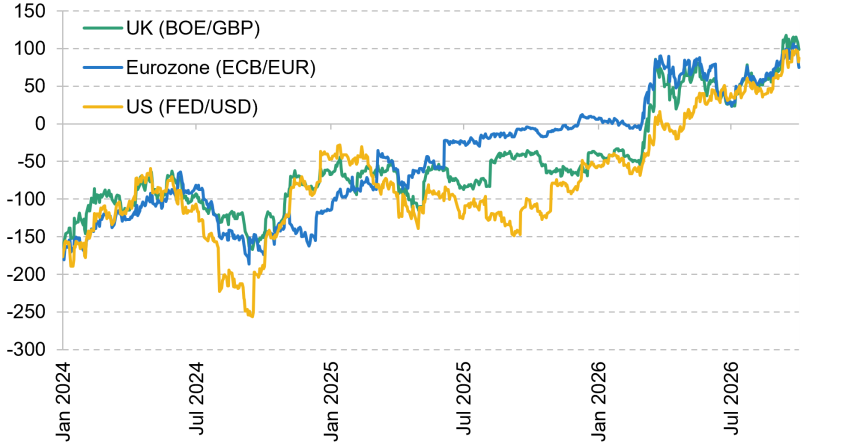
Figure 3.1 shows the spread between central banks’ key policy rates and three-month swap rates, one year ahead. These rates are a good indicator of market expectations for policy rates, to which they are closely linked. The figure shows that for the US Federal Reserve (FED), the European Central Bank (ECB) and the Bank of England (BOE), market rates imply the expectation of between 0.75 and 1 percentage point of increases in policy rates over the next 12 months.
Figure 3.1. Spread between central banks’ key policy rate and three-month swap rates, one year ahead, in selected countries (basis points)
Source: Bloomberg and Barclays Research.
Both the ECB and Federal Reserve have already responded to higher inflation by tightening monetary policy, raising their key policy rates and promising more increases should they be required. In contrast, the Bank of England has yet to raise its policy rate, but now seems likely to do so at its November meeting. The emerging view from the most recent speeches from members of the Bank’s Monetary Policy Committee (MPC) has been that the longer the conflict in the Middle East lasts, the greater the risk that second-round effects begin to show up in the wider economy. This increases the likelihood that the committee will deliver higher rates (discussed in more detail in Chapter 1).
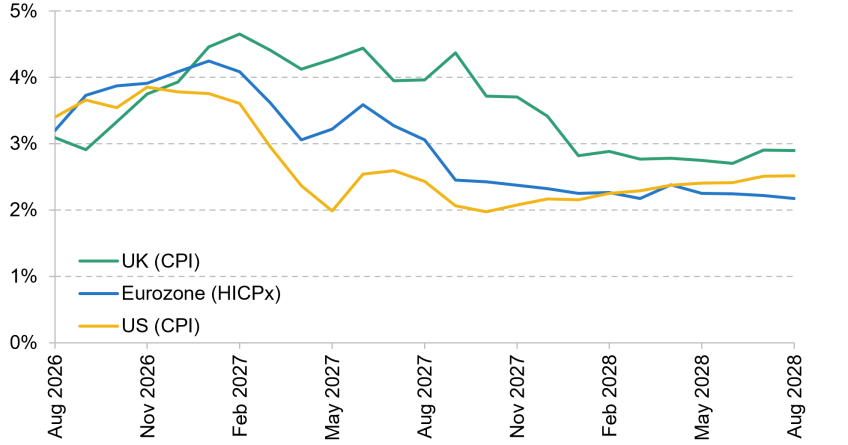
Market participants also expect inflation to keep rising.1 Figure 3.2 shows the market-implied path of annual inflation over the next two years, derived from inflation market pricing. UK CPI inflation is expected to reach 4.5% in early 2027, and is not expected to return to levels consistent with the Bank of England’s 2% target in the near term. It is notable that UK CPI inflation is expected to stay higher for longer than analogous measures of inflation in the US or Eurozone.
Figure 3.2. Market-implied path of headline inflation measure in selected countries (% year on year)
Source: Barclays Research.
3.3 Hiding in plain sight
A year ago, there was intense international scrutiny of the UK fiscal position as the then Chancellor Rachel Reeves prepared to present the government’s Budget to parliament, the UK and wider financial markets. In the last IFS Green Budget, we outlined some of the drivers and historical reasons for the UK facing such intense scrutiny, as well as explanations for why the UK term premium – the part of the gap between short-term and long-term yields that can be thought of as reflecting the extra risk of holding debt for longer – appeared to be so elevated.
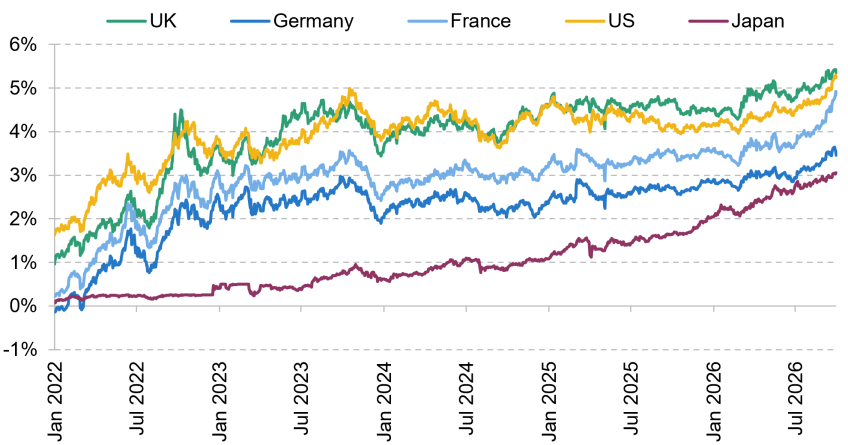
A year on, the new Chancellor John Healey is preparing his first Budget. As shown in Figure 3.3, UK government borrowing costs remain much higher than those facing other governments, with yields for 10-year bonds at 5.4%. These are up from 4.45% in November 2025, and are more than twice as high as the government faced before the 2022 gilt/LDI crisis (discussed in Section 3.5).
Figure 3.3. Yields on 10-year government bonds issued by different countries
Source: Barclays Research.
Since the last Budget was delivered, yields on long-dated UK sovereign debt have risen by around 1 and 0.6 percentage points on 10-year and 30-year gilts respectively. But the UK has not been alone in its moves. This increase has been seen globally and has been driven by the combination of higher inflation and, in response, higher central bank policy rates. Panel A of Figure 3.4 shows the path of yields for global 10-year government bonds, while Panel B shows the same for 30-year government bonds.
Figure 3.4. Cumulative change in yields on government bonds of selected countries (basis points)

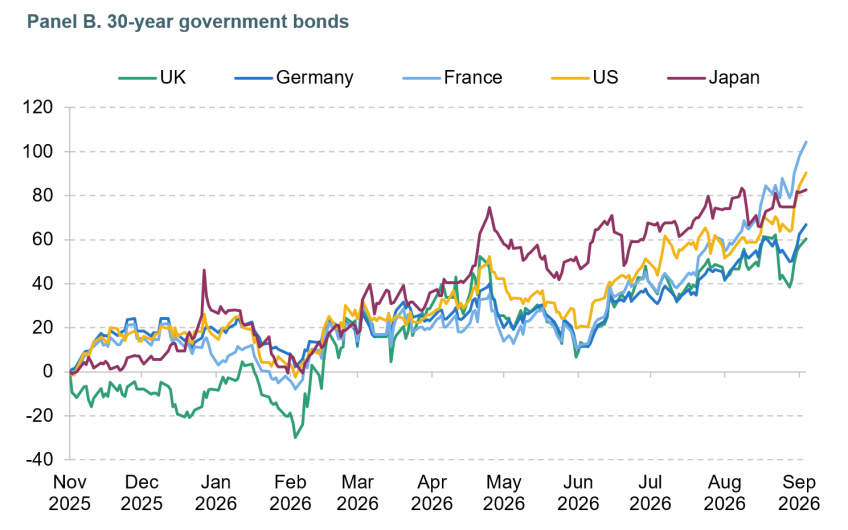
Note: Cumulative change since 25 November 2025, up to 28 September 2026. The Autumn Budget 2025 was delivered on 26 November 2025.
Source: Barclays Research.
If anything, gilts have performed more strongly than the bonds of other governments, with 10-year yields rising by around 0.9 percentage points compared with 1.0–1.4 percentage points for other markets since the last Budget. Similarly 30-year gilt yields, for so long seen as the lightning conductor for negative bond market sentiment, have increased by around 0.6 percentage points compared with 0.7–1 percentage point increases for other sovereign markets. Rather than headlines telling us that ‘gilt yields are at their highest levels since <insert year>’, headlines are now dominated by moves in other markets – most notably the US and France. The French Government bond market has come under extreme pressure recently, with developments there drawing comparisons with the Eurozone crisis of 2011–12.
One way to empirically assess whether UK gilt yields are experiencing greater pressure than the bonds of other governments is to examine how closely they move with respect to moves in other major bond markets. The relationship between the yields on a specific UK bond (e.g. a 30-year gilt) and a bond in another market (e.g. a 30-year US Treasury) is commonly referred to as a ‘beta’. This measure guides market participants as to how much they should expect gilt yields to move given a move in other core markets. A beta greater than +1 means that gilt yields have tended to move by more than yields in the comparator market. This would imply, for example, that in a sell-off, gilt yields move higher by a greater amount and thereby underperform in the sell-off.
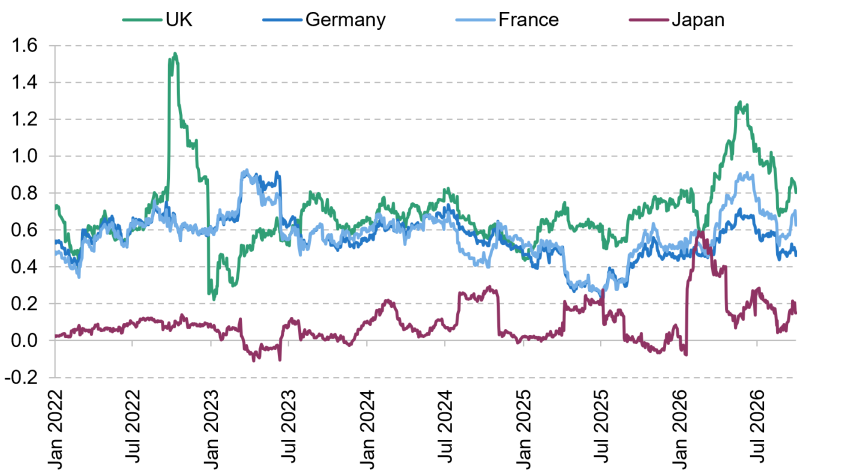
Over the last 12 months, and as shown in Figure 3.5, the betas against a range of comparators have fallen, suggesting that the UK is not coming under the pressure that we had seen in previous episodes of global fixed income discontent. Indeed, the rolling three-month beta has fallen below +1, suggesting that gilts, while retaining their directionality to broader market moves, have sold off by less than other markets. Interestingly from an investor perspective, bonds with falling betas provide a degree of ‘portfolio insurance’ as they would be outperforming other bonds in sell-offs.
Figure 3.5. Rolling 66-day average of beta between selected countries and 30-year US Treasuries
Source: Barclays Research.
Another way to assess whether gilts are coming under pressure is to consider the relationship between daily changes in 10-year US Treasury rates and 30-year gilt rates. This is shown in Panel A of Figure 3.6 for the period since the start of 2022. The 10-year US Treasury rate can be thought of as the benchmark rate in global bond markets. The long-run beta is around 0.6 – in other words, for a 0.1 percentage point increase in 10-year US Treasury rates, we would expect that 30-year gilt rates would increase by 0.06 percentage points. The measure is similar if we instead compare 30-year gilt rates with 30-year US Treasury rates, as shown by Panel B.
Figure 3.6. Daily changes in yields on 30-year gilts and …
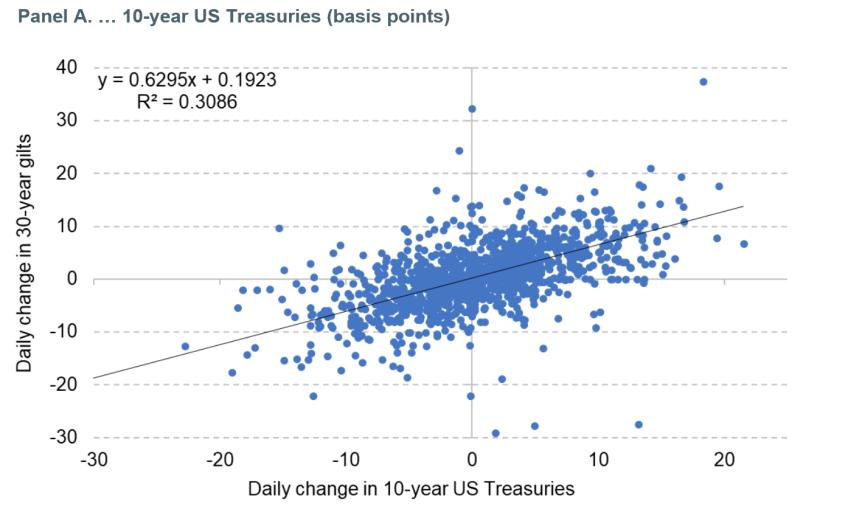
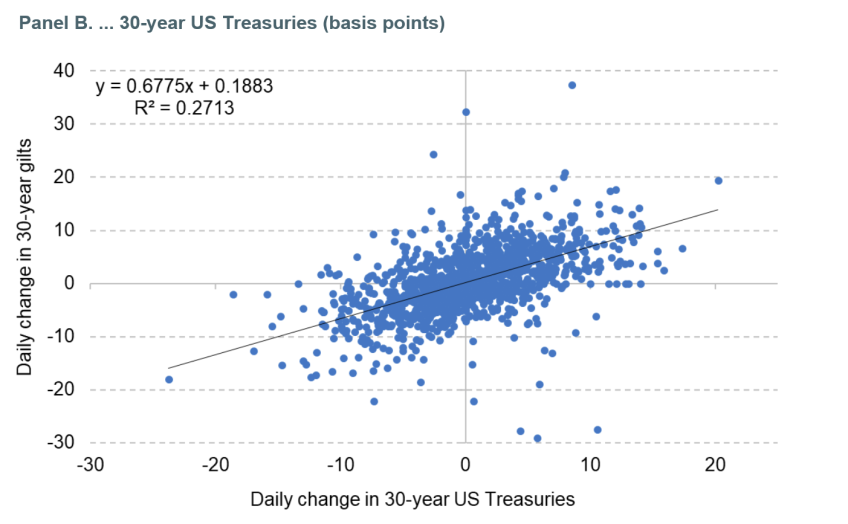
Note: Points show daily changes between 3 January 2022 and 2 October 2026 in basis points. Line shows the average linear relationship between changes in these yields over this entire period. The slope of the line represents the ‘beta’ measure.
Source: Barclays Research.
The similarity between the beta to 10- and 30-year US Treasuries is significant. It suggests that the most recent decline in the beta is bringing it back into line with its long-run value – its average over the past five years – and that most recent movements in long-dated gilt yields have largely reflected broader moves in global bond markets, rather than unusually strong upward pressure on the long end of the UK yield curve. If the beta between UK gilts and 30-year US Treasury bonds was as high and rising as it had been during the early part of 2026 (around 1.25 compared with around 1.1 for 10-year rates), this would be indicative of a rising and potentially unstable term premium at the 30-year point. In other words, the government would be facing higher and potentially more volatile longer-term borrowing costs. This in turn would suggest that markets were demanding higher compensation for the risk of lending to the UK government over longer maturities by demanding higher yields, underpinned by a rising term premium (discussed in Section 3.4). It is therefore good news that the betas associated with long-term gilts have been stable. There have recently been more substantive and volatile moves in yields at shorter maturities, but these have been due to the turn in the central bank interest rate cycle and the moves in energy prices.
3.4 The UK government is no longer the cause of global bond market volatility (for now)
A yield curve maps out the interest rates the government pays to borrow for different lengths of time – for example 5, 10 and 30 years. It illustrates how government borrowing costs vary depending on the maturity of the bonds issued and reflects both current and future expected borrowing costs. Yield curves typically slope upwards, reflecting higher borrowing costs at longer maturities. If we compare the shape of the UK yield curve with other markets, it appears steep – yields are higher on longer- than shorter-maturity gilts – but not unduly so.
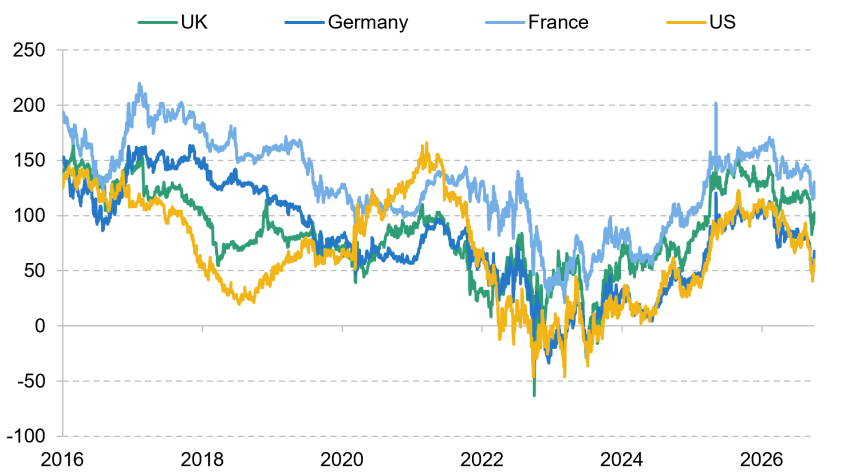
The steepness of the yield curve can be measured by the spread (the difference in yields in basis points) between 5- and 30-year bond yields. Figure 3.7 shows how these spreads have evolved over the past decade for the UK, Germany, France and the US. The spread between yields on 5-year and 30-year bonds is currently higher for the UK than for the US and Germany, but lower than for France. But it is notable that recent changes have not been out of line with moves in these other markets. A stable curve is indicative of a contained term premium (discussed in more detail below) and, implicitly, a lower expectation for underlying volatility in yields for longer-dated gilts.
Figure 3.7. Spread between 5- and 30-year bonds for selected countries (basis points)
Source: Barclays Research.
The combination of a more stable term premium and declining beta implies that gilts, rather than being a cause of volatility in the global market for government bonds, are instead mostly on the receiving end of moves in other markets. For different reasons, yields in the US and France in particular have come under bearish pressure – the US due to pressure from both higher Fed rates and the unprecedented levels of corporate borrowing to fund AI-related capital expenditure, and France due to concerns over the fiscal outlook and the upcoming presidential elections in April 2027.
The yield curve spread described above can be directly measured: it is simply the difference between yields on long- and short-term bonds. But a steeper curve can be indicative of a higher (or unstable) term premium and this must be estimated. Specifically, the term premium is an inferred measure of how much of the long-term yield reflects compensation for bearing the additional uncertainty associated with holding a longer-term bond (instead of a series of short-term bonds). Typically, the term premium is interpreted as a bigger driver of moves in longer-maturity issues (10 years and longer) than moves in shorter-maturity issues, where changing policy rate expectations are likely more important.
Figure 3.8 shows the model-estimated 10-year term premium for the US, Germany and UK. The UK term premium – while elevated – has not materially increased in the last year. This suggests the move in yields on long-term gilts over the last year was mainly driven by evolving central bank policy rate expectations, rather than by moves in the term premium component of yields.
Figure 3.8. Term premium on 10-year government bonds, selected countries

Note: US Treasuries term premium is from FRBNY ACM model.
Source: NY Fed and Barclays Research.
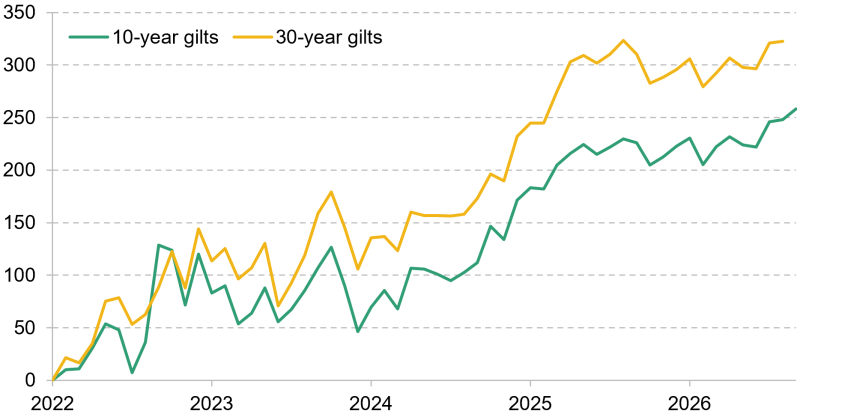
Figure 3.9 shows both the 10-year and 30-year term premium for the UK. It is notable that over 2026 so far, the move in the implied 10-year term premium has been greater than the move in the implied 30-year term premium (around +35bp versus +12bp respectively). This is consistent with the relative increase in the supply of 10-year gilts and the relative lack of 30-year gilt supply from the UK’s Debt Management Office (DMO) – the government agency that manages issuing UK gilts to the bond market. For more discussion, see last year’s Green Budget chapter on bond markets.
Figure 3.9. Cumulative change in term premium on 10- and 30-year UK gilts since January 2022 (basis points)
Source: Barclays Research.
Expectations for fiscal policy have remained relatively unchanged over the last 12 months, as captured in the Bloomberg monthly survey of economists’ forecasts for the government deficit. Expectations are that this will be around 3.3% of GDP for 2027 and 2.9% for 2028, and both of these have been at this level for much of 2026.2 They are very broadly in line with the OBR’s March forecast for borrowing. In other words, a material worsening in the UK fiscal position is not expected by survey respondents.
The UK bond market is not free of fiscal risk, but the perception of risk of a domestic catalyst for a gilt crisis has probably fallen. It is now the international market which could be the genesis of a bond crisis and which is a source of uncertainty and volatility for the UK market.
3.5 2026 is not a rerun of 2022
The most recent bout of bond market turbulence has inevitably resurrected the market’s collective memories of the events of the 2022 gilt/LDI crisis.
LDI – liability-driven investments – are strategies that UK pension funds used to structure their investments in order to efficiently hedge liabilities. They are meant to ensure that the value of their assets and future pension entitlements move in step. However, the use of leverage and repo exposed pension funds to risk if gilts moved sharply. In the mini-Budget in September 2022, Chancellor Kwasi Kwarteng announced large unfunded tax cuts that implied much higher government borrowing. Gilt yields rose sharply. Pension funds had to find cash to cover the fall in the value of gilt collateral against which they had borrowed. In order to meet margin calls, they were forced to sell gilts and this triggered a doom loop of falling values and forced selling. The Bank of England had to step in to break the spiral as it judged that the moves posed a significant financial stability risk.3
It is understandable that the shadow of the LDI crisis still looms over the gilt market and, as we are frequently reminded, ‘those who cannot remember the past are condemned to repeat it’. But it would not be correct to think that UK institutions and policymakers have ignored the lessons from that experience – in fact, quite the opposite. The amount of leverage in the pension fund sector has fallen, the Bank of England has taken steps to improve market resilience by requiring pension schemes to hold larger liquidity buffers, and contingent liquidity facilities now exist that the Bank can activate if necessary.
There is no simple definition of a bond crisis. US Supreme Court Justice Potter Stewart’s famous turn of phrase with regards to a threshold test for obscenity (‘I know it when I see it’) could easily be applied to bond market crises. A 21st century bond crisis is not necessarily characterised by uncovered auctions (auctions with insufficient demand at acceptable prices to the issuer), spiralling yields and a triumph of the ‘bond vigilantes’. Rather, if the experience of the UK in 2022 is anything to go by, it can be a more technically complex story about credibility, leverage and market structure. Crises frequently start slowly until a trigger acts as an accelerant on a transmission mechanism, requiring rapid corrective policy interventions. That trigger can be a loss of confidence in fiscal policymaking and institutional processes, or simply a liquidity event that begins a chain reaction, with leverage acting as a financial accelerant. In 2022, a key problem was the degree of hidden leverage embedded in UK LDI strategies. This leverage was the transmission mechanism, which turned a sharp sell-off following Chancellor Kwarteng’s mini-Budget into a much wider crisis.
This distinction is important because it suggests fiscal slippage (a worsening fiscal out-turn compared with forecasts or expectations) alone can be viewed as a necessary but not sufficient condition for a bond market crisis. Rather, the credibility shock of weakening or unsustainable fiscal policy becomes dangerous when it interacts with existing financial system vulnerabilities.
If we frame the LDI crisis in this way, the September 2022 gilt crisis appears to have been an idiosyncratic UK event driven by a combination of fiscal policy errors and structural vulnerabilities in the UK pension system. For policymakers, the key lesson is not that bond vigilantes are perennially poised to punish fiscally profligate governments, but that institutional credibility, hidden leverage and financial sector vulnerabilities matter enormously.
It would be a reach to think that the episode in 2022 triggered a lasting rejection of UK government debt. Discretionary appetite for gilts has remained solid. But it did give rise to an impression of fiscal vulnerability that has proven nigh on impossible to shake off. Perhaps the most important lesson is that once fiscal authorities lose the confidence of the market, regaining it is difficult and often forces policymakers into more cautious behaviour later. It means that fiscal policy becomes risk-averse, leading to possible suboptimal outcomes as choices are more driven by the need to minimise risk than by what is deemed economically optimal. Boring is good in fiscal space, but the UK could become the story again quickly.
All of this points to a backdrop in which the gilt market has been a bystander rather than shaper of moves over the last year. Conversations and market narratives are centred on the US Federal Reserve, the AI investment cycle, whether the Bank of Japan can match the Federal Reserve’s rate-hiking cycle, the outlook for French politics and fiscal policy, and other non-UK topics. UK bond yields are increasing due to expectations of higher neutral rates, a more price-sensitive buyer base for UK gilts and, to a lesser degree, the ongoing deterioration in and the myriad of risks to the health of public finances across advanced economies.
However, despite yields having been more stable over the last year, the UK still has little room for complacency. The underlying fiscal settlement remains extremely tight and, given the current fiscal rules, the new Chancellor and Prime Minister have little scope or appetite to dramatically increase borrowing or materially cut spending.
But the lack of headroom could be used as something of a ‘get out of jail free’ card by the Chancellor. He can quite reasonably point towards the lack of fiscal space as one of the key reasons to not pursue a fiscal programme that might entail large rises in government borrowing. In concert with risks around market volatility, the lack of headroom allows the government to make the argument that this is not the time for fiscal ambition but rather for fiscal discretion.
The UK could become the central character in a bond market story quickly. The market has been quick to react to what it perceives as indications of fiscal indiscipline. As an example, PM Burnham’s comments about the available ‘fiscal flexibility’ on 20 July led to immediate market moves: 30-year gilts rose 10bp to 5.75% on a day when yields on other long-dated bonds globally rose by 1–3bp. That was the market reacting to the new PM’s remarks, interpreting them as a signal that government borrowing would rise. This jump was eventually reversed, but it tells you that investors’ reflexes on UK fiscal issues are still scarred by the Truss/Kwarteng era and market sentiment can deteriorate quickly.
The UK already carries the highest borrowing costs of any G10 nation.4 That is a statement about the UK’s relative risk and reflects a combination of higher neutral rates, structurally higher inflation than its peers and the MPC’s inability since 2022 to deliver low inflation. But it does also reflect ongoing uncertainty about the direction and execution of fiscal policy and the slow rebuilding of credibility in the post-LDI-crisis era. It is easy for critics to claim that the market is ‘hostile’ to the government and it is impossible to disprove that. But it would be fair to say that the market remains concerned about the UK’s fiscal outlook. The bond market is not punishing Burnham and Healey, but it has not forgiven the events of 2022 either.
3.6 Fiscal discretion remains the better part of valour (for now)
For a new Chancellor facing an uncertain backdrop, delivering a boring Budget might well turn out to be the best outcome from a bond market management perspective. What would be ‘boring’? Reaffirming the fiscal rules and no discussion of flexibility or perception of creative fiscal accounting such as using investment through ‘PuFins’ purely as a means to circumvent the fiscal rules.5 Chancellor Healey should not give the global market a UK-specific narrative to latch onto when its focus is on Washington, Paris and Tokyo. The UK’s advantage right now is that it is being ignored and, arguably, it is the Chancellor’s job to keep it that way. The worst outcome would be a speech that was interpreted as requiring more borrowing at a moment when global yields are at multi-decade highs and the cross-market spreads are already near post-mini-Budget levels. ‘Boldness’ of this type would differentiate the UK from the global pack in the wrong direction.
Acknowledgements
This chapter has been produced as part of the IFS Green Budget 2026. It is by authors from Barclays, who have written specific chapters for the 2026 Green Budget, covering topics (the macroeconomic outlook, Asset Purchase Facility and bond market) where their expertise complements that of IFS.
The 2026 edition of the IFS Green Budget is funded by the Nuffield Foundation, Barclays and the Economic and Social Research Council (ESRC) through the Centre for Microeconomic Analysis of Public Policy (CPP). IFS is an independent Research Institute.
Endnotes
Authors

Moyeen Islam
More from IFS
Understand this issue


Policy analysis


Academic research


