
Downloads
Download chapter PDF
PDF | 1023.72 KB
Executive summary
- Spending on cash transfers for those of working age – the focus of this chapter – has generally grown in the UK, both in real terms (from an average of £1,000 per working-age adult per year in the late 1970s to £2,500 just before the pandemic (in today’s prices)) and as a share of national income. But over the period of austerity between 2010 and the pandemic, the working-age benefits bill fell both relative to national income and per person.
- The targeting of support on different demographic groups has changed radically. Over the long term, the UK’s cash transfer system has increasingly oriented itself towards pensioners and those with children. The growing priority given to support for pensioners is an important part of the backdrop behind trends in the working-age system, especially for the tight squeeze on the working-age benefits budget since 2010. In 1990–91 the basic support for a single person with no other source of income was 32% higher for those just over pension age than for those just under, but that figure has now grown to 137%. Within the working-age population, too, there have been big shifts. In 1975–76 an out-of-work lone parent with two children would get just 12% more than a couple without children in otherwise-similar circumstances, but by the eve of the pandemic they would get almost double.
- Major policy reforms over the past 25 years have repeatedly followed a pattern of encouraging people into paid work (using both carrots and sticks) – especially if they do not live with another working adult. Such work is usually part-time, and often associated with very low earnings. The tax credit expansions of the early 2000s, which offered income top-ups for low-earning households, mostly expanded support for working 16 hours per week but often implied strong financial disincentives to go further. Imposing job-search requirements on an increasingly large fraction of lone parents on out-of-work benefits did push many into employment, but essentially all of it was part-time and on weekly earnings less than the 40th percentile. The switch to universal credit – the current flagship reform of means-tested benefits in the UK – especially increases financial incentives to do so-called ‘mini-jobs’ at very low hours, and makes little difference to the incentive to shift from full- to part-time work.
- Much or all of the benefits system is a system of patches applied to problems that we have not found better ways of addressing, such as low pay, ill health and high housing costs. Hence, wider trends in the economy and society can and do radically change what is required of the benefits system. Housing trends are a leading example of factors that leave the transfer system with no easy answers. While rising rents and the shift towards private renting continue, policymakers have to either accept an ever-increasing housing benefits bill or leave a growing fraction of the low-income population highly exposed to high housing costs, or some combination. In reality, both have happened. Housing benefit spending per working-age person has risen by around 40% since the mid 1990s, and yet a growing fraction of the low-income privately renting population are spending large fractions of their income on housing.
- Transfer policy choices should in future factor in the longer-term effects to a greater extent than they have to date. In particular, recent research has shown that part-time work does much less than full-time work for career and wage progression. Hence, a drawback of incentivising some people to work part-time who would otherwise have worked full-time is that their future wages are likely to be lower than they would have been. We understand this better than we did when the UK’s tax credits system was introduced in the late 1990s, for example. The point is relevant for very live policy choices today. New research suggests that changing universal credit to incentivise employment in a way that further encourages part-time work has very different long-term impacts on wages, incomes and the government budget from doing it in a way that reduces the disincentive for full-time work.
- Compared with most developed nations, the UK’s benefit system provides little income protection against job loss. This is especially so for those on middle or high earnings, since those earnings typically buy them no additional support once they fall out of work, due to the UK’s reliance on means-tested, rather than earnings-related, payments. Families without children also have especially low earnings replacement rates, as their out-of-work benefit entitlements have barely changed in real terms for half a century while earnings have doubled. A single childless worker on average earnings in the UK can expect to receive 13% of their in-work income when they lose their job; across the OECD, the average is 55% (if they had been in work for a significant length of time). The growth of a significant in-work transfer system means that the system has shifted towards replacing lost income when a worker’s earnings decline (but they remain in work) and away from when they lose their job altogether.
- If the government wanted to strengthen the insurance it provides against job loss, there would be a number of options it could pursue without a wholesale move towards an earning-related benefits system. These options would include paying higher benefits early on in the jobless spell – perhaps by making them a function of past earnings for a limited period or by more closely linking initial entitlements to actual expenses (e.g. basing housing support on actual rent paid, and child-related support on the actual number of children in the family) – when pre-committed expenditures are especially hard to adjust.
- Imposing job-search conditions on claimants of out-of-work benefits (often known as ‘conditionality’) has become increasingly widespread. But the evidence suggests that the positive impacts of this, especially in the long term, are very arguable. Conditionality needs to be carefully justified with respect to clear goals, and carefully designed with those goals in mind. The extension of conditionality to many more single parents since 2008 has led many to move into paid work, but that work has been almost entirely part-time (fewer than 30 hours per week) and low-earning (in the bottom 40% of the overall earnings distribution). This is precisely the kind of work that tends to bring little or nothing in the way of longer-term benefits for skills, labour market attachment and wages. In combination with the fact that some lone parents have simply begun claims for health-related benefits instead (which come without the same conditions), this has meant that fiscal savings have been very minor. The jury is therefore still out on whether this kind of conditionality is achieving enough to be worth it, at least without effective schemes focused on human capital development running concurrently. Looking to the future, there is the additional issue that job-search requirements are focused on traditional employee work, and this may become increasingly outdated and hard to operationalise with continued increases in self-employment and the gig economy.
- Little is known about the impact of in-work transfers on wage levels – and so we do not know how many of the billions of pounds spent on them actually benefit the intended beneficiaries. It is entirely possible that these benefits, by encouraging people into work, allow employers to pay lower wages than they otherwise would. The available empirical evidence base on this is limited, but suggests that the effect might be significant. More evidence on this – and, crucially, on what other policies (such as the minimum wage) can help limit the unintended consequences for wages – would be extremely valuable. A very similar point applies to the impact of housing-related support on rent levels.
- Well over £10 billion of benefits goes unclaimed each year – but there is scope for changing this. Lack of information about benefits and the hassle or complexity associated with applying for them seem to be key reasons for non-take-up; the evidence on the role of stigma is thinner but what is available suggests that it is less important. Plenty of evidence suggests that simple interventions such as sending reminder letters to those who are likely to be eligible can be effective in boosting take-up, should a government want to do so. Moreover, the advent of ‘Real Time Information’ – where employers provide to HMRC frequent reports of employees’ earnings – could allow a greater role for ‘defaulting’ people into receiving benefits, or at least promptly informing them that they may be eligible. This is an area where experiments are feasible and likely to be fruitful – for example, by providing more information on the crucial issue of whether it is the neediest, or the least needy, that do not claim their entitlements, on which there is currently mixed evidence.
1. Introduction
Cash payments directly to individuals or families are a major component of most modern welfare states, alongside the provision of publicly provided services (throughout this chapter, we use the terms ‘transfers’, ‘benefits’ and ‘welfare payments’ interchangeably). The scale of their importance is easy to under-appreciate. The UK state spends more on cash transfers to those of working age (adults under state pension or retirement age) than on education, or defence and policing combined. At any point in time, more than a quarter of all working-age UK families are in receipt of means-tested benefits (Office for Budget Responsibility, 2018). And even that underplays the true reach of the system: at some point in their lives, most people will be in a household receiving a working-age means-tested benefit (Roantree and Shaw, 2018).
A system of transfers this expansive undoubtedly has large effects on the level of poverty and deprivation, and on the financial incentives that people face. But it does not stop there. For example, as we elucidate in this chapter, it probably affects the earnings and housing costs of people not even receiving the transfers (not to mention the taxes they pay), and it impacts the next generation via the children growing up in families that draw on the state safety net. In short, cash transfers are a very consequential part of our economy and our society.
All of the detailed discussion and analysis in this chapter focuses on the working-age part of the benefit system. As shown in Section 2, an even larger (and growing) portion of the welfare budget supports the living standards of those above the state pension age. Our focus on the working-age system is primarily because these two parts of the system are trying to do very different things. The labour market provides the backdrop, or at least critical context, to the workings of the working-age transfer system. Almost all of it is providing support to people in light of their not being judged to have enough to support themselves through paid work alone – including because they are judged unable to do any paid work at all due to caring responsibilities or health problems. Supporting the living standards of those in retirement is of course crucial, but not within scope of this chapter.
The term ‘cash transfers’ captures money paid to support people who cannot find, or are judged unable to do, paid work, or people who are in paid work and yet have a low income, or who have extra costs arising from children or disability or housing needs. The underlying motivations for these policies can be similarly wide-ranging: for example, preventing or reducing poverty, protecting people from adverse economic shocks (‘insurance’), pursuing ‘horizontal equity’ between people with different costs of living (e.g. due to disability or children), and promoting the life chances of children.
There are many key choices, and trade-offs, that governments face when designing and adjusting these programmes. How much are they willing to spend on them? What will be the balance between support focused on the neediest and support aimed at a broader base? Which demographic groups, or needs, will be prioritised? Will the benefits be in cash or in kind? To what extent will the level of support track people’s fluctuating circumstances in real time, stepping in quickly when needs increase, versus prioritising those in more persistent need? How are the benefits of having a simple system that is easy to understand and navigate to be balanced against the inevitable tendency towards complexity, when policy goals are multiple and the circumstances of the population widely-varying? How will support actually be delivered to people: what is the claiming process like, when does money arrive, how often is it paid, and so on?
Much of the chapter will discuss how policy choices made in the UK have changed over time and how they compare internationally, and the evidence on how these choices can shape the impacts of the system.
There are many ways in which transfer policies can fail to achieve their goals as effectively as might be hoped. For example, incomplete take-up of welfare programmes may inhibit their ability to alleviate poverty. In addition, the perhaps-successful pursuit of one goal can lead to other pitfalls that governments should, and often do, try to avoid (though some of these pitfalls reflect trade-offs that are impossible to get around entirely). For example, trying to maximise the impact of the system on reducing poverty can lead to support heavily targeted on a small group with the lowest resources; but this in turn can lead to negative behavioural effects driven by the steep phasing out of support, and demeaning or stigmatising effects of being a recipient which might themselves inhibit take-up and hence poverty alleviation as well. Of course, as with any public programme, an inadequate level of funding can also lead to a failure to achieve its goals.
One theme that runs through much of the chapter is the intricate relationship between the transfer system and the wider economic and policy environment. Much of the system is effectively applying a patch over social and economic problems that we have not yet found a better way of preventing or addressing (e.g. low pay or poor health). As the problems facing society evolve, the distribution of support provided by the transfer system, and its impacts, will tend to change – both automatically and via deliberate changes to its targeting or design. More progress in other areas of economic and social policy will typically make the transfer system’s job easier.
In broad terms, the chapter is organised in two halves. In the first half (Sections 2 to 4), we describe the UK benefit system and examine recent trends, both in policy and in the economy at large, that impact upon the role that it fulfils. In the second half (Sections 5 to 10), we turn to specific issues in benefit policymaking, summarising existing research, introducing new evidence and discussing lessons for policy.
The structure is as follows. In Section 2, as background to what follows, we describe the basic components and workings of the current UK working-age cash transfer system, and we define the scope of our chapter by distinguishing it from broader components of what one might term the ‘welfare state’. In Section 3, we set out how the role of the system has changed over time, through changes both in policy and in the wider economic and social environment. Section 4 examines the effect that the transfer system has on work incentives, both directly through the financial incentives to work, and through conditionality, sanctions and other ‘active labour market policies’. Section 5 discusses take-up of benefits, in particular who claims their entitlement and what the reasons are for non-take-up. Section 6 turns to ‘incidence’: whether, and how much, paying benefits to those in work or those renting homes can reduce their wages or increase their rent. Section 7 briefly discusses a number of implementation issues with transfer policy which are often glossed over but can be of great importance: wait times to receive the first payment, the period over which benefit entitlements are assessed, and who in a couple actually receives the transfer. Section 8 looks at intergenerational effects – how a benefit payment to a parent today might affect the education, labour market and indeed welfare outcomes for their child many years down the road. Section 9 brings together the implications of the evidence discussed for universal credit, the UK’s most important reform to the transfer system in decades, which is still underway. Section 10 discusses a number of broader policy issues and debates with implications across the benefit system. Section 11 concludes.
2. The current cash transfer system in the UK
Governments in high-income countries typically provide extensive transfers to households, not only in cash but also in kind, such as in the form of health and education provision. Much or all of that would often be considered a part of the ‘welfare state’ – a term with no hard-and-fast definition. As explained, in this chapter we restrict our focus not only to cash transfers, but also to transfers paid to those below state pension age1. As is made clear by Figure 1, this means we consider only a modest share of the total expenditure on the welfare state defined in much broader ways. Nonetheless, before the COVID-19 crisis, spending on working-age benefits was very significant, standing at around £100 billion per year or 4½% of national income.
Figure 1. ‘Welfare state’ spending, 2019–20 (in 2021–22 prices)
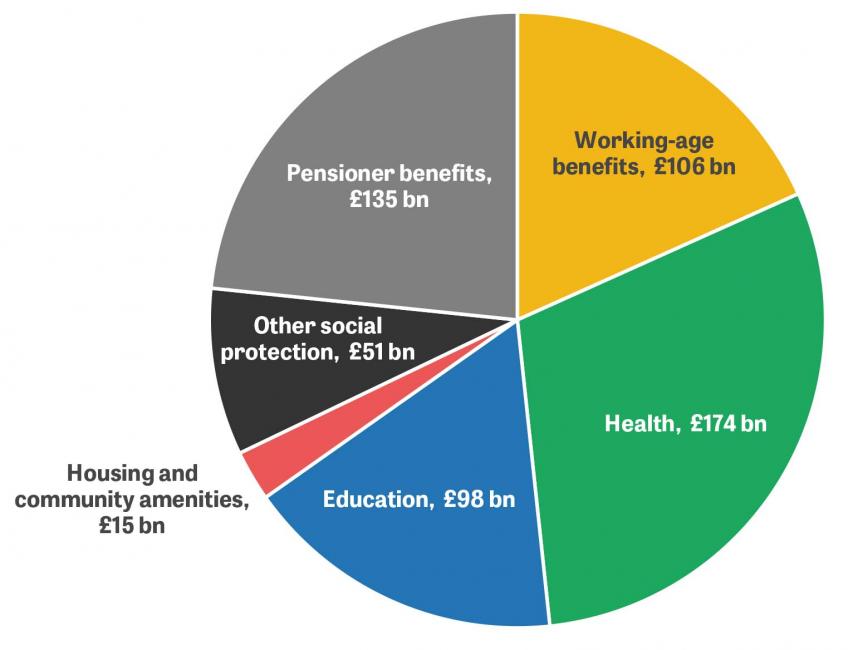
Note: We use 2019–20 expenditure here as the latest public service spending data contain significant COVID-related spending.
Source: Authors’ calculations using HM Treasury’s ‘Public expenditure statistical analyses 2019’ and DWP’s ‘Autumn Budget 2021: expenditure and caseload forecasts’.
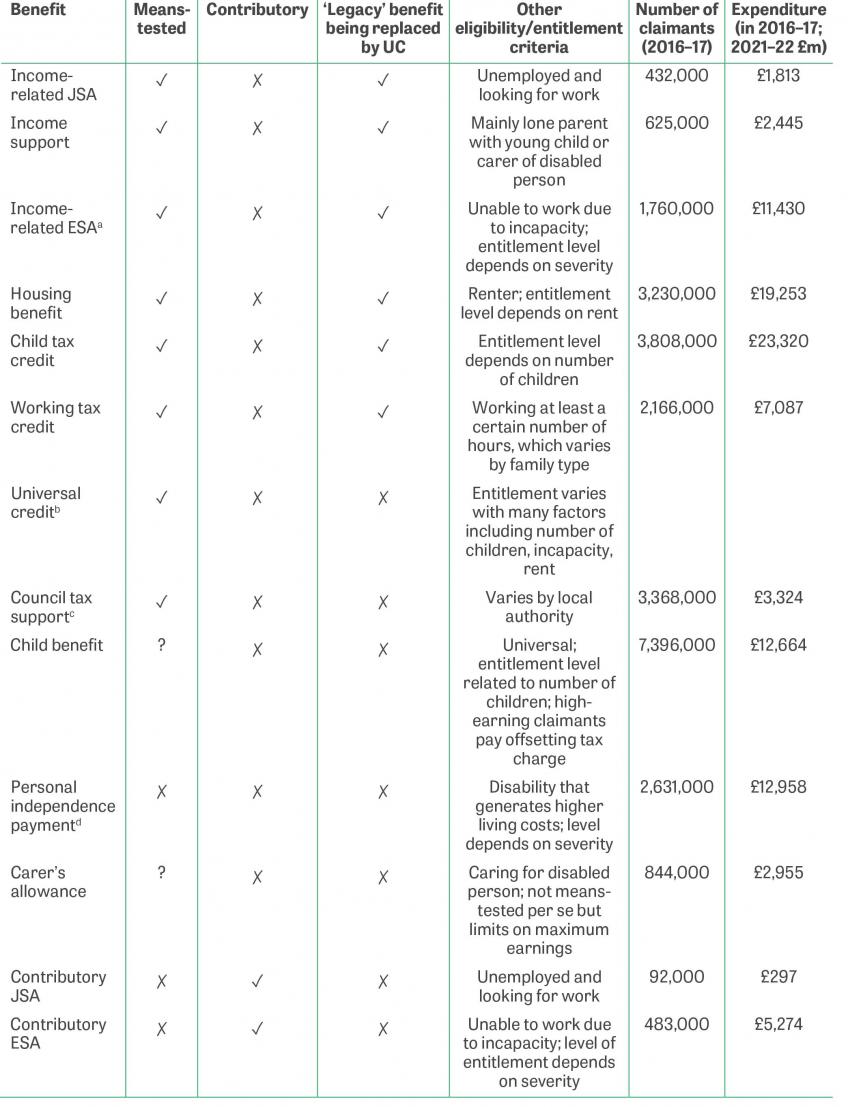
Below we give a broad sketch of the current UK working-age benefit system as it stands in 2022–23. Readers already familiar with the UK system, or wishing to skip the details, can proceed to Section 3. Table 1 provides a short summary of the various benefits2. Figure 2 shows estimates of their mechanical impacts on the rate of relative poverty to help illustrate how they are targeted (i.e. how much poverty would rise by under the thought experiment in which the benefit were abolished and nothing else changed).
All means-tested benefits are assessed at the level of (in the technical UK terminology) ‘benefit units’. These correspond to what are known as ‘tax units’ in the US, consisting of an individual, any partner they have and any dependent children. These units are often referred to using the more accessible term of ‘family’, which we will adopt here to avoid the more cumbersome, less familiar alternative terms, though clearly this does not correspond precisely to the everyday usage of the term ‘family’. For example, a single person without children is considered a ‘family’ for these purposes, and an adult who lives with their parents is not treated as part of the same family.
Table 1. Description of working-age benefits (numbers relate to 2016–17)
Notes to Table 1
a Includes incapacity benefit.
b Number of claimants and amount spent are not shown for UC, which very few people received in 2016–17. When fully rolled out, UC is expected to cost more than £60 billion per year and to be received by 7 million families at any one time.
c Number of claimants and amount spent are for 2012–13, the last year for which council tax support (then council tax benefit) was administered centrally by the Department for Work and Pensions (DWP), and thus the last year for which these data are available.
d Includes disability living allowance, including that spent on children.
Note: We use 2016–17 numbers as UC roll-out began to pick up in 2017–18, distorting the figures. See text for discussion.
Figure 2. Mechanical effect on working-age poverty rates from abolishing various working-age benefits (2016–17)
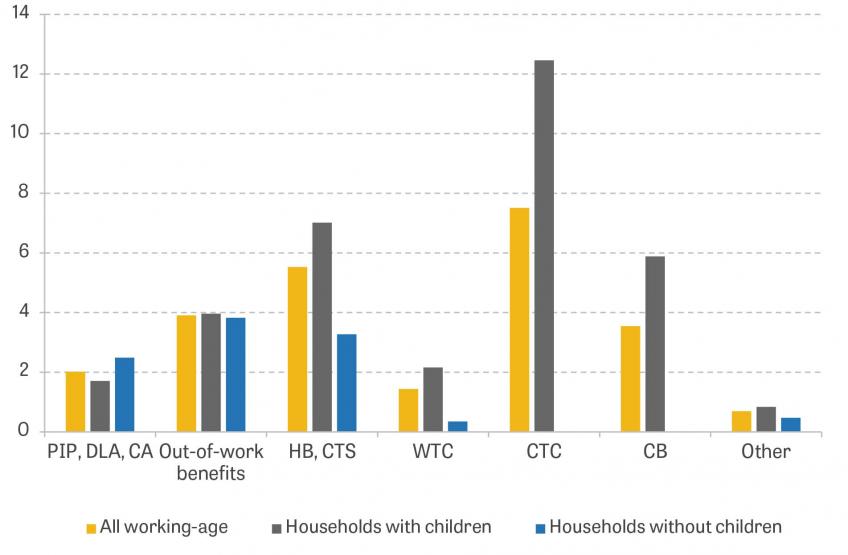
Note: The poverty line used is 60% of contemporaneous median after-housing-cost income. See text for definitions. We use 2016–17 data as they largely predate universal credit; the small amount of UC spending in that year is allocated to ‘Out-of-work benefits’. Excludes households comprised entirely of students.
Source: DWP’s ‘Households below average income statistics’, 2016–17.
‘Legacy’ benefits
‘Legacy benefits’ is the term often used to refer to those benefits that formed the bulk of the UK’s means-tested system for those of working age until they were largely replaced by a single integrated benefit, called universal credit (explained shortly) – a process that began in 2013 and is still ongoing. The complex array of support available under this system highlights the many things that the system was – and still is – trying to do. It also reflects the way in which the system has come about, with new priorities or demands from an evolving society sequentially leading to additional strands of support, or to substantial growth in existing strands of support, all layered on top of one another.
While there are still a significant number of existing claimants of these benefits, no new claims for these are generally allowed any more, and eventually these benefits will disappear entirely3. The only exceptions are the two ‘contributory’ out-of-work benefits – entitlement to which is dependent upon having ‘paid in’ to the system through work earlier in one’s life – which will continue to exist alongside universal credit (UC). Describing the legacy system remains a good starting point for understanding the basics of what kind of support the UK offers to low-income households, since the key elements of support – the out-of-work safety net, the extras for housing and children, and so on – all remain in place under the UC system, and largely at the same rates. The legacy benefits are:
- Out-of-work benefits. There are three main benefits that are specifically for individuals who are not working:
o Jobseeker’s allowance (JSA) is paid to individuals who are looking for work. There are two forms of JSA: an income-related version, which is means-tested against family income and assets, and a contributory version, which is not means-tested and is paid for six months to those who meet fairly minimal recent-work requirements. JSA claimants are generally subject to ‘conditionality’: they must prove that they are looking for work and meet regularly with their work coach in order to get the benefit. A single claimant is entitled to £77.00 per week.
o Income support (IS) is very similar to income-related JSA with identical financial entitlements, but there is no conditionality attached and it is only paid to those caring for someone with disabilities or lone parents with a young child.
o Employment and support allowance (ESA) is a benefit paid to those judged to be unable to work because of an incapacity. Like JSA, there is an income-related version which is means-tested against family income, and a contributory version which is not means-tested. Claimants are given differing entitlements based on the severity of their incapacity. Some – those assessed as being able to engage in ‘work-related activity’ – are subject to a form of conditionality, being required to do work-preparation activities such as training and CV writing. Some claimants are entitled to no more than the JSA rate (£77.00 per week for a single person), while single claimants with the most significant incapacities are entitled to £204.75 per week.
- Housing benefit (HB). This is a means-tested benefit paid to families in rented accommodation. It is means-tested against income and assets, but can be received irrespective of work status. The highest award a recipient can receive is their actual rent, though claimants renting from a private landlord are generally subject to caps (known as ‘local housing allowance’ rates), with higher caps applied to bigger families and those who live in more expensive areas. Those renting from a social landlord (e.g. councils or housing associations) are not subject to those caps, though if they live in a property deemed too large for their needs their maximum entitlement can be reduced (the so-called ‘bedroom tax’ or ‘under-occupancy charge’) which affects a substantial minority. Entitlements vary significantly with circumstances (income, assets, rent, family size, private or social sector, location), but a couple with two young children and no other income who are renting privately in an average area could be entitled to up to around £150 per week.
- Personal tax credits. Despite their name, these are unrelated to the tax system (except that they are, like most taxes and unlike most other cash transfers, administered by HMRC) and are means-tested transfer payments.
o Child tax credit (CTC) is paid to families with dependent children. Entitlements are higher for larger families (each child generating an additional £56.29 per week entitlement), though children born since April 2017 do not increase entitlements if they are the third or subsequent child in the family (the ‘two-child limit’).
o Working tax credit (WTC) is paid to families who work at least a set number of hours (16 per week for lone parents, 24 for couples with children, 30 for everyone else). A lone parent working 16 hours is entitled to up to £80.45 per week. While in principle those without children are eligible, they are entitled to relatively little and so the take-up rate among such people is quite low.
Other benefits
- Council tax support (CTS) (sometimes called council tax reduction) is a benefit tied to a claimant’s council tax bill, means-tested against family income. The design of CTS is left up to local authorities, but generally a claimant with no other income or assets can get a CTS award equal to most or all of their council tax liability. CTS is usually implemented as a reduction in the claimant’s council tax bill, rather than a separate cash payment. It is means-tested, but was – unlike other means-tested benefits – not replaced by UC. Rather, it will continue to operate as an additional means test in parallel to UC.
- Child benefit (CB) is a payment for families with dependent children. The first child in a family generates a CB entitlement of £21.80 per week; each subsequent child increases entitlements by a further £14.45 per week. For a long time, it was universal (and not taxable) among families with children. However, since 2013, families in which at least one adult has a taxable income of over £50,000 per year are subject to an additional income tax charge. This charge tops out at 100% of the family’s CB entitlement for those families where a partner has an income of over £60,000. It is thus best to think of CB as a means-tested benefit but where means-testing only kicks in from a high threshold, and where, oddly, the phase-out is in operation between £50,000 and £60,000 of the income of the highest-income parent. Note that this also implies that the phase-out rate depends on how much CB the family receives, i.e. how many children are in the family.
- Personal independence payment (PIP) is a non-means-tested, non-contributory disability benefit4. It is designed to compensate individuals for the costs associated with disabilities (such as needing help with mobility, preparing food or getting dressed). Unlike ESA, it is not related to the ability to work – PIP claimants can work without it affecting their entitlement. Entitlements vary from £24.45 to £156.90 per week depending on the assessed level of disability.
- Carer’s allowance (CA) is a benefit paid to those who provide full-time care for a disabled person. It is not means-tested against family income, although claimants are not allowed to work more than a small amount. The benefit is paid at a rate of £69.70 per week.
Universal credit
Universal credit (UC) is the UK’s new ‘integrated’ benefit, combining means-tested support previously separately provided by out-of-work benefits, means-tested benefits for families with children and means-tested benefits to help with rental costs. Eventually, UC will replace the ‘legacy’ benefit system entirely for those of working age (pensioners will still be able to receive housing benefit), though progress has been slow. Roll-out began in 2013 and is not expected to finish until at least 2028. Though there are some important exceptions (principally relating to assets and those with incapacities), families with no other income will normally get the same amount of UC as the total combined transfers they would have received under the legacy system (except for April 2020 to September 2021, when there was a temporary £20 per week increase in UC rates that was only reflected in WTC, and not out-of-work legacy benefit rates). They will also usually be subject to work-search conditionality (similar to JSA). The major difference in entitlements is among families in paid work: UC changes the rate at which benefits are withdrawn against earnings and, unlike WTC, does not have ‘hours rules’ which predicate entitlement on the number of hours worked. We explain how UC changes entitlements for working families in greater detail later in this section.
The government implemented other important changes to the operation and administration of benefits as part of the UC reforms, including the rather infamous ‘five-week wait’ between a claimant making an application and receiving their first UC payment. We discuss these issues, and particularly the five-week wait, in more detail in Section 7.
Figure 3. Weekly income for an example lone parent renter with two children earning the National Living Wage
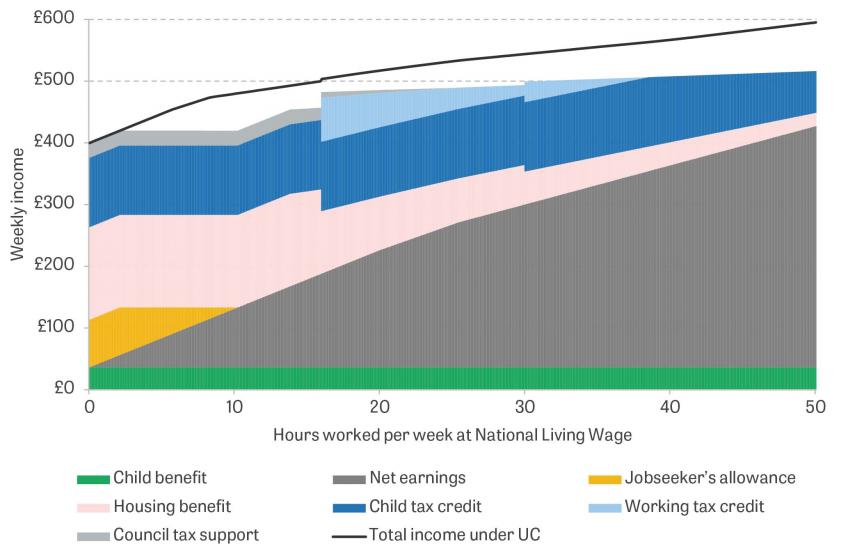
Note: April 2022 tax and benefit system. Example is for a family where both children are under 5 and rent is £150 per week. Family lives in a band C council tax property in a local authority with the national average council tax rate and a council tax support scheme that, for lone parents, rebates 100% of council tax for a family with no income and applies a 20% taper rate for those with income above a certain threshold. Council tax itself is not included (i.e. it would have to be paid out of the weekly income shown). ‘Net earnings’ shows gross earnings minus income tax and National Insurance contributions. ‘Total income under UC’ is universal credit plus net earnings, child benefit and council tax support.
Source: Authors’ calculations using TAXBEN, the IFS tax and benefit microsimulation model.
To give a sense of how UC changes the system, Figure 3 shows benefit entitlements and net earnings for an example lone parent of two children who lives in rented accommodation and is paid the National Living Wage (£9.50 per hour in 2022–23). Legacy benefits, child benefit, council tax support and net earnings (earnings after tax) are shown as stacked areas, meaning that the sum of those areas is the worker’s total net income under the legacy system. Their income under the UC system (net earnings plus UC, child benefit and council tax support) is shown as a line. Under the legacy system, the lone parent has to claim five benefits to get their full entitlement when out of work. As they increase their hours, JSA is quickly withdrawn. When they get to working 16 hours, they become entitled to WTC. This means that the incentives to work at least 16 hours, rather than slightly less, are strong. Increasing hours beyond 16 results in their HB, council tax support and WTC (then CTC) being simultaneously withdrawn, implying a high marginal effective tax rate. In fact, as shown in Figure 4, once income tax and National Insurance contributions are included, it is not uncommon for lone parents to face a marginal effective tax rate of 96% (that is, 96p is lost in higher taxes and lower benefits if an additional £1 is earned).
Under the UC system, things are broadly the same in financial terms when the individual is out of work (although note that, other than child benefit, they now only need to make one benefit claim to receive their full entitlement, with potential implications for take-up, as discussed in Section 5). Above an earnings allowance (the ‘work allowance’), their UC entitlement is steadily withdrawn by 55p for every £1 of net (post-tax) earnings. But, as shown by Figure 4, once we account for tax and the withdrawal of CTS on top, the marginal effective tax rate can still reach 76% – lower than in the legacy system, but high, as discussed in the accompanying commentary by Moffitt (2023). Unlike WTC, UC entitlement is not dependent on working a precise number of hours (though those earning very little sometimes have to fulfil job-search conditionality requirements under UC), so there is no particular incentive to work 16 or more hours, for example. In comparison with the legacy system, UC therefore less strongly disincentivises so-called ‘mini-jobs’ of under 16 hours per week. It also reduces the worker’s effective marginal tax rate – whereas under the legacy system they saw both their HB and WTC (or CTC) withdrawn simultaneously, under UC that benefit alone is being withdrawn at a single rate. For this reason, working renters tend to gain from the switch to UC (Brewer, Joyce et al., 2019). This follows fairly directly from the fact that UC integrates strands of support that separately applied means tests to low-income workers and to renters – collapsing two phase-outs into one for those who are both low-income workers and renters.
Figure 4. Amount lost in increased taxes and withdrawn benefits when earnings increase by £1, for the example lone parent in Figure 3 when working 30 hours per week
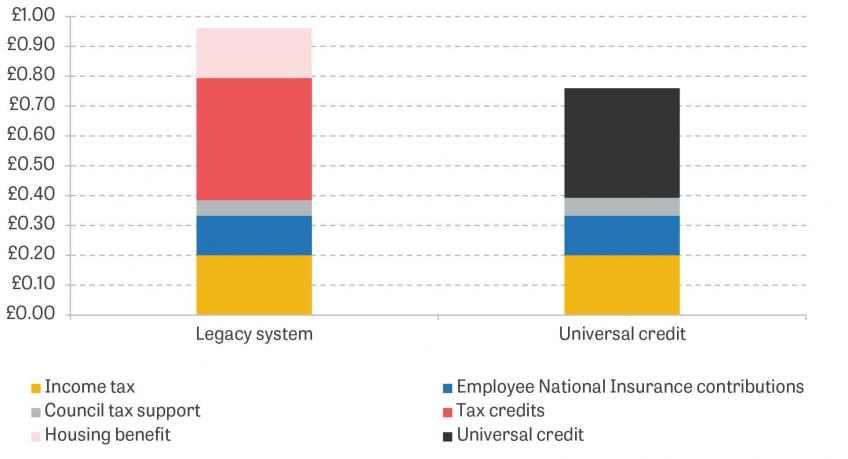
Note: See Figure 3.
Source: Authors’ calculations.
Figure 5 shows incomes for an otherwise-identical lone parent who owns their own home. Because they are not a renter, they are not eligible for HB or the housing element of UC, meaning that their entitlements are quite a bit lower. This also causes a key difference in how they are treated by UC. Under the legacy system, they only see their tax credits (WTC first, then CTC) withdrawn as they increase their hours above 16 – meaning that their effective marginal tax rate is lower than that for the renting lone parent. But under UC, they face the same effective marginal tax rate as the renter because UC has a single withdrawal rate for homeowners and renters alike (though homeowners get a somewhat higher work allowance). Because of this, working homeowners tend to lose from the switch to UC and face higher effective tax rates than under the legacy system (Brewer, Joyce et al., 2019).
Figure 5. Weekly income for an example lone parent homeowner with two children earning the National Living Wage
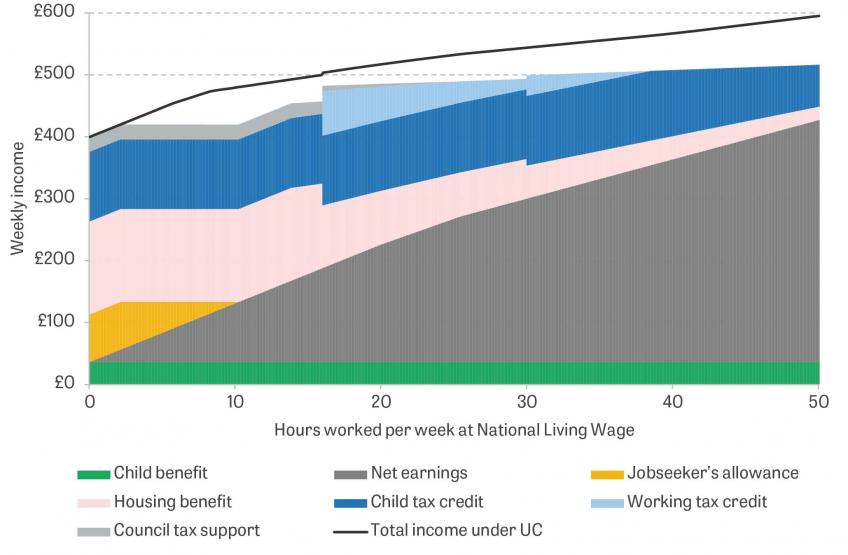
Note: Example family is as in Figure 3, except they own their own home rather than rent.
Source: Authors’ calculations using TAXBEN, the IFS tax and benefit microsimulation model.
These examples have focused on a lone parent, and things would look similar if we examined couples with children. However, those without children are generally entitled to little in work, especially under the legacy system. In principle, they could get WTC if they worked 30 hours per week. But a worker without children working 30 hours per week at the National Living Wage earns enough that, when the WTC means-test is applied, they are ineligible anyway – so only a low-earning self-employed worker, with an implicit hourly wage below the National Living Wage, would be eligible5. If their rent were, say, £100 per week, they would also have seen their HB tapered to zero. Because UC distributes more to renters and does not have hours rules, it is easier for single people without children to receive some support in work, though the sums remain relatively small.
Application and payment
To claim, benefits claimants typically fill in forms and provide evidence to prove that their circumstances are as they state (e.g. payslips to show their earnings). They are required to provide differing sorts of information depending upon the benefit in question. For example, an application for housing benefit requires the claimant to give their rent level, since their entitlement is related to their rent. For this reason, the means-tested benefits tend to require more information than the non-means-tested ones, since the government needs to collect information on different sources of income and sometimes assets. Under the legacy benefits system, claims were often made on paper forms. Applications for universal credit are generally made online (a feature that became extremely useful during the pandemic, when a huge volume of new claims needed to be processed during a time of social distancing), though those without access to the internet can apply over the phone.
Claimants to disability or incapacity benefits typically need to have their condition assessed before they can receive the benefit. The assessor then makes a determination as to whether the condition prevents the claimant from working (incapacity benefits) or means that they have difficulty with doing everyday tasks (disability benefits). These decisions can be appealed by the claimant, sometimes more than once. Of ‘work capability assessments’ for ESA that do not result in the claimant being awarded the highest level of eligibility, 30% are appealed once (called a ‘mandatory reconsideration’) and 8% are appealed twice6.
Benefit payments are generally made into the bank account of the claimant. One important exception is housing benefit, which is often paid directly to the landlord, especially for tenants in social housing – though this option is generally not available under UC. Payment frequency varies between benefits; under the legacy system, a claimant could receive JSA weekly or fortnightly, while tax credits were usually paid four-weekly. Under UC, there is a single payment frequency of a month. This change can have important consequences, a point we discuss in Section 7.
The fact that so much of the UK’s system is either means-tested (as discussed more fully below) or health-related means that the role of assessment and/or judgement in determining who gets what is relatively large. This is a corollary of having a targeted system that is clearly trying to siphon support to those it deems most in need, though it also opens the door to some of the pitfalls of welfare policymaking when it comes to the well-being of those trying to navigate the system and the reliability with which the intended recipients of support actually get it. This is discussed elsewhere in the chapter, and in much greater depth in the accompanying commentary by Patrick (2023).
Means-testing
One feature that stands out from the short description of the working-age transfers system given above is that it is overwhelmingly a means-tested system: entitlements are focused on those with low current financial resources relative to (proxies for) needs, and are mostly independent of past circumstances. In fact, in 2019–20 62% of benefit expenditure was on means-tested benefits. In Section 3, we describe how the UK got to that point and show that, while this is a common way to design cash transfers, it has not always dominated the UK system as it does now, and nor are other countries’ systems typically so dominated by it. In fact, almost every other country in the OECD has some ‘contributory’ benefit system, where those who have ‘paid in’ more during working life get higher benefit entitlements in the early phase of unemployment. Two associated commentaries (Crafts, 2023; Timmins, 2023) discuss some of those issues in considerably more depth.
Of course, the switch to universal credit does not (despite the potentially misleading term ‘universal’) get us away from any of the main trade-offs associated with means-tested forms of support. These have been noted, and agonised over, for many decades (see the Beveridge Report (Beveridge, 1942), Dilnot, Kay and Morris (1984), the Mirrlees Review (Mirrlees et al., 2011) and Moffitt (2023)) – but before proceeding to the rest of the chapter, it is worth recapitulating them very briefly. A classic trade-off is achieving redistribution versus not dampening work incentives. This can be seen in Figure 6, which shows gross earnings and net income (after taxes and benefits) for an example household (a single parent renter with two children, who can earn £15 per hour). If they work few hours – and therefore have low earnings – the tax and benefit system attempts to shield them from the very lowest living standards by redistributing to them. If they work and earn more, the extent of redistribution – as measured by the gap between the two lines – falls, and at around the point when they move to full-time work the system takes more away in taxes than it gives back in benefits. In broad terms, then, this sort of structure takes from higher-income families and gives to poorer ones. This inevitably distorts work incentives. In the absence of a tax and benefit system, if they worked one more hour they would receive an extra £15. But with the tax and benefit system, they generally receive less than that – in fact, above about 12 hours of work, an extra hour only increases their net income by roughly £47. If the value they place on an extra hour of time off work is more than £4 but less than £15, then their decisions have been distorted: without the tax and benefit system, they could work another hour and be better off (since they value that time at less than what they would be paid). But the incentives created by the tax and benefit system, and in particular the consumption floor with benefits available at zero hours of work, prevent this from happening.
Figure 6. Gross earnings and net income for an example household
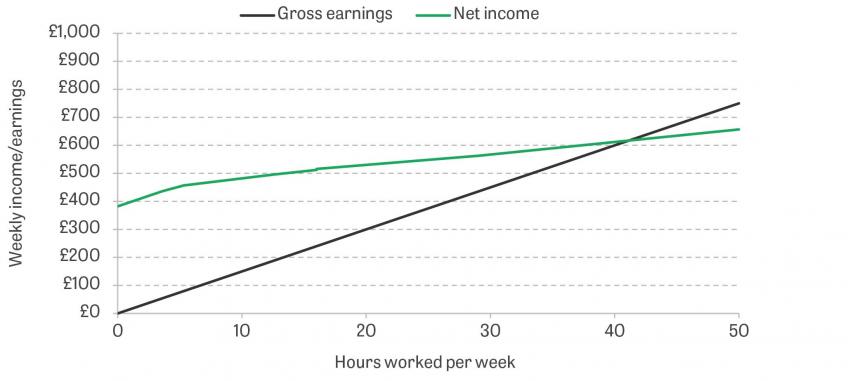
Note: Example household is a lone parent with two children aged under 5, who earns £15 per hour, lives in a band D council tax property in an area with average council tax, is a social renter and has a rent of £150 per week. Net income is calculated using the April 2022 tax and benefit system. Net income is equal to gross earnings minus income tax, employee National Insurance contributions and council tax, plus universal credit, child benefit and council tax support.
Source: Authors’ calculations using TAXBEN, the IFS tax and benefit microsimulation model.
Providing households with insurance against shocks to their income is typically at tension with protecting their financial incentives to work, for very similar reasons to those for why redistribution and work incentives are at tension: if the benefits system reduces the difference in an individual’s income between a situation where they earn little and a situation where they earn a lot, it simultaneously provides them with insurance against low earnings and weakens their financial incentive to earn more.
The trade-off between redistribution or insurance and work incentives is inherent within means-testing – though the extent to which people’s choices are actually affected by those incentives is an empirical question, and one that we cover in Section 4. But there are other features (or, perhaps more aptly, bugs) that have a tendency to come with means-testing too, and hence which are also a key part of the discussion of the UK’s welfare system. These include social stigma, the hassle and informational requirements of claiming, and the ‘relational’ inequality that might result when entitlement to support depends on the judgement of the government or bureaucrats about what someone ‘needs’ or whether someone is doing what is required of them (see Patrick (2023)). In turn these factors may affect how much of the means-tested entitlement is actually claimed and hence its ability to support people as intended.
As well as affecting incentives and insurance, the existence of means-testing of course directly determines whether poor or rich households receive transfers. Figure 7 shows the average receipt per household of different transfers across the income distribution. In general, poorer households receive much more than richer ones. This is true overall, and for each individual category of benefit (except for ‘other’). The one nuance to that story is that the lowest-income decile receive less than the second. This is partly because some people are entitled to benefits due to having little or no other income, and yet they do not claim them, and this tends to put precisely such households at the very bottom of the income distribution; in addition, survey respondents under-reporting the benefits they receive will tend to have the same effect. There are also those with a low income who are not entitled to much in terms of benefits, such as those with a significant amount of assets who are out of work.
Figure 7. Average annualised receipt per working-age household across the income distribution
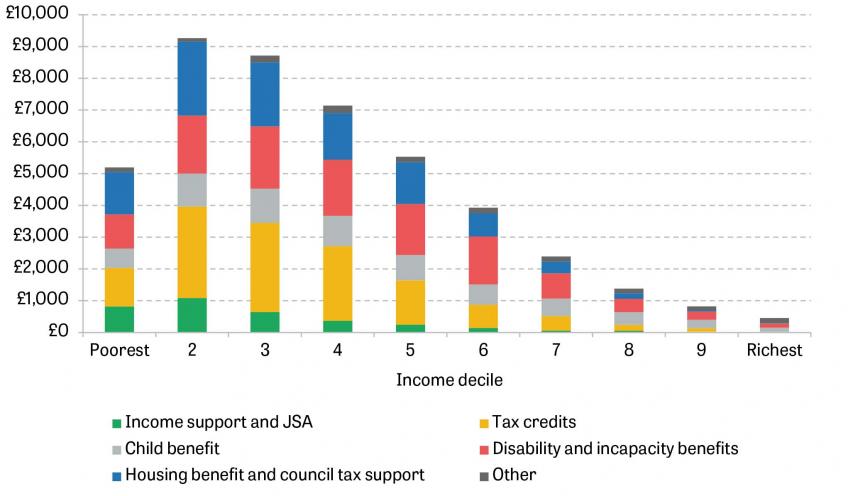
Note: Income deciles are calculated using equivalised household income, at the individual level. Universal Credit is categorised as ‘Income support and JSA’. Benefit receipt is usually measured at a weekly, fortnightly, four-weekly or monthly level; the figure shows the annualised equivalent. Households are ranked into deciles using the whole population; averages are taken among working-age households only.
Source: DWP’s ‘Households below average income statistics’ 2016–17 data, in 2021–22 prices.
3. How has the role of the system changed over time?
In this section, we examine how the role and design of the cash transfer system have shifted over time, thanks to both policy reforms and wider changes in the UK’s economy and society. In general when documenting longer-run trends at a high level, we examine the period since the mid 1970s, over which we have comprehensive administrative data on benefits. When looking in more detail at the drivers of trends and how they relate to policy, where we typically need to use the additional information provided by survey data, we focus our attention on the mid 1990s onwards, as the Family Resources Survey – used for much of this analysis – began in 1994–95. We often stop our analysis at 2019–20 to abstract from temporary distortions resulting from the pandemic, though where data sources go up to 2022–23, we include those years.
The net effect of the changes in the system and the wider economy is summarised by Figure 8, which decomposes real per-capita working-age benefit spending according to its ‘purpose’8. We plot the cost of housing programmes as well as the cost of programmes to support claimants with disabilities. The remaining benefits bill is divided according to whether the recipient family has children and contains at least one adult in paid work. Between 1978–79 and 2016–17, the vast majority of the growth in spending has come from three broad areas: housing benefits (in yellow on the figure); health-related (disability, incapacity and carers’) benefits (in green); and other benefits for working families with children (principally tax credits and their forebears, and child benefit; in light grey).
As already hinted, these patterns are driven both by changes in the economy and wider society, and by explicit policy reforms – which themselves are often in response to those economic and social changes. Even over just the past 25 years or so, which is the focus of most of our discussion, families’ circumstances have changed quite dramatically – particularly their working patterns and housing.
Figure 8. Working-age benefit spending (2021–22 prices) per capita
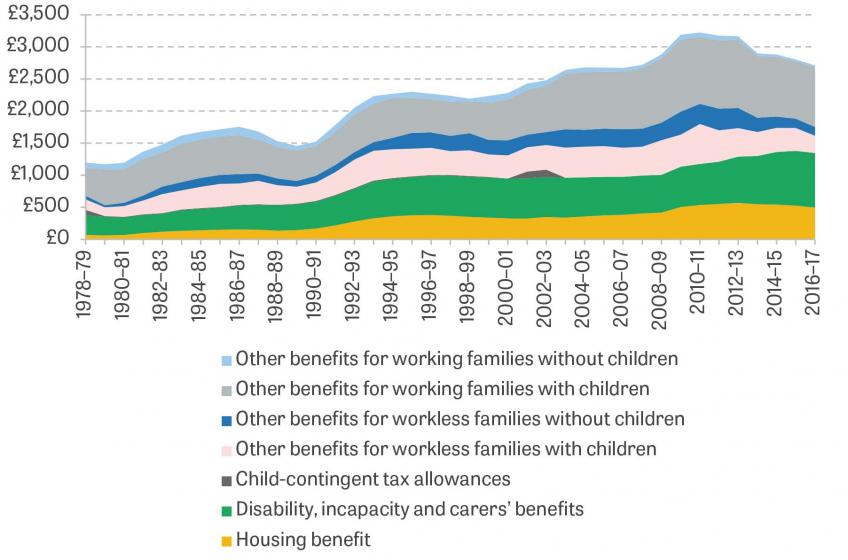
Note: Universal credit is treated as an ‘other benefit’, though some of the expenditure is to cover housing costs or to support carers or those with an incapacity. ‘Child-contingent tax allowances’ are any reductions in income tax liability induced by the presence of children, and include child tax allowances, the additional personal allowance, and children’s tax credit. There are no such allowances from 2003–04 onwards. We include data only up to 2016–17, as after that the increasing prevalence of universal credit makes it difficult to examine trends in spending by purpose.
Source: Authors’ calculations using DWP, ‘Benefit expenditure and caseload tables, Autumn Budget 2021’; TAXBEN, the IFS tax and benefit microsimulation model; Family Resources Survey, 1994–95 to 2016–17; and Family Expenditure Survey, 1978 to 1993.
Pensioners and working-age adults
The core focus of this chapter is on the working-age benefit system, but it is worth briefly discussing the way in which its size has changed relative to the system for pensioners.
As shown in Figure 9, the total working-age benefit bill has generally grown over time, although not without exception. Real spending per working-age adult rose from around £1,200 per year in the late 1970s to £3,200 in 2010–11, before falling back to £2,500 just before the pandemic. By contrast, pensioner spending has steadily risen, including during the 2010s. On the eve of the pandemic, the working-age benefit bill made up 4.3% of national income, while the pensioner bill accounted for 5.5%. That 1.2 percentage point gap is around the highest since comparable records began in 1978–79, and has steadily grown since the mid 1990s. This partly reflects the ageing population, but also policy change – over the past decade or so there have been significant cuts to the working-age benefit system, while pensioner benefits were largely protected or increased.
Figure 9. Benefit expenditure per capita (2021–22 prices)
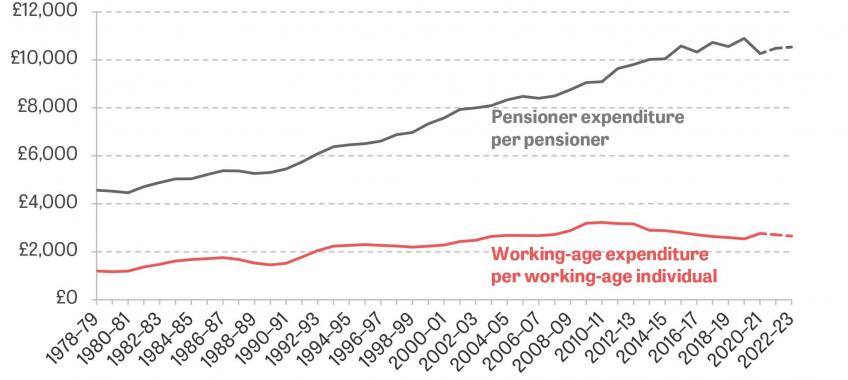
Note: For this figure, ‘working-age’ is defined as being under the female state pension age (even for men) and ‘pensioner’ is defined as being above it – this is how the administrative data are presented, as the female state pension age is when historically both men and women have become eligible for means-tested pensioner benefits. Figures for 2021–22 and 2022–23 are projections.
Source: Authors’ calculations using DWP’s ‘Benefit expenditure and caseload tables, Autumn Budget 2021’ and ONS’s ‘Population estimates for the UK and constituent countries by sex and age’.
As a consequence of these changes, the basic support for a single person with no other source of income is now 137% higher for those just over pension age than for those just under it. Back in 1990–91, that figure was 32%. Hence, while this chapter discusses the design of working-age cash transfers, the priority given to transfers made in the working-age portion of life versus those made during retirement is itself an important choice, and has in recent years helped shape the austere context within which working-age transfer policy is made.
Indeed, the current policy of increasing the state pension (the main – now almost universal – state transfer to pensioners; broadly the UK’s equivalent of the US’s Social Security) each year by the highest of inflation, earnings growth and 2.5% (a policy known as the ‘triple lock’) may well also cause a significant intergenerational transfer: in the limit, this policy is not sustainable (it implies pensions becoming an ever-increasing share of national income), and it is possible that the population currently of working age will not all end up benefiting in full from the same generosity.
Working and workless families
There have been significant changes in household employment over recent decades, as well as a shift in how policy treats household employment.
An important factor here is the rising rate of female employment (from 53% in 1971 to 63% in the mid 1990s to 73% on the eve of the pandemic). A particularly pertinent shift from the point of view of the transfer system has been a sharply increasing employment rate among lone parents (the vast majority of whom are mothers), which, as Figure 10 shows, has almost doubled from 38% in 1994–95 to 67% in 2019–20. Among couples, the proportion in which neither partner is in paid work has halved over the same period, from 11% to 5%. Together these changes have led to a declining rate of household worklessness. Moreover, the rising female employment rate – combined with little change in the male employment rate – has also meant that the share of couples in which both partners work has steadily increased.
Figure 10. Work status of working-age families
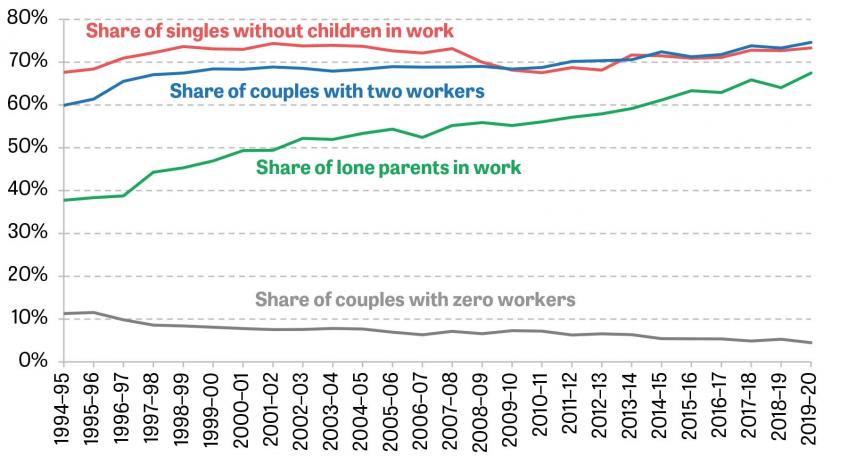
Note: Excludes families entirely comprised of full-time students.
Source: Authors’ calculations using the Family Resources Survey, 1994–95 to 2019–20.
Table 2. Real benefit spending per household per year (2021–22 prices), split by household gross earnings as a share of the relative poverty line
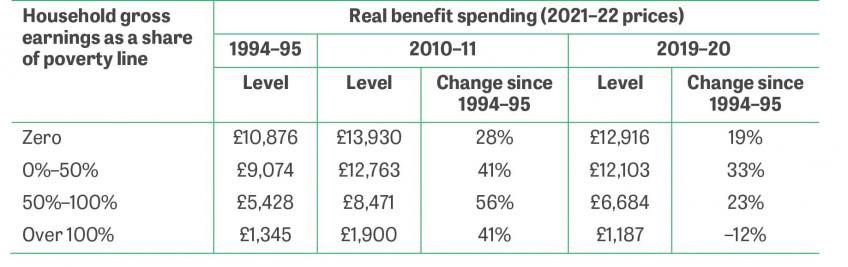
Note: ‘Earnings 0%–50% of poverty line’ only includes those with strictly positive earnings. Excludes households comprised entirely of students.
Source: Authors’ calculations using Households Below Average Income, 1994–95 to 2019–20.
A rising share of families with someone in paid work automatically tends to mean a rising share of transfers supporting families with someone in paid work (from 31% in 1994–95 to 48% in 2019–20). But there have also been deliberate shifts in policy which reinforce that pattern, especially through tax credits. This can be seen in Table 2, which takes broadly representative survey data on the income sources of UK households, groups households according to what fraction of the (relative) poverty line their gross (i.e. pre-tax-and-transfer) earnings make up, and shows mean real benefit receipt for each group – in three selected years. Over the past 25 years, benefits for families in work with low earnings have climbed faster than for other groups – both those out of work and those on higher earnings levels. Benefits in families with gross earnings exceeding the poverty line have declined in real terms by 38% since 2010–11 – a consequence of the more aggressive means-testing of benefits that reach high up the distribution that we describe at the end of this section.
One corollary of shifting support more towards working families on low earnings is that families have greater financial incentives to have someone in work. Indeed, this was always one of the major goals of the expansion of tax credits, and the next subsection elucidates further the work incentive effects. It is worth noting that the goal of encouraging paid work more through the welfare system has also been pursued through non-financial means, with strengthened use of job-search requirements (‘conditionality’). There is good evidence that these policy changes have themselves been partly responsible for changes in employment patterns. In particular, tax credit reforms in the early 2000s increased employment among lone parents (by around 5 percentage points (Brewer et al., 2006))9, as did the expanded use of job-search conditionality from 2008 (Avram, Brewer and Salvatori, 2018; Codreanu and Waters, 2023).
A consequence of focusing more on (means-tested) in-work support is that the transfer system provides a good deal of insurance against a decline in earnings for those who remain in work (since, if the worker is on benefits, the earnings loss is to a significant extent replaced by higher in-work transfers). Conversely, as the out-of-work safety net has not kept pace with growth in earnings, the system now provides less insurance against employment loss than it used to. This is compounded by the lack of earnings-related benefits in the UK, particularly for those not on the lowest earnings – having previously been in a mid- or high-earning job typically does not buy additional support upon job loss, unlike in many other countries. Families without children have especially low earnings replacement rates, as their out-of-work benefit entitlements have barely changed in real terms for half a century while earnings have doubled. Bourquin and Waters (2020) show that a single childless worker on average earnings in the UK can expect to receive 13% of their in-work income when they lose their job; across the OECD, the average is 55% (if they had been in work for the past 21 years).
The growth of in-work benefits has had profound consequences for the distribution of income. Figure 11 shows changes in the distribution of household earnings before taxes and benefits, and after tax and benefit net income, between 1994–95 and 2019–20 for working households. (Note that a larger share of households were working in 2019–20 than in 1994–95.10) Inequality in gross earnings before tax and benefits has clearly risen. Earnings at the 10th percentile grew by an average of 0.6% per year over the period, compared with 1.2% at the median and higher still above the 90th percentile. But once we account for taxes and benefits – i.e. move from the green to the yellow line – the change in income among the bottom 90% or so is almost completely flat. In other words, in-work benefits have (outside the top 10%) completely offset the increase in earnings inequality among those households with someone in paid work. As Cribb, Joyce and Wernham (2022) show, the opposite has happened if we focus specifically on the austerity period since 2011, when the transfer system has been cut back (see final subsection of this section).
Figure 11. Annual growth in household gross earnings and net income, by percentile, 1994–95 to 2019–20
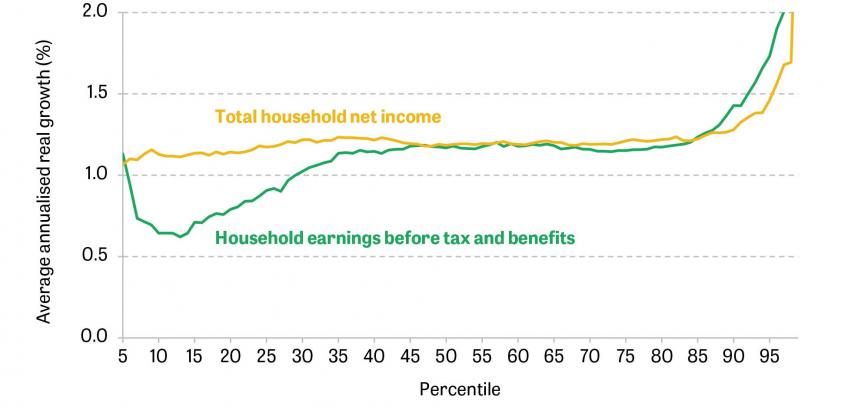
Source: Cribb, Joyce and Wernham, 2022.
Figure 12. Share of people who support higher or lower benefit spending on different demographic groups
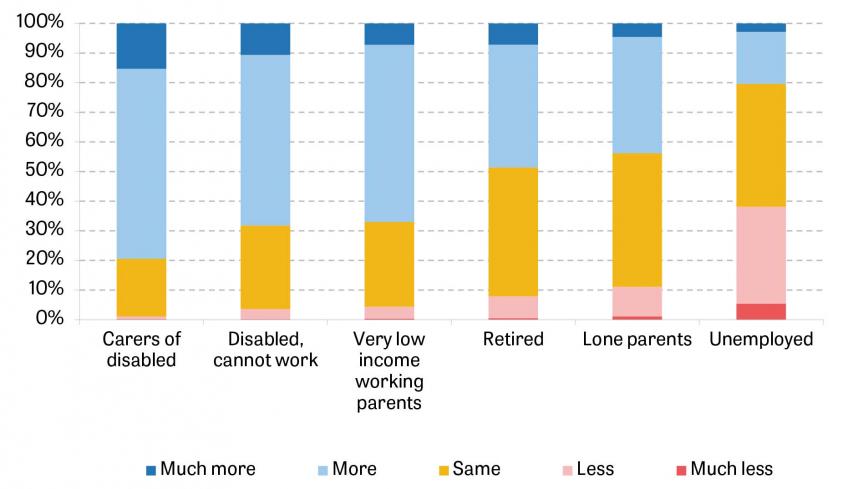
Note: Question asks ‘Would you like to see more or less government spending than now on benefits for …’. Those who refused to answer the question or stated ‘don’t know’ are excluded.
Source: Authors’ calculations using British Social Attitudes Survey 2017.
Perhaps part of the explanation for the little change seen in basic out-of-work benefits, alongside the expansion of in-work support, is the political preferences of voters. Figure 12 shows the shares of the population who support more or less benefit spending on different demographic groups (in 2017 – the latest time these questions were asked). The groups with the greatest support for more spending are the disabled and their carers. But there is also a high degree of support for spending on ‘very low income working parents’ – two-thirds of respondents support spending more, against just 4% who support spending less. The only group where, on average, people support reducing benefits is the unemployed (20% support more versus 38% less). These questions have been asked intermittently since 1998, with not much change in levels of support (with the exception of the retired, for whom support for extra spending has fallen quite significantly). Given these preferences, the shifts in the shape of the system towards those in work are perhaps not surprising.
Part-time work and full-time work
An important aspect of the expansion of in-work benefits is that it has been concentrated more on those who work part-time than on full-timers (for the purposes of this chapter, we define ‘part-time work’ as working fewer than 30 hours per week). For example, under the legacy benefits system, lone parents must work at least 16 hours per week to be eligible for the work-related element of tax credits, but due to the means-testing of tax credits effective marginal tax rates when moving beyond 16 hours of work per week have been very high for many workers.
This can be seen in Table 3. Here we focus on workers with children who are in the bottom third of the household earnings distribution (among households in work) – loosely speaking, those whom in-work benefits are largely distributed to (the equivalent table for all workers in households in the bottom third of the earnings distribution is Table A1 in the appendix). We take a representative sample of this group in each year from household survey data, and compute the average effective tax rates they would face when changing their hours of work, due not only to taxes on earnings but also to the withdrawal of means-tested benefits (Table A2 in the appendix is an equivalent of this where the population is kept constant and so only incorporates the effects of policy reforms). The ‘0 to 20 hours’ column, for example, shows the average share of gross earnings that is clawed back in the form of higher taxes or lower benefits when an individual moves from working 0 to working 20 hours per week. Higher tax rates represent a weaker incentive to change hours in the way described. The first two columns show tax rates at the extensive margin – the move from out of work to in work. The third shows tax rates at the intensive margin – in this case, moving from part-time to full-time work.
Table 3. Average effective tax rates on different increases in hours of work over time, for workers with children in low-earning households
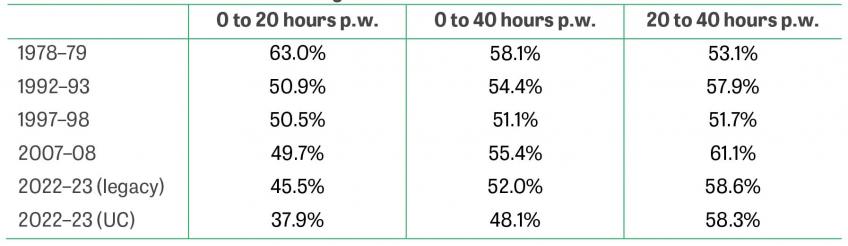
Note: The ‘legacy’ and ‘UC’ rows show tax rates under the assumption that the UC roll-out has not yet begun or has been completed, respectively. Sample is workers with children living in households in the bottom third of the household gross earnings distribution (among households in work). For the 2022–23 rows, we use the tax-benefit system in that year deflated to 2019–20 terms using average earnings, and simulate tax rates using the 2019–20 Family Resources Survey data. We account for the threshold change in National Insurance contributions implemented in July 2022 by using the average threshold across the fiscal year.
Source: Authors’ calculations using TAXBEN, the Family Expenditure Survey 1978 and 1992, and the Family Resources Survey 1997–98, 2007–08 and 2019–20.
Since the late 1970s, there has been a very significant decline in extensive margin tax rates for workers with children in low-earning households (and, as we show in Table A2, this is largely driven by reforms rather than changes in the population) – consistent with the evidence in the previous subsection that the system has shifted towards in-work rather than workless families, and driven primarily by a large expansion of work-contingent support through tax credits and their forebears. Since the Great Recession, extensive margin effective tax rates have fallen further due to reductions in income tax rates and benefit cuts. By contrast, intensive margin tax rates have changed much less – today they are around where they were in the early 1990s, and in fact above their level in the late 1970s. In other words, the system has indeed shifted towards more strongly incentivising part-time jobs over not working, while generally weakening the incentives to move from part-time to full-time work. Table 3 also shows that the introduction of universal credit reinforces this, considerably strengthening incentives to work part-time on average, but with little change in the incentive to move from part- to full-time work11. The evidence suggests that people have responded accordingly – a majority of the increase in employment that the tax credit reforms precipitated was in part-time work (Blundell et al., 2016).
The increased use of job-search conditionality is also again worth mentioning as something that has reinforced a wider trend in the direction of welfare policy. The expansion of conditionality for lone parents did result in more doing paid work, as we discuss in Section 4, but it was essentially entirely part-time work and on low earnings.
Families with and without children
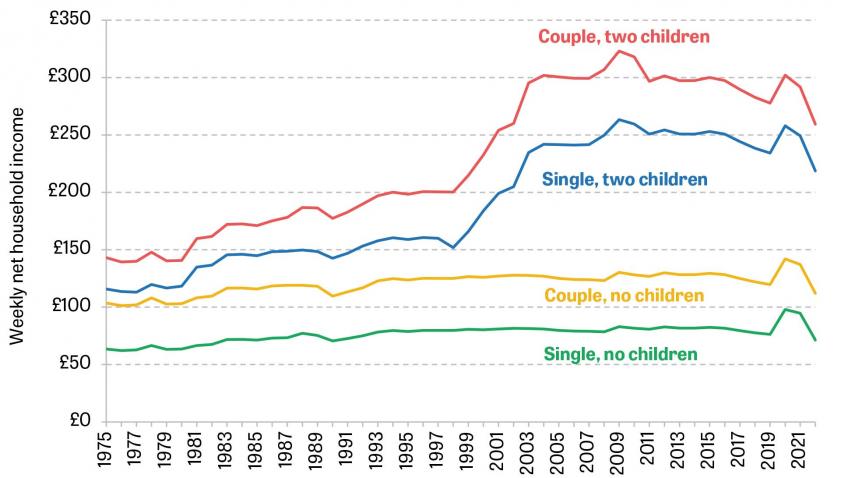
Much of the expansion of means-tested benefits has occurred via increased spending on families with children. This can be seen in Figure 13, which shows real out-of-work income for hypothetical families with no earnings, disabilities or housing costs, under different tax and benefit systems. Until the temporary increase to UC rates implemented during the pandemic (discussed in Section 2), there had, remarkably, been virtually no real-terms change in out-of-work benefit entitlements for families without children over the past half-century. Conversely, benefits for families with children had been considerably expanded. The increases in the out-of-work safety net are, over the period as a whole, roughly equivalent on average to having indexed their benefits to earnings (rather than the actual default of price indexation). Whereas in 1975–76 a couple with two children would get just 38% more than an otherwise-similar couple without children when out of work, by the eve of the pandemic that gap had increased to 132%.
One way of putting these differentials into some context is to compare them with the assumed differences in the needs of different family types implied by official measures of incomes, and income poverty. Income statistics (including the official ones produced by the government) use ‘equivalence scales’ to try to account for the different needs of different-sized families. These scales imply that the couple with two children would need 40% more income than the couple without any in order to have the same current living standard, all else equal – about the gap seen in the mid 1970s, but much smaller than the one present today. Of course, there are plausible justifications for distributing more to families with children than to those without (discussed in more detail in Section 10) that go beyond the economies of scale with respect to current living standards – in particular, impacts on the future life chances of the children. In addition, the equivalence scales themselves should not be taken as an infallible benchmark for relative need: it is notoriously difficult to identify the ‘correct’ equivalence scales.
Figure 13. Net household income over time for out-of-work families, by family type (2021–22 prices)
Note: Figure shows net incomes out of work under the April tax and benefit system of the corresponding year. There were temporary increases to universal credit in April 2020 and 2021 because of the COVID-19 pandemic. To put 2022 into 2021–22 prices, the Office for Budget Responsibility’s March 2022 forecast for CPI is used. The figure assumes that the households are owner-occupiers with no other source of income, two children, one of whom was born before April 2017, and no disabled members and have all their council tax covered by council tax support.
Source: Updated from Bourquin and Waters (2020).
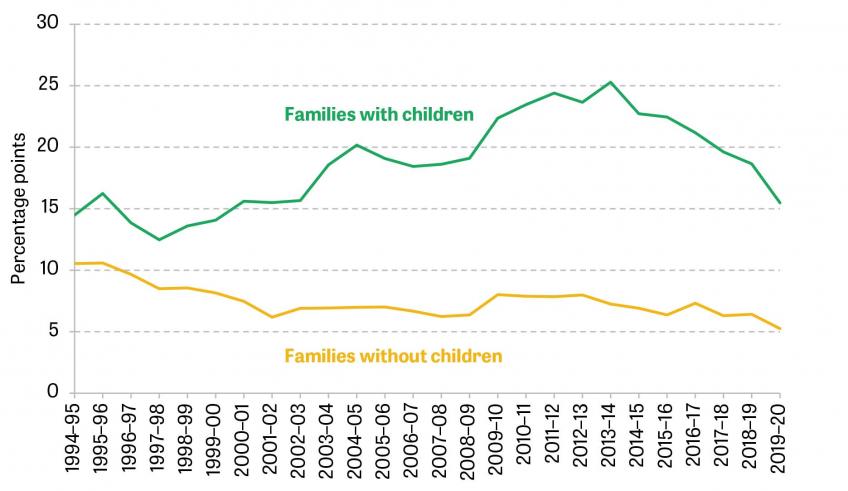
Figure 14 provides another way to see the increased emphasis of the benefit system on those with children. It shows the mechanical contribution of benefits to reducing poverty – that is, if all benefits were abolished and nothing else changed, how much would poverty go up by? In 1994–95 the mechanical effect of the benefit system on relative income poverty (where the poverty line is 60% of median income) was 14 percentage points (ppts) for families with children and 11ppts for those without12. But as the benefit system increasingly shifted towards those with children, the mechanical effect on their poverty rate increased, while it fell for those without children. More recent benefit cuts have lessened the impact of benefits on poverty for those with children, but the differential remains large, at 15ppts and 5ppts respectively. Given these trends, it is perhaps not surprising that poverty has become increasingly concentrated among those without children (see Figure A1 in the appendix): in the 1960s and 1970s, the working-age non-parent poverty rate was only about a third of that for others, but from 1980 the ratio started to steadily increase, and by 2011–12 the rates were almost the same. Again, retrenchments to benefits since then have slightly pushed the rates apart, and larger families in particular have seen a sharp rise in poverty (Cribb et al., 2022). This is at least in part a consequence of two policies: the benefit cap, which places a limit on the amount of benefits that some families can receive (and so tends to affect renters with several children, who typically receive more than other family types), and the so-called ‘two-child limit’, which means that third and subsequent children do not generate extra tax credit or universal credit entitlement. A detailed discussion of the impact of these policies on child poverty is available in Stewart, Patrick and Reeves (2021). In addition, Reeves et al. (2020) show that the benefit cap had a sizeable effect on mental illness.
Figure 14. Mechanical effect of benefits on working-age relative poverty rates
Note: Excludes households comprised entirely of students.
Source: Authors’ calculations using Households Below Average Income, 1994–95 to 2019–20.
The trends in relative spending on those with and without children are dominated by deliberate policy changes, rather than underlying changes in the population: the fractions of low-earning families (bottom 40% of the equivalised family earnings distribution) made up by lone parents and couples with children have consistently hovered around 12% and 31% respectively for the past 25 years.
Support for housing costs
Since the inception of the welfare state, the issue of housing costs, including their wide variability across the country and the relatively large share of income that poorer people typically spend on housing, has challenged policy. As we shall see, in modern times the challenge has been accentuated by key changes in the wider housing landscape, including rapid growth in private renting.
Today, the UK benefit system’s support for housing costs is mainly targeted at low-income renters13. Some homeowners are entitled to Support for Mortgage Interest (SMI), but eligibility criteria are tight (limited to those out of work who have been claiming some means-tested benefits for at least nine months), support covers only interest repayments rather than principal repayments, and as of 2018 SMI is a loan rather than a grant. For this reason, we focus on renters in this subsection14. Importantly, in addition to being eligible for cash support for their rental costs, renters in social housing (those who rent from a housing association or local council) generally also receive support in the form of below-market rents (for more on this, see Adam et al. (2015)). Here we focus only on the direct cash subsidy – housing benefit.
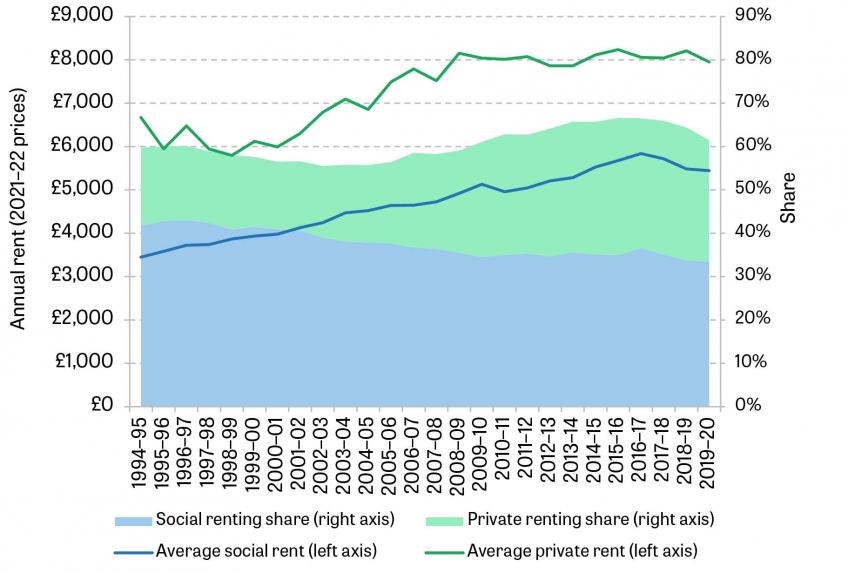
Figure 15 shows housing trends for working-age households in the bottom 40% of the (post-tax/transfer) household income distribution in each year. We choose the bottom 40% simply as an approximation for the part of the population that are often eligible for benefits, though some households inside that group will be ineligible and some outside will be eligible. The sum of the areas in the figure shows that there has been an overall shift towards renting (and hence away from owner-occupation) among low-income households, as there has been for society at large. This comprises a rapid increase in the size of the private rented sector, more than offsetting the long-term decline of social housing. Both private and social rents have increased in real terms over the period, but the growth has been significantly larger among social renters (58% versus 19% since 1994–95).
Figure 15. Housing tenure composition and average rent of working-age households in the bottom 40% of the income distribution
Note: Social and private rents are deflated using the Households Below Average Income before-housing-costs deflator. The figure shows average rent and tenure composition among the poorest 40% of households in each year, as measured by gross income excluding housing benefits.
Source: Authors’ calculations using Households Below Average Income, 1994–95 to 2019–20.
The combination of these trends means that over the past 25 years the amount spent on rent has increased by 53% in real terms on average among all lower-income households (including owner-occupiers, who of course pay zero rent). The most important factor contributing to this change is the increase in social rents (contributing 31ppts), followed by the increase in relative prevalence of private renting (14ppts), followed by the increase in private rent levels (9ppts).
This steady rise in real rents over the past 25 years has added around £5 billion to the annual working-age housing benefit bill (out of a total of around £20 billion15), and has pushed receipt of housing-related benefits further up the income distribution. By 2019–20, one in every three working-age renting families was in receipt of housing benefit or the housing element in UC.
In summary, this is a leading example of where wider trends in the economy and society can radically change what is required of the benefits system. While rising rents and the shift towards private renting continue, policymakers have to either accept an ever-increasing housing benefits bill or leave a growing fraction of the low-income population highly exposed to high housing costs, or some combination. In reality, both have happened. Among low-income private renters, just 8% now have all their rent covered by housing benefits, compared with almost half in the mid 1990s. For 32% of them, the amount of rent not covered by housing benefits eats up at least one-third of their (non-housing-benefits) income – a situation faced by just 14% of the group in the mid 1990s (Bourquin and Waters, 2020). Despite this, working-age housing benefit spending per capita increased by 38% between 1994–95 and 2016–17 (Figure 8). While these housing trends continue, there can be no easy answer for transfer policy. The very latest response from the government has been to nominally freeze the maximum support that private renters can get for housing costs (after raising these caps in the pandemic). As rents rise, this means that the real support provided to renters will steadily dwindle, especially in areas where rent growth is fastest.
Support for those in ill health
Although the universal, free-to-use National Health Service means that the UK benefits system does not need to cover health insurance, health-related benefits exist for income maintenance (in the face of constraints on ability to earn through paid work) and to cover extra health-related costs. We use the terms ‘incapacity’ and ‘disability’ benefits, respectively, to cover these distinct (though overlapping) functions. The modern incarnations of these benefits for those of working age are employment and support allowance (ESA) and personal independence payment (PIP), though many other names have applied in the past.
In addition, health and the benefits system interact in more subtle yet also important ways, since those in poor health are more likely to be out of work or on low earnings and thus eligible for other benefits. In this subsection, we briefly discuss long-term health trends and how they relate to benefit claiming; elsewhere in the Deaton Review, a whole chapter is devoted to health (Case and Kraftman, 2022) and a forthcoming paper will focus specifically on inequalities in disability (Banks, Karjalainen and Waters, forthcoming).
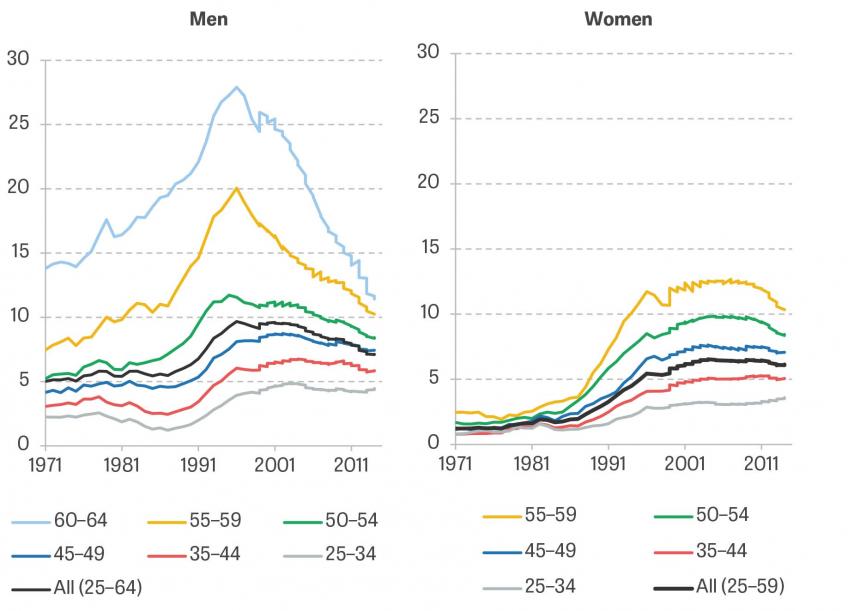
The incapacity benefit caseload has changed substantially over the past half-century. Figure 16 reproduces analysis from Banks, Blundell and Emmerson (2015), showing the share of the population claiming incapacity benefits in different age groups for men and women between 1971 and 2014. The figure shows that the rate of claiming among all groups steadily rose from the early 1980s to the mid 1990s, especially for older individuals. This was a period of rapid economic change in the UK – specifically, deindustrialisation including the decline of manufacturing and near-disappearance of mining – when labour market opportunities for some significantly weakened (Beatty and Fothergill, 2020). This highlights the likely role of labour market conditions in determining health-related benefit claims: health is clearly a crucial factor, but it cannot be decoupled from the wider economic environment. There is a significant amount of US evidence which attests to the same point: health-related benefit claims increase when economic opportunities deteriorate (Black, Daniel and Sanders, 2002; Autor and Duggan, 2003; Autor, Dorn and Hanson, 2013; Charles, Li and Stephens, 2018). For women specifically, the increasing rate of female employment may have also contributed to the rising incapacity benefit caseload. Over this period, eligibility to incapacity benefits was partly contribution-related (even when means-tested routes to eligibility were also available). Rising female employment therefore means more women with the contribution record required for incapacity benefit receipt.
Following a reform to tighten eligibility in the mid 1990s16, claim rates among men have fallen steadily. That decline is particularly sharp among older age groups – prior to reform, more than a quarter of men approaching state pension age were receiving incapacity benefits. Women did not seem to be as strongly affected by the mid 1990s reform as men, and the overall rate of incapacity benefit claiming among women has changed fairly little since 2000. Men and women of the same age are now similarly likely to be on incapacity benefits.
The figure also shows that gaps in the claim rates between different age groups have narrowed considerably for both men and women since the mid 1990s. Instead, the key predictor has increasingly become education. Emmerson, Joyce and Sturrock (2017) show that in 2000, older high-educated individuals were two to three times as likely to claim incapacity benefits as younger low-educated individuals; by 2016, the reverse was true. This suggests that receipt of incapacity benefits may increasingly be a longer-lasting state of affairs, for a group who face persistent challenges in the labour market beyond only their health.
Figure 16. Percentage of individuals claiming incapacity benefits, by age and sex
Note: The figure is restricted to men aged under 65 and women aged under 60, since for most of the period those older were above state pension age and hence generally ineligible for incapacity benefits.
Source: Reproduced from Banks, Blundell and Emmerson (2015).
Banks, Blundell and Emmerson (2015) show that there has also been a steady increase, for both men and women and across all age groups, in the share of incapacity benefit claims for mental or behavioural health problems. By 2014, roughly four in every ten claims was for one of these reasons.
These changes present big challenges. Previously, the caseload was to a sizeable extent made up of older claimants, with largely physical health problems. It was very often acting as a stopgap between wages and state pension entitlement, for those unlucky enough to experience a hit to their economic prospects and/or their health towards the end of their careers. The kind of support that those claimants need is likely to be quite different from that for today’s caseload, who are younger, probably claiming for longer, and more likely to be claiming in light of (often fluctuating) mental and behavioural health problems.
Figure 17 shows a similar chart for disability benefits – non-means-tested transfers aimed at compensating individuals for the higher living costs associated with disability. Data limitations mean that we can only begin the series in 2002. There are two things to note from the figure. First, with the exception of older men, claim rates have increased, especially for women, over the past two decades – in contrast to the pattern seen for incapacity benefits. Whereas the decline in the latter may be partly accounted for by a strong labour market, since disability benefits are neither means-tested nor work related the labour market has a far less direct impact on claims. Second, although the replacement of disability living allowance with PIP (which began in 2013) attracted high-profile news stories of individuals seemingly in clear need of support not being able to get it, overall there is no visible evidence of a decline in disability benefit claiming following the reform17. This is in contrast to the mid 1990s reform to incapacity benefits which did appear to reduce the caseload. Shortly before the completion of this chapter, further evidence of unexpected increases in claims for disability benefits emerged, with sharp rises in the number of new monthly claims from 2021 onwards, alongside broader indicators of worsening health outcomes in the UK. A consensus on the causes is yet to materialise, but the increase in new claims was seen across a range of health conditions and age groups (Joyce, Ray-Chaudhuri and Waters, 2022). Trends here look likely to continue to be a major issue, and serious challenge, within benefits policy.
Figure 17. Percentage of individuals claiming disability benefits, by age and sex

Source: Authors’ calculations using DWP Stat-Xplore.
Means-testing
If we take a relatively long-term historical view, perhaps the most significant change, reflecting the accumulation of many policy choices over many decades, has been a shift away from contributory benefits (where entitlement is based upon having ‘paid in’ to the system through work earlier in one’s life) towards means-tested benefits (where entitlement is dependent upon currently having a low income). This has often come as part and parcel of the shift towards families with children and working families already discussed. Moreover, a desire among policymakers to get support to people quickly and push down poverty rates has generally come with increased means-testing, since universal benefits come with a very high cost and it takes time to accumulate entitlement to contributory benefits.
The shift can be seen in Figure 18, which splits real working-age benefit spending per capita into means-tested benefits, contributory benefits, and ‘other’ benefits, entitlement to which is independent of income or past contributions (principally child benefit and disability benefits).
Figure 18. Working-age benefit spending (2021–22 prices) per capita
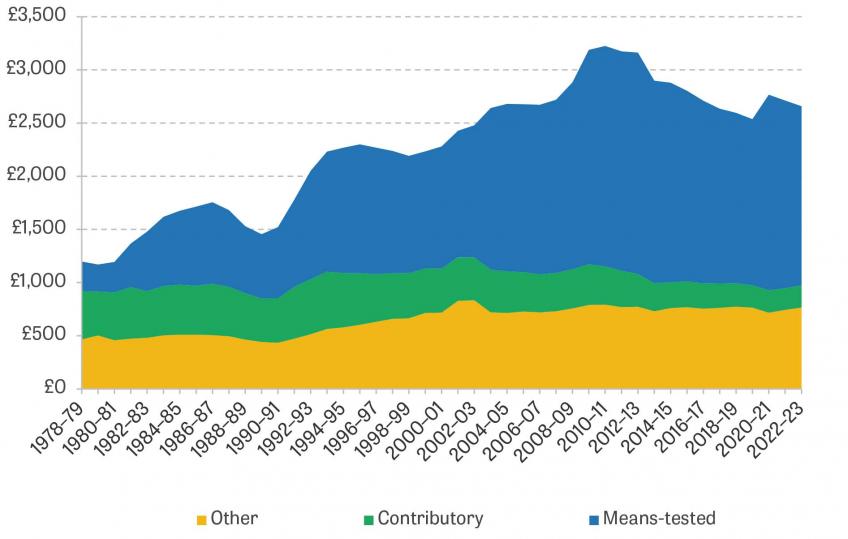
Note: ‘Other’ includes the child-contingent tax allowances discussed in the note to Figure 8. It also includes child benefit, though as discussed in Section 2, this can be thought of as a means-tested benefit where the means-testing kicks in at a high level of income.
Source: Authors’ calculations using DWP, ‘Benefit expenditure and caseload tables, Autumn Budget 2021’.
The rise in real-terms benefit spending since the late 1970s is almost entirely due to means-tested benefits, which have trebled as a fraction of the total working-age bill from 23% to 63%. Conversely, contributory benefits – which made up 38% of the bill in 1978–79 – have seen a steady relative decline, and now account for around 8% of spending (contributory unemployment and incapacity benefits are the main areas where spending has fallen). Policy choices have been key to this relative decline. The de facto default in the UK is that virtually the entire working-age benefits system is price-indexed, but there have been some substantial above-indexation (broadly, real-terms) expansions to the system in recent decades, overwhelmingly concentrated within the means-tested parts of it – often focused on families with children, and sometimes with the addition of new layers of support such as the current tax credit system. But changes in the wider economy have also contributed. For example, a large chunk of contributory benefit spending is on unemployment benefits, and so the declining worklessness discussed above has pushed down on the contributory benefits bill.
The associated commentaries by Crafts (2023) and Timmins (2023) discuss the history and political economy behind the shift away from contributory to means-tested benefits.
Recent developments: retrenchment, minimum wages, and integration
As seen in Figure 9, working-age benefit spending steadily increased between the late 1970s and 2010, both in real terms per capita and as a share of GDP. As already discussed, some of that increase related to changes in the economy and society (such as rising rents) and some to policy reforms (such as expanded benefits for families in work and those with children).
Between 2010 and the eve of the pandemic, working-age benefit spending fell. That partly reflected the economy recovering from the Great Recession, but also had much to do with deliberate policy choices. These choices have included a combination of across-the-board real-terms cuts (such as nominal freezes in most working-age benefits between 2015 and 2019) and savings from cutting particular benefits in more specific ways. To the extent that clear themes have emerged beyond simply trying to reduce the benefits bill, they have been along two lines.
First, the coalition government of 2010–15 tended to more aggressively means-test benefits, reducing entitlements the most for recipients who do not have the very lowest incomes. As discussed in Section 2, child benefit has been effectively means-tested for the first time. An element of child tax credit which even relatively high-income families had been eligible for was reformed, so that it is now targeted at a much more similar (lower) income bracket to the rest of CTC. And the government simultaneously made a number of cuts to working tax credit and increased CTC, which in combination meant that the poorest families tended to gain while better-off (still relatively poor) families tended to lose. Other reforms were made over the 2010s which did reduce entitlements for a wide range of benefit recipients, including those on the very lowest incomes – for example, a four-year nominal freeze in most benefits. Nevertheless, the removal of support from benefit recipients slightly further up the income distribution remains one standout feature of the 2010s reforms. More recently, the pendulum has begun to swing back, with several universal credit reforms since 2017 increasing the amount that claimants can keep when they move into work or increase their earnings, including quite a large reduction in the UC taper rate in 2021.
Second, the norm of the benefit system attempting to reimburse people for some of their actual costs (or an approximation of their actual costs) has to some extent been eroded in favour of trying to cover (the government’s view of) ‘reasonable’ costs. This has never been stated as a general principle guiding policy, but it is implicit in a number of reforms:
- The introduction of the ‘two-child limit’ means that, rather than families getting extra support for every dependent child, they only receive it for the first two children.
- The so-called ‘bedroom tax’ means that social renters whose property contains more bedrooms than the government deems necessary for that family can no longer get their full rent covered.
- Prior to 2010, low-income private renters could get their full rent paid for up to the median rent in their area. That cap is now down at roughly the 30th percentile of local rents, though on current policy will continue to fall in many areas, since the caps are now indexed to nationwide consumer prices (CPI), not local rents.
- Overall benefit entitlement is subject to the ‘benefit cap’, for out-of-work families without a disability. The main effect of this is to limit support for families with children who also have relatively high housing costs.
All of these policies weaken the link between a family’s actual costs – namely the costs of children and housing – and the benefits they are entitled to. One way to interpret such reforms is that they reflect a view that taxpayers should only pick up the bill for claimants’ choices up to a ‘reasonable’ point; if, for example, a claimant has high costs because they live in an expensive property, that should not be the responsibility of the taxpayer. Of course, many claimants make their choices about how many children to have or what property to live in when they are not, nor expect to be, in receipt of benefits; and some will not be able to easily adjust their arrangements when circumstances change (e.g. when a child leaves home, it may not be straightforward to find a nearby property with one fewer bedroom). These reforms also relate closely to the relative lack of focus in the present UK benefits system on insuring people against the loss of work. People who have taken on costs that are commensurate with their working incomes can now find that a very low fraction of those spending commitments are covered after job loss. Many of these policies are also examples of where design choices can affect ‘horizontal’ or ‘between-group’ inequalities. For example, the two-child limit disproportionately affects certain religious and ethnic minorities.
Around the same time as the size of the benefit system has been reduced, another pattern has emerged – relatively sharp increases in the minimum wage, in particular since 2015. While this is not a transfer policy, it merits a short discussion here as the two policy tools are often linked. Indeed, when a sizeable rise in the minimum wage was first announced by Chancellor George Osborne in 2015, it was presented as helping to offset the further significant cuts to benefits that were announced at the same time. For the most part, this framing is misleading. An individual’s gross hourly wage, which minimum wages affect, is only weakly correlated with their family benefit entitlement or their family income. A minimum wage worker might, for example, live with a high-earning partner, meaning that as a family they are relatively well off and so receive little in benefits. A worker with a higher hourly wage might nonetheless be entitled to benefits because they do not work many hours, and/or because they have children or high rents and a non-working partner. And, of course, families where no one works cannot gain from a minimum wage rise, and are likely to be in receipt of benefits and on a very low income.
In fact, Cribb et al. (2021) show that the biggest proportional impact of the UK’s recent minimum wage increases was felt in the middle of the working-age household income distribution. This is for a couple of key reasons. First, minimum wage workers are most commonly located around the middle of the household income distribution, often as second earners, with those at the bottom of the income distribution typically out of work. (If we look only among households with someone in paid work, the gains from minimum wage increases are spread more evenly throughout the lowest-income half of households, but still not concentrated towards the bottom of that group, as benefits are.) Second, those minimum wage workers who are in poorer households are often on benefits and so face some of the very high effective marginal tax rates discussed in Section 2. That means that an increase in gross earnings does less for their net income than for that of another minimum wage worker further up the income distribution18. In short, the distributional outcomes to be expected from minimum wages and from benefits are in general very different.
The other big recent theme in benefit policy has been the integration of much of the working-age benefits system into a single payment – the universal credit reform described in Section 2. Historically, as governments have sought to use the benefit system to respond to emerging issues or achieve particular goals, they have tended to layer parallel programmes on top of one another. Tax credits were added (and expanded) on top of the pre-existing strands of support, as was a benefit to support those with high local tax bills. Housing benefits made up a relatively small share of benefit spending several decades ago, but have grown as a share of the budget following the big increase in the size of the private rented sector and a shift away from social housing, and the increase in private sector rents. That means that the design of housing support, including how it interacts with the rest of the transfer system, has become an even more important issue.
The different programmes tend to have rather complicated interactions with one another. For example, receiving tax credits reduces entitlement to housing benefit (by counting as income for the assessment of housing benefit). Given the existence of these parallel programmes, there are often defensible reasons for these interactions (to continue the previous example, it dampens the disincentive to work for people receiving both housing benefit and tax credits, since the tapering away of tax credits will, all else equal, bolster housing benefit entitlement). But the need for such interactions highlights some of the liabilities of having a system of this clunky form in the first place.
This patchwork of support, and particularly the resulting jumble of overlapping means tests, sometimes created strong disincentives to work (as discussed in Section 2), was difficult to understand, and often required claimants to claim a significant number of benefits to get their full entitlement. With this in mind, universal credit was intended to integrate these benefits together and rationalise the system. As shown in Section 2, UC’s fundamental structure is considerably simpler than that of the legacy benefit system, with a basic entitlement steadily withdrawn above a disregard (‘work allowance’). Having to apply for only one benefit simplifies application, and also avoids many applicants having to make a new benefit claim when they, for example, lose their job or have a child. By ensuring that there is a single taper rate applied to all claimants, UC also means that the very weakest work incentives that were present under the previous system (with marginal effective tax rates as high as 96%) are removed – though on average it does not significantly change the marginal incentives to work (see Table 3 earlier). Integration, however, is not an unalloyed good: it generally removes flexibility to design different elements of support depending on their actual purpose. For example, it implies choosing a single assessment period (discussed in Section 7) for in- and out-of-work support alike.
Despite the appeal of some of the motivations for it, universal credit has created major challenges, some of which we discuss in Section 7 – in particular, the five-week wait for benefits mentioned in Section 2. It is also notable that the integrating spirit which motivated UC’s introduction has not been pushed as far as it could have been. Council tax support (CTS) will remain a parallel benefit when UC is fully rolled out, but it could have been integrated together with the rest of UC. That it is separate means that claimants can in fact still have very high marginal effective tax rates, depending on how their local authority chooses to design its CTS system. Once we account for the continued existence of CTS, we estimate that around 6% of workers entitled to means-tested benefits will still have an effective marginal tax rate in excess of 75% under UC. That is certainly much lower than was present under the legacy benefit system, where the equivalent figure was 36%. But it could have been cut to practically zero if UC had been integrated with CTS19. However, integration would amount to mean-testing benefits more slowly, costing £2 billion per year and bringing more people into means-testing – though this could have been offset by slightly increasing the UC taper rate. Similarly, when the government decided to effectively withdraw child benefit from higher-income families, it did so in a roundabout way by implementing an additional income tax charge. This is complex for some recipients who must now file a self-assessment tax return, and is a rather awkward form of means-testing, being based on the income of the higher-income parent rather than on the total income of the family. Neither of these consequences would have been necessary had child benefit been integrated with UC.
The discussion of the current UK transfer system, and how its design and role have changed over time and compare internationally, has already hinted at a number of key ‘outcomes’ or ‘impacts’ that transfer systems can have. These go well beyond the mechanical impacts of the government deciding to make money available to certain people: the ultimate impacts depend on how policies affect people’s behaviour and how they interact with the wider social and economic environment. In the following sections, we examine the evidence on how differently designed systems can have different effects. We begin in Section 4 by briefly examining the huge amount of existing research on the impact of benefits on choices over paid work. In Section 5, we examine who actually takes up their entitlements – an area in which we have a moderate amount of evidence but more could be learned, including from careful experimentation, and especially in the UK. We then turn to three issues on which the evidence is more limited: the ‘economic incidence’ of transfers (that is, whose income is ultimately raised by them) in Section 6; then several ‘operational’ aspects of benefits, such as payment frequency and which member of a couple receives the benefit, in Section 7; and finally the ‘intergenerational effects’ – how transfers can have long-lasting impacts on the children of claimants – in Section 8.
4. Incentives and choices over paid work
Within economics, the most studied aspect of benefit policy is probably the effects on paid employment and the hours thereof. The evidence base here is very large, allowing us to draw some fairly clear conclusions. A recent development in this literature has been to go beyond looking at how incentives affect how many hours people work at a given point in time, to studying how they affect career progression, and here too we are starting to gain important insights.
Discouraging paid work is a key drawback of means-tested benefits. Alternatively, in-work benefits – by encouraging work, or at least helping to mitigate the discouraging impacts of other parts of the transfer system – generate additional pathways to increases in income (Hoynes and Patel, 2018). Because these issues are reviewed extensively elsewhere, our discussion here is brief. (For a fuller treatment, see Blundell and MaCurdy (1999) or Meghir and Phillips (2010).)
Financial incentives
There is a large amount of evidence on the importance of incentives at different margins and for different groups, much of which was reviewed and examined previously in the Mirrlees Review (Mirrlees et al., 2011). We briefly summarise key points from this research here.
For men, the impacts of financial incentives on work choices have generally been found to be quite small at both the intensive (how many hours you work) and extensive (whether you work at all) margins. Essentially, a very large fraction of men work full-time – though this has declined for those on low wages – and this remains true even if you change the tax and transfer system a lot. Larger effects, especially on the extensive margin, can be found for those whose trade-offs between the gains from work and its costs are more finely balanced – in particular, lower-educated men (e.g. Meghir and Phillips, 2010), those around retirement age (e.g. Manoli and Weber, 2016) and those with disabilities (e.g. French and Song, 2014).
There is a greater responsiveness among women, especially on the extensive margin. This is not especially surprising since the employment rate of women is below that of men – indicating greater scope for a change in work status – though as that gap has steadily closed it is likely that the responsiveness of women will have become closer to that of men. Responses are larger for mothers making delicate trade-offs between paid work, time with family and childcare costs than for women without dependent children. Lone mothers also tend to be more responsive than married or cohabiting mothers, for similar reasons. (Meghir and Phillips (2010) show these differences by comparing labour supply elasticities for these groups in different studies. Of course, more research has been done since then, and an update of this sort of review would be valuable.)
One key factor studied by this literature is the extent to which benefits affect work choices by changing the returns to work (i.e. the extra income from working an extra hour) and by changing an individual’s income at their current level of work. For example, suppose that the government decides to reduce the UC taper rate, so that it is withdrawn more slowly as earnings rise. For those in receipt of UC, that increases the returns to additional work – if they work an extra hour, they will lose less UC than they did previously – so the incentive to work more is strengthened. But it also increases their income at their current level of work – less of their UC has been withdrawn. They can ‘spend’ that increase in income on more time off work (i.e. they can have the same income as before while doing less paid work), weakening their incentives to work more. These two effects – known as the ‘substitution’ and ‘income’ effects – push in opposite directions, and so in principle such a reform could increase or decrease the amount an individual works. In practice, the empirical literature has generally found that income effects are quite small and are dominated by substitution effects20.
This has implications for benefit design. In particular, more universalist policies (such as child benefit) are unlikely to have very significant impacts on labour supply because they only change incomes and do not change the absolute returns to work. Conversely, as the above example demonstrates, means-tested benefits with high taper rates imply reductions in the returns to work and so may have bigger effects. Within means-tested benefits, extensive margin work incentives can be strengthened by reducing out-of-work benefits or increasing in-work benefits21. Intensive margin incentives are more complicated. They can be strengthened for existing claimants by slowing the speed at which benefits are withdrawn (e.g. reducing the UC taper rate or increasing the work allowance). However, such reforms also mean that benefits stretch further up the income distribution, bringing more people into means-testing and weakening their incentives.
Conditionality and active labour market policies
Work choices can also be affected by so-called ‘active labour market policies’, and these are often closely linked to the transfer system, through requirements to look for a job in order to claim out-of-work benefits or through the provision of training programmes, job-search assistance or employment subsidies to transfer recipients. Card, Kluve and Weber (2018) provide a summary of such policies. Job-search and conditionality approaches (discussed in more detail below) can have significant positive effects on employment in the short run, but the evidence generally suggests much smaller long-run effects. The implication is that those short-term increases in employment do not have radically positive impacts on labour market attachment and skill development, contrary to the grandest hopes that sometimes accompany such schemes. This is likely to reflect both the kinds of people typically targeted and the types of work that they are incentivised to move into (in particular, low-skilled work, often at part-time hours, which tends to have limited effects on human capital development, as discussed later in this section).
Conversely, programmes that aim to build human capital more directly – training programmes and subsidised private sector employment – have limited effects in the short run, since participants have to pass up employment opportunities when on the programme, but when designed well they offer the promise of larger positive effects in the long run as the employee can draw on the skills gained. This distinction is brought out clearly in Hotz, Imbens and Klerman (2006), who examine a programme in California with both job search and human capital development aspects. The former was more effective at getting people into work in the short run, but the latter was more effective in the long run. Subsidised public sector employment has little or even negative effects on employment across all time horizons (e.g. Gerfin and Lechner, 2002), suggesting that such programmes may be ineffective at building participants’ human capital, and simply slow down their search for unsubsidised jobs. An accompanying commentary discusses in more detail the potential for human-capital-focused interventions to play a role alongside the transfer system (Moffitt, 2023).
The UK has experimented with various forms of active labour market policies. The ‘New Deal’, introduced in 1998, aimed to strengthen human capital among several groups (principally long-term unemployed young people) through training and education. Evaluations suggest it had modest success in raising employment and reducing the benefit caseload (Riley and Young, 2001; Blundell et al., 2003; Dolton and Smith, 2011).
In 2003, the government launched a three-year randomised trial providing job-search and advancement assistance, training, and cash incentives to undertake training and to get into and remain in work (known as Employment Retention and Advancement, or ERA; Hendra et al. (2011) describe the programme in detail). An evaluation five years after the start of the trial (Dorsett and Oswald, 2014) found that it had only a temporary effect on employment, but a persistent effect on earnings (£10 per week). Perhaps surprisingly, it had a negative effect on self-reported life satisfaction and financial security.
But perhaps the most common tool used has been job-search conditionality. An early strengthening of such rules came with the introduction of jobseeker’s allowance in the mid 1990s. Evidence on this change suggests that while it was successful at getting people off unemployment benefit, some simply went onto incapacity benefits, and overall there was no effect, or perhaps even a temporary negative effect, on employment (Manning, 2009; Petrongolo, 2009).
A more recent example of the expanding use of conditionality applied specifically to lone parents: the ‘Lone Parent Obligations’ (LPO) reforms, implemented between 2008 and 2012. Whereas previously any lone parent out of work did not have to search for a job to receive out-of-work benefits until their youngest child turned 16, that threshold was incrementally reduced to 5. This led to a sharp increase in the fraction of lone-parents subject to job-search conditionality (see Figure 19).
Figure 19. Share of lone parents subject to job-search conditionality
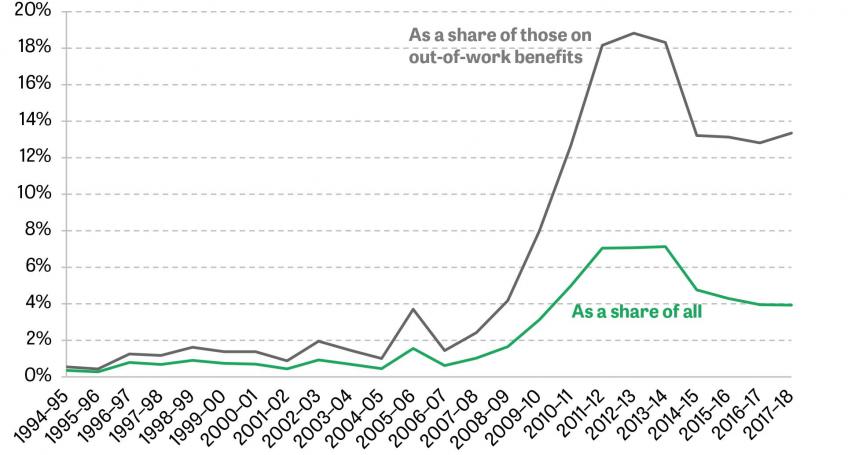
Source: Authors’ calculations using Family Resources Survey, 1994–95 to 2017–18.
This experience provides a case study in why, even if increases in employment can be achieved through conditionality (often the explicit goal of such policies), one should not fall into the trap of taking employment to be the only outcome that actually matters. The kinds of jobs that claimants get into, as well as other ways that they can respond, are important, as are the wider impacts of participation in such schemes on their well-being. Codreanu and Waters (2023) examine the impacts of the LPO on a range of outcomes, drawing a few key conclusions. First, consistent with much of the existing literature, the use of conditionality was very effective at getting people into paid work: the LPO raised the employment rate of those affected by 4.4ppts, from a base of 63%. Second, however, the increase in employment was essentially entirely in part-time, low-paid jobs. This can be seen in Figure 20, which shows the effect on the cumulative distribution of hours and earnings, i.e. in panel A, a point on the line indicates the impact on the share of lone parents who are in work and are working less than the number of hours shown on the horizontal axis. Almost all of the increase in employment was accounted for by part-time jobs – 70% in jobs with fewer than 24 hours per week, and a further 22% in 24- to 29-hour-per-week jobs. As panel B shows, virtually all of it was in jobs paying £20,000 per year or less (the 40th percentile of the overall earnings distribution), with around half in jobs paying £8,000 per year or less (2021 prices). That the increase was entirely focused on these particular kinds of work is critical for the likely long-term effects of the policy: as discussed later in this section, the evidence suggests that part-time work results in very limited career progression. Third, some claimants responded to the policy by claiming new benefits. In particular, the increase in the shares claiming incapacity and disability benefits, which do not have job-search conditions attached, increased by 3.3ppts and 0.7ppts respectively. Fourth, the sum of these effects meant that the fiscal savings from the policy were small (not statistically significant and considerably less than the government had anticipated). Those newly employed did not earn much, and so paid little in tax and (because of the UK’s focus on in-work benefits) the net impact on their receipt of transfers was small; and those who started claiming new benefits generally saw an increase in receipt. Fifth, despite the fact that the effect of the reform was to remove an option for lone parents (claiming out-of-work benefits while not seeking a job), it appeared to have little effect on mental health, reported life satisfaction, or well-being overall. Codreanu and Waters provide suggestive evidence that this overall impact is the combination of two offsetting effects: those who get into work because of the policy see an improvement in these outcomes, while those who remain out of work – and are now subject to conditionality – see a deterioration. This chimes with qualitative evidence indicating that conditionality can negatively affect the well-being of some claimants (see Patrick (2023)).
Figure 20. Impact of job search conditionality on the distribution of hours and employee earnings among lone parents
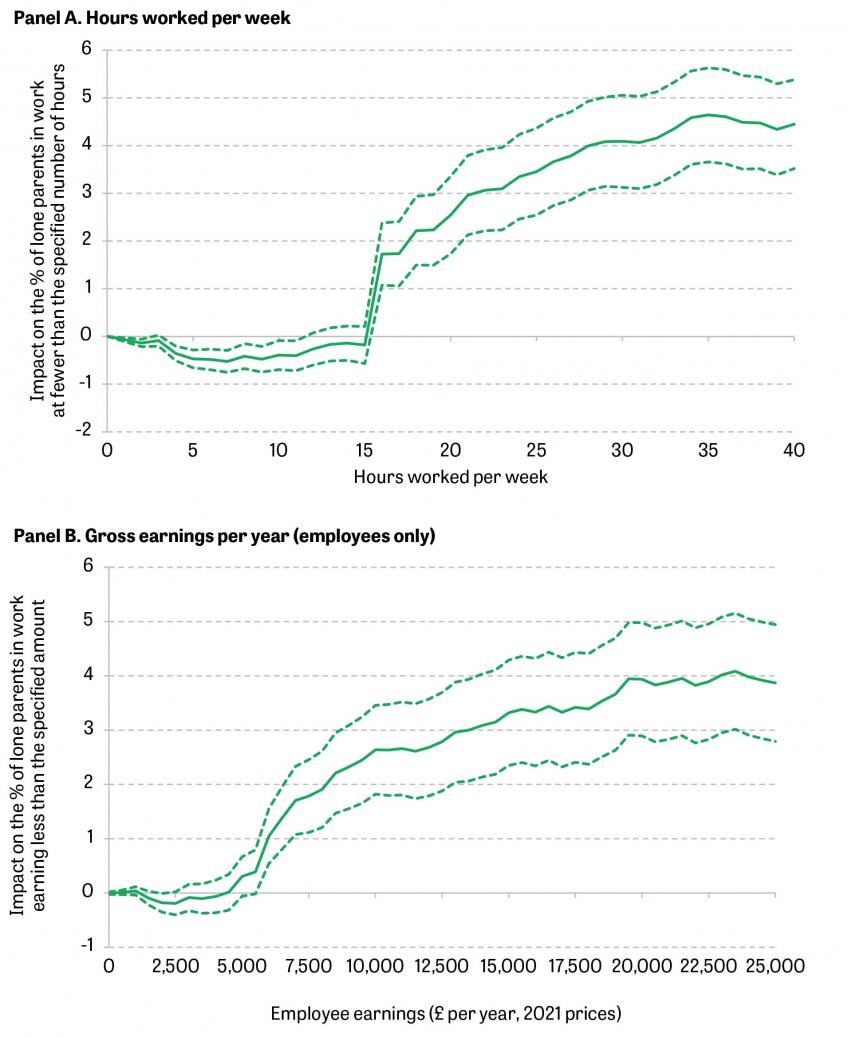
Note: The graphs show the impact of the LPO policy on the share of single parents who are in work and working less than or equal to a given number of hours (panel A) or in work and earning less than or equal to a given level of earnings (panel B). The dashed lines show 95% confidence intervals. The effect on the share working a positive number of hours is slightly larger than the effect on the share earning a positive amount because the former includes the effect on self-employment, whereas the latter does not.
Source: Codreanu and Waters, 2023.
These somewhat mixed conclusions are of particular import given that the UK’s switch to UC is expanding conditionality significantly further:
- Under the legacy system, out-of-work claimants could receive child tax credit and housing benefit without any job-search requirements. Job-search requirements were only applied to those who claimed jobseeker’s allowance. That allowed out-of-work families to accept a lower benefit entitlement (i.e. not getting JSA) in return for avoiding conditionality. Because UC integrates these benefits together, this is no longer possible. Out-of-work claimants who are not disabled, caring for someone who is disabled, or looking after young children, are generally subject to job-search conditionality – thus expanding its use.
- Whereas in the legacy system receipt of working tax credit was dependent upon working a certain number of hours, there is no hours conditionality applied in UC. However, in UC the government in some cases applies job-search conditionality to those who are already in work but with low earnings or who have a working partner but are not in work themselves. In this way, hours-of-work conditionality is being switched for job-search conditionality. The Department for Work and Pensions (2018) reports the results from a randomised control trial on the effects of such in-work conditionality. Those subject to more stringent conditions (fortnightly meetings with a work coach where they agree mandatory actions to try to increase earnings) saw their earnings increase by £17.52 per week after 18 months, compared with £13.36 in the control group – a difference of £4.16 and equivalent to £216 per year22. While the increase for the treatment group is about a third larger than that of the control, £4.16 per week is just 2.5% of pre-trial earnings23; and those subject to less stringent conditions (eight-weekly meetings) saw an even smaller increase. This suggests that there may be fairly limited scope for encouraging progression in this manner.
- UC applies work-search conditionality to lone parents with a child aged 3 or older (as opposed to 5 or older under legacy benefits). It also applies a ‘softer’ form of conditionality – where claimants are required in some way to ‘prepare’ for work (e.g. CV writing) – for lone parents with a child aged 1 or 2.
Taken in the round, the evidence casts some doubt on the value of conditionality in recent years in the UK. Reforms in the 1990s were found to have no positive impacts on employment, and the employment effects of reforms affecting lone parents in the 2000s and 2010s were substantial, but almost entirely in part-time and low-paying jobs (known to bring little long-term benefit in terms of career and wage progression) and with barely any fiscal savings. This is not to say that it would be impossible to posit positive effects, or to find ethical frameworks that would lead to a coherent justification. Perhaps being in work brings non-pecuniary benefits to people that they undervalue until they enter work. Perhaps conditionality is deemed necessary for the political acceptability and sustainability of an extensive safety net. Or perhaps a philosophical framework that goes beyond pure welfarist criteria can be invoked, as Moffitt (2023) neatly summarises: ‘Most of those who find work requirements to be optimal give up on welfarist criteria and adopt some other criterion, such as poverty alleviation with zero weight given to leisure … or just put recipient work directly into the social welfare function, effectively a form of paternalism’. Along these lines, some people may simply feel that it is not fair for people not willing to search for work to get the same support as those who are, and that the system needs some way of recognising that. Regardless of the merits of any of these arguments, it is not clear to us precisely what the UK government currently thinks the purpose of conditionality is, and it is questionable whether – if those purposes were spelt out explicitly – the evidence would suggest that the goals are being met.
The impact of universal credit on employment and hours of work
Particularly topical in the UK is the effect that UC will have on employment and hours of work. Research on this issue to date has been scant. Several studies (e.g. Browne, Hood and Joyce, 2016; Brewer, Finch and Tomlinson, 2017) have examined UC’s effects on financial work incentives (i.e. the financial return to work), but this does not tell us how claimants will respond to those incentives, nor does it incorporate the effect of other changes that UC makes (e.g. obviating the need for multiple benefit claims). A more concrete piece of evidence comes from the Department for Work and Pensions (2017), which used administrative data to compare new claimants to UC in parts of the country where the benefit had been rolled out with those in other parts where it had not yet been. This suggested a positive employment effect, with employment 3–4ppts higher for UC claimants for each of the next six months after their claim began. However, the nature of the study meant that only a very specific type of claimant could be evaluated (single, unemployed, with no children and no housing costs). It is unlikely that we can extrapolate reliably from this narrow group to the much wider pool that will claim UC when it is fully rolled out – especially given that UC changes work incentives quite differently for different groups.
As far as the direct financial incentives to work go, it looks as if UC on average does strengthen incentives to be in work (see Table 3). But, following the theme of recent decades, it particularly incentivises part-time jobs. The incentive to move from 0 to 20 hours of work is considerably strengthened, but the incentive to move from 20 to 40 hours is left almost unchanged.
Career and earnings progression
The issue of low wage progression at the bottom of the earnings distribution (and indeed low wage growth across the whole distribution) has become perhaps the key labour market issue in the UK. In particular, employment rates have increased (as we showed earlier) but – prior to the sharp increases in the minimum wage introduced since 2015 – wage gains were limited for the lowest-skilled workers.
A starting point for thinking about this issue, as it relates to transfer policy, is recent research demonstrating how the long-run impacts of tax credits on earnings and employment in the UK have been constrained by the lack of wage progression among the low-skilled (Blundell et al., 2016). This means that the aim of encouraging people into work as a stepping stone to further career progression is not often realised – people move into work, but there is no job escalation thereafter and they stay on low pay (and hence receiving in-work transfers). This again highlights that welfare policy should not be designed in isolation: while in-work transfers can achieve a lot, their long-run impact could be magnified considerably if we could only find complementary policies that can secure career progression for people once they are in work.
One way in which the design of transfers themselves could be altered to try to improve wage progression is by tweaking the extent to which they encourage full-time versus part-time work. This is because hours of work and hourly wages seem to be strongly linked in the long run – and, in particular, working part-time seems to shut down progression in hourly wages (Blundell et al., 2016). This raises the question as to whether we could better meet the long-run aims of in-work transfers by trading off incentives at the extensive and intensive margins of labour supply differently, taking more pains to limit the disincentives we create to increase hours of work.
This goes somewhat against the grain of modern thought in both policy and academic circles. To the extent that the trend towards in-work transfers – which took hold not only in the UK, but also in the US (through the Earned Income Tax Credit, EITC) and other countries – was given impetus by the scientific literature, it was probably largely due to the findings of Saez (2002). This research showed that if labour supply elasticities are higher on the extensive margin than on the intensive margin – that is, loosely, if people’s working decisions respond more to incentives over whether to work at all than to incentives over how much to work – then there is a strong case for work-contingent support that is then phased out at higher earnings levels. Those insights have been very important, but they were generated within a ‘static’ framework that ignored the possibility of different work intensities having different impacts on human capital, and hence future wages and labour market behaviour. What if the phasing-out of support at higher earnings levels discourages precisely the kind of work that would bring the bigger benefits to careers and wages in the longer term? We now know more about these dynamics, and as a result we should factor them into policy thinking.
Figure 21. Impact on outcomes, averaged over working life, from increasing the UC work allowance and reducing the taper rate
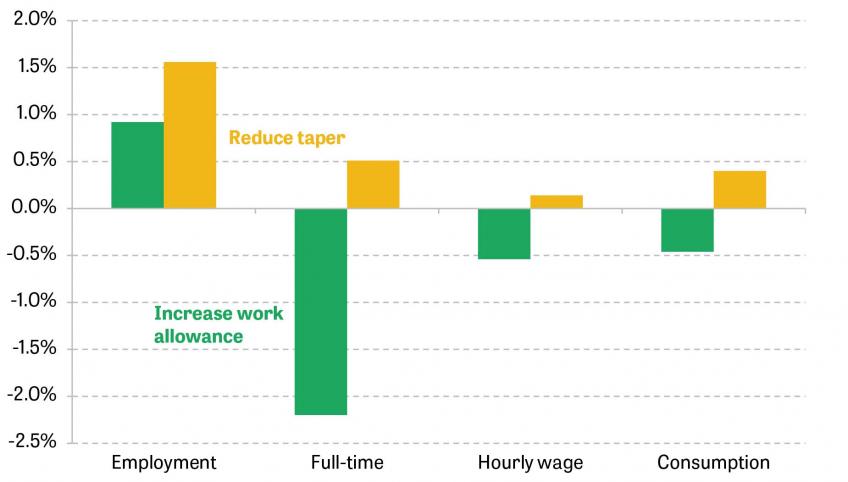
Source: Goll, Joyce and Waters, 2023.
Goll, Joyce and Waters (2023) study this issue, analysing the consequences of designing the benefit system to differently incentivise part- and full-time work. They build on a dynamic model of labour supply developed in Blundell et al. (2016), estimated empirically using UK longitudinal data. Two simple potential reforms bring out the difference clearly. First, the government could increase the work allowance in UC – allowing claimants to keep more of what they earn before their UC starts to be withdrawn. Second, the government could reduce the taper rate in UC – the rate at which the benefit is withdrawn as a claimant’s earnings increase. Superficially, these reforms might appear very similar – they both increase incomes for working families, so strengthen the incentive to have someone in work. But on the intensive margin they are quite different. Increasing the work allowance tends to incentivise part-time work, as it generally results in at least as large a cash increase in income for part-time workers as it does for full-time workers24. Reducing the taper tends to incentivise full-time work, as the (cash) increase in income is larger the more a claimant earns. Figure 21 summarises the impact of these reforms on outcomes across working life. Although both reforms are successful at getting people into work, the increase in the work allowance reduces the number of full-time workers – and so, despite employment gains, reduces human capital accumulation on average, and with it hourly wages and consumption. Conversely, the cut to the taper rate increases full-time work, and with it wages and consumption in the long term. Moreover, because the taper rate cut encourages full-time work and raises wages, it ends up boosting tax revenues and so costing the government less than the increase in the work allowance. While it is certainly not true that the taper rate cut is better for everyone than the work allowance increase, on average the effects look more positive. Goll et al. (2023) go on to show that a more radical policy of introducing a tax credit that is targeted towards those who work full-time could have even stronger effects.
These results indicate that the case for worrying about the financial incentives to work full-time is significantly stronger if one takes account of these long-run consequences than if one does not. Governments that want to enhance career progression for benefit claimants would do well to consider these effects – and may find that, by doing so, they end up with reforms that are more cost-effective than one would expect if one focused only on the immediate impacts.
To ward off one potentially important misunderstanding, there are of course many people who would, in the absence of distortions to their financial incentives, choose to work part-time rather than full-time. The argument is not that those people should somehow be pushed into working full-time instead. Parents in particular are weighing up many factors, in light of many constraints, when deciding what sort of paid work they want to do. Rather, the point is that the existing tax and transfer system tends to discourage moving from part-time to full-time work by distorting the relative financial rewards. Empirical research on how labour supply responds to financial incentives tells us that, therefore, there are people in the UK who would on balance have chosen full-time work but, due to the tax and transfer system, are instead working part-time. Our point is that, alongside the standard sorts of arguments about the pros and cons of such a system, there is another, longer-term consideration: incentivising some people to work part-time who would otherwise have worked full-time will likely mean that their future wages are lower than they would have been. Reforms that reduce the overall disincentive to full-time work can limit that effect.
5. Take-up
The government decides how much it wants to support different kinds of people, but the money also has to reach those people. Particularly in a predominantly means-tested system such as the UK’s, getting money to the ‘intended’ recipients is not a trivial part of the process. Incomplete take-up of entitlements has long been bemoaned by proponents of alternative systems, such as those arguing for more universalism (e.g. Atkinson, 2015).
In broad terms, the main reasons for non-take-up are somewhat well understood, but precisely who is ‘screened out’ by the barriers to take-up (particularly whether it is the more or less needy, among those entitled), and precisely whose claiming rates would be increased by particular interventions, are crucial questions about which we know much less, and could use more evidence. An additional caveat is that a large fraction of the empirical evidence in this area comes from the US. There are many reasons to be cautious about how transferable that evidence is to the UK setting.
The scale and demographics of non-take-up
Figure 22 gives a sense of the scale of the issue, setting out estimated take-up rates of different UK benefits. These show the share of those entitled who claim (caseload take-up) and the percentage of the money that people are entitled to which is actually claimed (expenditure take-up). Overall, in 2014–15 (the last year before universal credit roll-out significantly complicated take-up estimates), around one in seven pounds of means-tested or contributory working-age entitlements was not claimed (totalling £15 billion in 2021–22 prices). Figure 23 shows our estimates of expenditure take-up rates for means-tested and contributory benefits by family type, also in 2014–15 for consistency25.
Take-up rates differ significantly for different benefits and between different groups:
- Take-up rates are higher when based on expenditures than when based on caseload, indicating that, as expected, take-up rates are higher where entitlements are larger.
- While only half of those eligible for jobseeker’s allowance claim their entitlement, 96% of those entitled to child benefit do. These differences are likely to reflect different barriers to claiming, conditionality and possibly differing stigma. JSA claimants must prove to the benefit office that they are actively looking for work, and can lose their benefit if they do not, while child benefit receipt requires just a one-off application after a child is born.
- The expenditure-weighted take-up rate of working tax credit among those with children is very high (92%26), but among those without it is very low (41%). This is likely because eligible workers without children may not be aware of their entitlement, or because fluctuating earnings can push them into and out of eligibility, or because their entitlement is quite low making it less worthwhile to claim. Conversely, tax credit entitlement is higher for those with children, and more robust to fluctuating earnings since entitlements stretch further up the earnings distribution.
Figure 22. Take-up rates
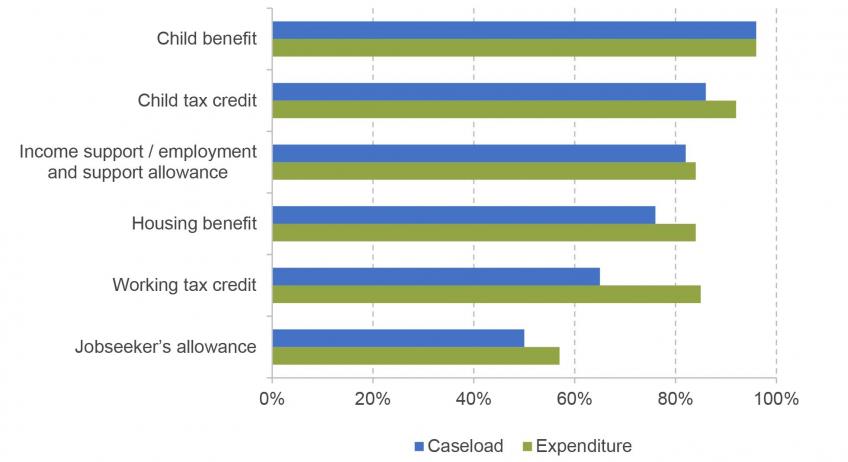
Note: All figures other than child benefit relate to 2014–15; we choose this year because very little of the universal credit roll-out had started by then, and that roll-out significantly complicates take-up calculations. The child benefit figure relates to 2011–12, because during 2012–13 the government implemented the ‘high-income child benefit charge’. While any family with a child can still claim child benefit, for higher-income families it generates an equivalent increase in tax and means that they have to complete a self-assessment tax return. It is unclear whether a family that would be subject to the full charge and does not claim should therefore be classed as ‘not entitled’ or ‘entitled but not claiming’. Child benefit caseload take-up rates are on a per-child rather than per-family basis. HMRC only provides a caseload take-up estimate for child benefit, but since there is little variation in entitlement for an eligible child, the expenditure take-up rate should be very similar and so here we simply report it as identical to the caseload take-up rate. Housing benefit statistics are for non-pensioners. The tax credit expenditure take-up rates reported are for total tax credit take-up for those entitled to both CTC and WTC (i.e. the CTC expenditure take-up rate includes WTC expenditure for those entitled to both; and the WTC rate includes CTC expenditure for that same group). This is because of the way HMRC reports the data.
Source: DWP’s ‘Income-related benefits: estimates of take-up: financial year 2014/15’ and HMRC’s ‘Child benefit, child tax credit (CTC) and working tax credit (WTC) take-up rates 2014 to 2015’.
Figure 23. Expenditure take-up rates of means-tested and contributory benefits, by family type

Note: Families are classified into age brackets by the age of the oldest person. ‘With children’ and ‘without children’ relates to dependent children.
Source: Authors’ calculations using Family Resources Survey 2011–12 and 2014–15 and TAXBEN, the IFS tax and benefit microsimulation model.
Reasons for non-take-up
The first step in thinking about how much we should care about non-take-up, and what policy approaches might be appropriate in light of it, is understanding why people do not claim what they are entitled to and who does not claim. The social science literature identifies factors that we might describe in turn as informational barriers, psychological costs (e.g. stigma; Herd and Moynihan, 2018) and ‘compliance’ costs (e.g. the hassle and time associated with filling in forms and going to jobcentres). We briefly examine the empirical evidence on the contribution of each of these reasons for non-take-up in turn. Another very recent review of this literature is available in Ko and Moffitt (2022).
Lack of information
One factor driving non-take-up which has been the subject of a lot of quantitative empirical research is a lack of information about what support is available or how the system works (though high-quality empirical evidence on this from the UK is lacking). Providing information to potentially eligible claimants about how to claim and what they might be eligible for, typically with a letter, has been found to increase take-up rates for a wide variety of transfers across many studies27. Both lack of awareness of the benefit and false beliefs about eligibility seem to be at work (Bhargava and Manoli, 2015; Engström et al., 2019). Accordingly, these studies find that letters that explicitly counter these beliefs have a – modest – impact.
Two nuances are worth mentioning. First, an important study of this sort of intervention (Linos et al., 2022) found that providing information about claiming a tax credit had no impact on the low-income households studied. One potential explanation offered by Linos et al. is that their study was targeted at those who were not filing tax returns – and so the hurdle to file a tax return in order to claim the tax credit may simply have been too great for an information intervention to overcome. In contrast, almost all the other papers in the literature examine interventions that target those who already claim benefits, pay taxes, or similar28. A plausible conjecture is that those already interacting with the government (in a way relevant to the benefit they are receiving information about) are ‘closer’ to claiming, and so can be pushed into doing so with a letter, while for those with little or no interaction with the state, who may be among the most vulnerable, the barriers to claiming may be sufficiently high that a letter has little effect.
Second, several studies, again in the US context, find that adding assistance (with form-filling) on top of information delivers significantly larger increases in take-up. This suggests that the combination of assistance and information may be important (Bettinger et al., 2012; Finkelstein and Notowidigdo, 2019).
Psychological barriers
The structure and administration of benefits can cause stigma (Moffitt, 1983), stress, cognitive overload and loss of autonomy due to complicated applications and treatment by case workers (Herd and Moynihan, 2018).
Empirical evidence on the role of psychological costs as a barrier to take-up is limited. The available evidence is focused on stigma, and finds that it does not seem to play a significant role in take-up. Bhargava and Manoli (2015) show that sending EITC reminder letters which are worded so as to try to reduce stigma has no effect, although this could be because EITC stigma is already low. Currie et al. (2001) show that allowing SNAP claimants to use a (more discreet) debit card rather than coupons has little impact. Currie (2004) offers some indirect evidence for stigma not being a significant contributor to non-take-up, including the fact that in the US take-up rates among means-tested and non-means-tested benefits are similar, despite the former presumably having higher stigma.
That said, we do have plenty of qualitative evidence that feelings of stigma exist around the claiming of benefits (see the accompanying commentary by Patrick (2023)). If these are widespread then it would be surprising if they were not having at least some impact on the number of people who choose to claim their entitlements. But this is an appropriate place to emphasise that some of the potential barriers to take-up matter even if their actual impact on take-up is modest, as the literature suggests may be the case in relation to psychological barriers. Feelings of stigma, for example, degrade the lives of people on benefits, even if those people still, on balance, choose to take up those benefits given the financial pressures they are under.
A somewhat different set of psychological factors that may influence take-up is cognitive biases in decision-making. These include procrastination, optimism bias (e.g. excessive optimism about the prospects of finding a job soon) and the perception that not claiming is a forgone gain rather than a loss (Bertrand, Mullainathan and Shafir, 2004).
There are good reasons to think that some of these biases are at work. Manoli and Turner (2014) show that reminder letters to claim EITC have a very big effect on take-up in that year, but a much smaller effect in future years – suggesting that the ‘nudge’ of the letter is more important than any new information it contains. Currie (2004) points to the fact that people are defaulted into Medicaid Part B when they turn 65, and – despite the fact that they actually have to pay (heavily subsidised) premiums – take-up is nearly 100%. This suggests some inertia and is reminiscent of the literature on pensions auto-enrolment, which suggests that people automatically enrolled into a pension scheme are very likely to remain in it even if they can easily opt out. With technology and information systems offering increasing prospects of ‘automatically’ identifying who is most likely to be eligible for support, this is an area in which some policy experimentation, allied with a careful strategy of evaluating the results of those experiments, would be welcome. The Scottish Government is beginning to do this as part of its ‘benefit take-up strategy’29, through an ‘Invite to Apply’ scheme whereby those likely to be eligible for certain support are sent a letter alerting them to this – although, as far as we aware, there is unfortunately not a systematic plan for how the impacts of this intervention will be isolated.
‘Compliance costs’
Compliance or transaction or hassle costs refer to a variety of specific aspects of the claiming process which are time consuming or burdensome.
There is much empirical evidence that the hassle of applying decreases take-up. Making claimants check in at benefit offices more frequently, or increasing the distance to such offices, reduces take-up (Currie et al., 2001; Bitler, Currie and Scholz, 2003; Rossin-Slater, 2013; Deshpande and Li, 2019); the process of having to fill out application forms dissuades people from applying, and providing assistance with those forms helps persuade them (Schanzenbach, 2009; Bettinger et al., 2012; Radford, 2012; Finkelstein and Notowidigdo, 2018), while requiring more information, making the form more complex or giving people less time to complete it reduces take-up (Bhargava and Manoli, 2015; Homonoff and Somerville, 2021). Ongoing demands placed on claimants in the form of work requirements and the application of sanctions – issues discussed further in the previous section – also reduce take-up (Moffitt, 2003)30.
The financial value of the benefit
So far, we have discussed the barriers or costs of taking up a benefit as reasons for non-take-up. But the benefits of take-up – i.e. the money received – are also clearly relevant.
A large number of empirical studies confirm this point: increasing the financial value of benefits strongly raises take-up (Anderson and Meyer, 1997; Dahan and Nisan, 2010; Whelan, 2010; Zantomio, Pudney and Hancock, 2010; Zantomio, 201531). This also implies that, at least to some extent, people not claiming what they are entitled to are aware that support is there and appear to be implicitly weighing the ‘costs’ of making a claim against the financial rewards of doing so. In other words, the ‘lack of information’ and ‘psychological biases’ explanations discussed above cannot be the whole story, though they appear likely to be parts of it.
Who is screened out?
The existence of non-take-up may impact the ability of policymakers to actually target those intended, or – more optimistically – it may help to ‘screen out’ the less needy from these programmes (Nichols and Zeckhauser, 1982), saving public funds for other uses. This area is now the subject of quite a large empirical literature.
Results are split on the crucial question of whether barriers to claiming cause benefits to be targeted more or less on the neediest. It is not surprising that there is no single answer to the question, though, given the diversity of transfer programmes, eligible populations and means of implementation. Finkelstein and Notowidigdo (2018) find that those who respond to an information intervention on SNAP are less likely to be needy – so existing barriers screen out less needy people32. Homonoff and Somerville (2021), also studying SNAP, find the reverse: having less time to recertify screens out needier groups. Deshpande and Li (2019) find that increasing transactions costs screens out needier groups on some margins (education and pre-application earnings) and less needy groups on others (disability). Bhargava and Manoli (2015) find that the effect of EITC reminder interventions is quite consistent across dimensions of heterogeneity33, suggesting that existing barriers do little screening one way or the other. It would be very valuable to build an evidence base that helps us understand more systematically the conditions under which non-take-up screens out the neediest, versus the conditions under which we may be less concerned about it.
Universal credit and take-up
Questions related to take-up are highly relevant to the universal credit reforms in the UK, since we are combining out-of-work benefits (generally considered high stigma, consistent with the evidence in Figure 12 showing greater public opposition to unemployment benefits than to others, and often with conditions/hassle attached) with in-work benefits / tax credits (low stigma, without conditions attached but possibly in future with some conditions under UC). Additionally, UC should reduce transactions costs by replacing multiple legacy programmes with a single application. It is not clear how information about UC will differ from the legacy system. The government has implemented a significant advertising campaign, perhaps improving information, although the benefit has also been subject to a string of negative headlines, potentially increasing the perceived downsides of claiming.
6. Who actually benefits from benefits?
Housing benefit and tax credits comprised about half of all working-age cash transfers in the UK prior to the introduction of universal credit. As UC combines these payments (and others) for working-age households, those strands of support are being phased out as separate entities. But it will remain the case that the system will include a component that subsidises rental costs, and will affect the financial gain to paid work, which means that changes to the system will tend to change the implicit tax on wages.
Standard economic arguments, and lots of empirical evidence, suggest that (implicit or explicit) taxes and subsidies can affect the price of the thing being subsidised – which in this context would mean rental prices or wage rates. This means that gains or losses can in the end be felt not merely by those impacted ‘on paper’ – those who are the formal recipients of the subsidy or payers of the tax – but by those on the other side of the market (e.g. the landlords letting the property or the employers paying the wages). It can also affect those who compete with those who are directly impacted by the policy. For example, an in-work subsidy for parents might increase their labour supply, driving down wages across the labour market – including for those without children.
How the housing and in-work support is shared between tenants and landlords, or workers and employers, is clearly a crucial question. There are tens of billions of pounds of resources here which, depending on precisely how the labour and housing markets work, could end up raising the incomes of the (primarily low-income) recipients they are designed to help, or could instead be effectively ending up in the pockets of very different people, such as landlords or the owners of companies who employ low-income workers.
The way in which the gain or loss is ultimately shared, after accounting for the knock-on effect on market prices, is known as the economic ‘incidence’. Simple theory is enough to indicate that it will depend on how the market in question works. In a competitive market, the determinant is the relative sensitivity (‘elasticity’) of supply and demand to the price. For example, if the supply of rented housing is very inflexible, then subsidising tenants to live in it will raise the market price: the higher subsidy will increase demand for rented housing above the level that can be supplied, so landlords will be able to charge higher prices while still filling their properties. Hence landlords will capture the gains in this scenario (if some renters are ineligible for the subsidy, then they can become worse off than if there had been no subsidy at all). In less competitive markets, the analysis is different but it is still the case that the incidence is shared by both sides of the market.
Unfortunately, given the potential importance of this issue, empirically estimating the economic incidence of taxes and subsidies tends to be methodologically challenging, and the evidence with respect to both housing support and in-work transfers remains quite scant and without a very clear consensus. It should certainly be a priority for further research. We summarise below the currently available evidence.
Tax credits
Three papers attempt to estimate the incidence of the EITC in the US. Rothstein (2008) uses variation in exposure to an EITC expansion to estimate the incidence on single women. He finds that 72% of an EITC increase is ‘captured’ by employers in the form of lower wages for low-income single women as a whole. A subsequent paper, Rothstein (2010), takes a different approach: rather than directly estimating the impact of an actual reform he instead uses estimates of labour supply and demand elasticities from the wider literature to simulate the incidence on women. In his preferred specification, 36% of the increase in EITC is captured by employers. Leigh (2010) also attempts to estimate the incidence of the credit using variation in state EITC schedules. But the effects he finds are extremely large – Nichols and Rothstein (2016) show that they amount to employers capturing 500% of EITC spending, suggesting that the methodology used may not be entirely sound in this context.
Bennmarker, Calmfors and Seim (2014) use Swedish panel data to estimate relative incidence effects. That is, they compare how wages evolve for workers who are differently exposed to a reform. But, as emphasised above, if workers compete in the same labour market then the reform will likely affect the wages of all workers, even those not directly exposed to the reform. This may explain why they get relatively small effects, with wages falling by 10–20% of the value of a subsidy. Azmat (2019) provides the only UK study of benefit incidence. She looks at the introduction of working families’ tax credit in 1999. One important part of this reform is that (unlike the system it replaced) it allowed employers to see how much subsidy employees were getting. She estimates that this fact alone reduced wages by 30% of the value of the credit, with another 8% fall induced by the fact that the reform expanded benefits. A key limitation of this paper is that it measures the gross expansion of tax credits. But in the UK, an increase in tax credits can result in declines in entitlement to housing benefit and council tax benefit, reducing the net giveaway. This is a first-order issue, with up to 85p of a £1 increase in tax credits clawed back in the form of lower benefits. It is therefore not totally straightforward to interpret the magnitude of these results.
This literature, by virtue of both its small size and methodological difficulties, does not provide us with much guidance on what to expect will happen to wages when tax credits are expanded. On balance, however, it does provide good reason to suspect that the incidence on wages is not a trivial issue and may go some way to undercutting the purpose of tax credits. More research would be extremely valuable, including on how other aspects of policy can help to ensure that the intended incidence is more like the actual incidence. The joint use of tax credits and a wage floor provided by a minimum wage would be a key example.
Housing benefit
There is also an empirical literature on the incidence of housing benefit, in a variety of housing and policy environments.
In the US, Susin (2002) compares long-run rent trends between areas where the supply of housing vouchers (which are supplied by the government and can be used to pay for rent) expanded by different amounts, estimating that the existence of the voucher system had increased the rents of non-recipients by 16% – although Olsen (2003) argues that one might be concerned that underlying rent trends differed between areas that saw different increases in housing voucher supply. Recent evidence from the US comes to more mixed conclusions about the impacts of more generous housing vouchers on rents (Eriksen and Ross, 2015; Collinson and Ganong, 2018). A small body of evidence from outside the US has found that a substantial share of the incidence of more generous rent subsidies falls on landlords, in the form of higher rents (Laferrère and Le Blanc, 2004; Fack, 2006; Viren, 2013; Grislain-Letrémy and Trevien, 2014; Sayag and Zussman, 2015).
Two papers have looked at this issue with respect to the UK’s housing benefit. Gibbons and Manning (2006) looked at a cut to HB in the mid 1990s that applied only to new claimants, and affected those with the highest rents among households of their size in their local area. They estimated that 60% to two-thirds of the incidence of the cut was on landlords.
Most recently, Brewer, Browne et al. (2019) studied large cuts to HB for private renters in 2011 and 2012. They found, overall, very little short-run impact on rents, but they did find more impact for certain small subgroups – namely, those who were previously treated relatively generously by the system and for whom better housing at the margin may have been more of a ‘luxury’ (implying relatively elastic housing demand, and hence more incidence on landlords) than for the average recipient. That paper argues that this might explain some of the variation in the findings of other papers. Many of the non-UK European studies, which tend to find substantial incidence on landlords, studied extensions of housing subsidies to specific groups that might be expected to have highly elastic housing demand (e.g. students). When Brewer et al. restrict attention to groups who plausibly share that characteristic, they get more similar results, i.e. higher incidence on landlords. In addition, the Gibbons and Manning UK study had looked at a previous cut to HB at a time when the system was more generous and hence would have had impacts further up the distribution of housing quality.
Before ending this section, it is worth joining the dots from two of the takeaways above. First, though the precise sharing of incidence remains unclear, it is likely that a non-trivial fraction of the gains from housing and in-work support does end up with people other than the intended low-income tenants and workers. Given the huge expenditure on these strands of support, it is even more likely that a non-trivial amount of resources in absolute terms (even if a small fraction) is ending up with people other than the intended beneficiaries, as well as making non-subsidised renters or workers worse off. Second, the balance of incidence is not a universal constant – it is going to depend very much on how the housing and labour markets work. In combination, these considerations highlight the value of making policy in a joined-up way. If, for example, in-work support reduces wages, that effect can be limited by combining the policy with the use of minimum wages. Here we start to tread on the territory of other parts of the Deaton Review. But, for our purposes, the key point is that the impacts of the welfare system can interact in crucial ways with things such as trade union policy or minimum wages – very much contrary to some of the political narrative of recent years, which appears to have seen in-work transfers and minimum wages (in particular) as alternatives to each other, rather than complements.
7. Making the payments
There remain a number of issues relating to how the system actually operates and is administered. These are very often abstracted from in policy-related research (particularly, perhaps, in economics). But the purpose of this short section is to flag some of these questions, referring to more detailed work on them that can be found elsewhere, while also arguing that these can in fact be of first-order importance if the system is actually to achieve what is intended and is to adequately account for the experience of people using that system. In other words, abstracting from these questions is generally not a tenable approach when actually designing a policy framework, and mistakes here can really undermine broader goals.
The wait to receive the first payment
One key issue, especially in the current UK context, is the timing of the first payment after a benefit claim begins. Under the legacy system, 33–41% of new claimants to jobseeker’s allowance would have their claim processed within just 5 days, 62–89% within 10 days, and virtually all within 21 days34. But as a result of the universal credit reform, there is now by default a ‘five-week (i.e. 35-day) wait’ between a claimant applying for the benefit and them receiving their first payment (though loans are available to help cover this period). Most of that five-week period is due to an early ‘administrative’ choice (made to avoid over- or under-payments) to pay benefits in arrears, meaning that the government ‘waits’ for a month to receive income information before calculating entitlement and making the payment. This has caused many unpleasant stories about vulnerable families experiencing hardship and resorting to food banks or private loans taken on unfavourable terms while waiting for their support to arrive35. It seems to have been one of the main contributors to the difficult time that UC has had politically during its roll-out and to a more general (and we would argue confused) perception that the whole direction of reform has been undesirable.
Clearly, the period between the event that generates benefit eligibility (e.g. losing one’s job) and the first payment being received can be a particularly difficult one for families who have little savings. Around a quarter of households on benefits have less than £250 of gross liquid wealth, and about half have less than £1,00036. The financial precariousness of this period can be accentuated by the fact that it typically takes time to adjust key living costs such as housing in order to bring them more into line with the new level of resources. Given that one of the primary functions of the benefits system is to provide insurance or, as economists would often put it, to help people smooth their consumption in light of a shock, an overly-long waiting period clearly has the potential to severely undermine part of the purpose of the system – especially in a dynamic economy where people frequently come onto and off benefits.
Delestre et al. (2020) examined this issue in the context of the COVID-19 crisis. Using anonymised bank account data from a budgeting app, they compared new UC claimants with those who looked similar before the crisis but who saw no change in their income. Relative to the control group, the spending of UC claimants falls prior to the receipt of the benefit, as expected. But after the benefit is received, about 40% of that gap is closed – indicating that the short-term lack of liquidity had negative implications for living standards, over-and-above the fall in living standards implied simply by the difference between prior earnings and UC entitlement. The importance of delays is also seen in that same research in the wait during the crisis to receive a grant from the Self-Employment Income Support Scheme. Claimants of the grant saw their spending fall by 13% during the wait, relative to households who looked similar pre-crisis – but after the support arrived, that entire gap was closed37.
What can the government do about this issue? Some sort of waiting period is necessarily going to occur for a benefit that pays in arrears, because the payment comes after the assessment period is over. To entirely avoid a wait period, then, UC would have to be paid in advance and based on expected income – but that creates the spectre of overpayments, occurring when a claimant’s actual income turns out to be higher than expected. The recouping of overpayments has caused hardship and political difficulty of its own in the context of tax credits. If, for this reason, the government wants to pay UC in arrears, loans look to be a reasonable way to address the wait period issue. This is in fact what the government has done with the ‘advances’ system where claimants are paid a loan after making their claim, which is paid back in the form of lower benefit payments subsequently. Further alleviation of the difficulties of the five-week wait may be available by tweaking the advances system – for example, by making the loans opt-out rather than opt-in or by recouping them more slowly. The government could go even further and turn the advances into non-repayable grants, though some have argued that this may open the system up to fraudulent claims38.
Assessment periods
Another example of a ‘detail’ that one might be tempted to abstract from is the period of time over which a claimant’s circumstances are assessed in order to calculate their entitlement. For a means-tested benefit, the government has to decide what period to measure people’s income over (e.g. a week, month or year). This can have important effects, in terms of both who actually ends up getting supported and the experience of individual claimants and their families from period to period.
Again, the UC reform has brought this issue into some focus in the UK of late. Historically, we have had out-of-work ‘safety net’ benefits with very short assessment periods of one or two weeks, so that they could respond quickly to prevent short-term hardship, which is a big part of what they are there for – but this comes at the ‘cost’ of giving some money to people who in the longer term will not be poor39, focusing a smaller proportion of the budget on those in persistent poverty. Meanwhile, alongside this, we have had tax credits with annual assessment periods, so that they could focus on topping up the income of those with more persistently low incomes rather than changing with every fluctuation in circumstances from week to week (meaning, for example, that a couple of weeks of very low income within a year would not materially impact tax credit entitlement). In other words, because these different strands of support were trying to do different things, the government – quite reasonably – designed assessment periods differently for each40.
Because UC integrates these strands of support, the government has effectively had to choose just one assessment period for both. That has created something akin to a Gordian knot. We have ended up with a monthly assessment period. This reflects a choice in the face of the trade-off between providing income to those who might spend a short period on low earnings and suffer hardship as a result, and ensuring that the system focuses support on those in persistent poverty (rather than temporary poverty). The monthly assessment period means it is less responsive to short-run spells of unemployment than the old out-of-work benefits – which in particular has largely caused the ‘five-week wait’ period described separately above. But at the same time, this has made the system more responsive to short-lived fluctuations in earnings than tax credits were.
This choice of assessment period is of particular importance for those with fluctuating earnings – especially common among the self-employed and gig workers. If a claimant’s earnings fluctuate between one month and the next, they can receive significantly varying amounts of benefits, or even lose their benefit entirely in a high-earning month and have to reapply. It is also possible for someone with fluctuating earnings to receive more or less than someone with stable earnings even if, on average, they earn the same amount.
This last point has caused the government to worry about the potential for fraud or manipulation in earnings reporting (probably more plausible for self-employed claimants than for employees), and to introduce a somewhat messy measure to try to counteract that – the ‘surplus earnings rule’. The full rules are complex, but in short: if a claimant’s earnings increase enough to render them ineligible for UC, the government records their ‘surplus’ earnings (i.e. the difference between the level of earnings that would make them just ineligible for UC and their actual earnings) and incorporates that in future assessments of UC eligibility41. This approach has bizarre effects: in particular, sometimes families are incentivised to make an application for UC in the full knowledge that they will be rejected42.
The general point here is that choices of assessment period are not just something of operational consequence, even though they rarely feature in policy analysis. They will impact both how well the system is able to help people smooth their consumption in the face of fluctuating circumstances, and the degree to which it focuses resources on those who are poor for longer periods – with important trade-offs between precisely those two objectives.
Who gets the payment when a benefit is for a couple?
We have largely referred to the family as a single unit, and for many purposes that is an acceptable simplification. But different individuals within a family may have different interests, and may weigh their own interests ahead of others, and there may be an imbalance in who has financial control within the family. For this reason, who the benefit is actually paid to could have important effects. While clearly some spending that a couple do benefits both of them (e.g. rent), other spending only benefits one member (e.g. clothing). So, if the couple maintain somewhat separate finances, paying the benefit to one member could enhance their living standards more than the other’s and could affect the balance of financial power within the family. There could also be implications for the children – perhaps one parent might choose to allocate more of the benefit to the children than the other. There is some empirical evidence on these matters43. Lundberg, Pollak and Wales (1997) examine the switch in the UK from paying child benefit to the father to paying it to the mother. They find that this coincided with a higher budget share on women and children’s clothing. On the other hand, Benhassine et al. (2015) find that in an experiment that randomly paid a cash transfer, tied to education, to families in Morocco, making the payment to mothers or fathers made little difference to child educational outcomes.
Again, this issue comes to the fore in universal credit. Under the legacy benefit system, it was possible for some benefits to go to one member of the couple and some to go to the other. But under UC, the whole payment goes to one bank account (which can, but need not be, a joint bank account), nominated by the applicant. The Scottish Government has allowed UC payments to be split between partners, but in the rest of the UK such splits are not allowed44
8. Effects on the next generation
Another area of recent research has been the effects of welfare on outcomes for the children of recipients of these benefits (see Hoynes and Schanzenbach (2018) for a recent review). Evidence here is currently limited, and virtually non-existent in the UK, but evolving. There are two broad ways that benefits might have long-term effects on children. First, by providing more income to the families, the children may get better nutrition, housing and, in some cases, healthcare. These could all have positive impacts on the child’s attainment at school and broader development, with potentially long-term implications. Second, parents engaging in the benefit system and – to the extent that benefits reduce hours worked – lowering their labour supply could change the norms and values that their children grow up with. Both changes in income and changes in labour supply could also change the kind of childcare (parental, or external) that the children receive. These effects could all have impacts on the choices that the children make in adulthood. These effects matter because they have the potential to significantly magnify the value and costs of benefit programmes – meaning that estimates that look only at the immediate recipients of the policy could significantly underestimate its effects.
The key takeaways from this literature are:
- Ignoring the long-run benefits of the programme can dramatically underestimate the value of the programme. In fact, Hendren and Sprung-Keyser (2020) find many examples of policies that ‘pay for themselves’ fiscally in the long run, particularly where they support children.
- Intergenerational considerations add another layer to the ‘insurance versus distortion’ discussion in Section 2. For example, if additional support for families with children increases child human capital development and future outcomes, or indeed helps them learn about how to navigate the welfare system during times of need, then it also provides protection in the long run against low income. On the other hand, if it changes the child’s attitudes towards benefits and work as adults, it could exacerbate distortions in the longer term.
- Such issues raise the particular importance of benefits tied to children. As discussed above, much of the increase in UK benefit spending in recent decades has been targeted at families with children. Understanding the impact of such spending on intergenerational effects is a key part of evaluating these policies.
- The existing literature does not provide a clear result as to the relative magnitude of intergenerational benefits for children targeted in early versus later childhood. Results from the food stamp programme show benefits concentrated among children under 5 (Hoynes, Schanzenbach and Almond, 2016; Bailey et al., 2020), but the available evidence for the EITC shows larger long-run benefits for children exposed in later childhood (Bastian and Michelmore, 2018).
- It is also possible that parental benefit receipt causes future benefit receipt among children, though robust evidence on this issue is thus far quite limited. Dahl, Kostøl and Mogstad (2014) find that in Norway a parent being awarded disability insurance (in virtue purely of their application being randomly assigned a more lenient judge) causes an increase in future disability receipt among their children. They provide evidence that this is partly due to children of parents awarded disability insurance perceiving a greater likelihood of success if they apply45.
As mentioned, very little of the evidence on these issues is drawn from the UK. Building a UK evidence base could significantly aid policy design.
9. Implications for universal credit
As explained, universal credit is the largest reform of UK working-age benefits in decades, and its roll-out is ongoing. Many of the issues we have touched on are relevant when thinking about the effects of this reform, and so here we briefly collect the key observations about the likely impacts of UC that we have touched on throughout the chapter, supplemented with other evidence we have, and consider changes to the system that might improve its design.
Given that UC’s original aim was to ‘make work pay’, it is natural to ask what its effects are likely to be on labour supply. Despite the obvious importance of this issue, there is relatively little evidence here. What evidence we do have does suggest that UC will increase employment rates, in particular among lone parents. However, that increase is likely to be heavily concentrated in part-time jobs. This is important because, as discussed throughout the chapter, part-time jobs do little to build the kind of human capital that generates longer-run career progression. Thus, much of this employment increase is unlikely to be a stepping stone to claimants entering higher-paid jobs and perhaps getting off UC altogether over the longer term. One way of addressing this would be to focus further changes to UC’s structure on measures that increase the financial gain from moving from part-time to full-time work, such as reductions in the taper rate (although this would, at least in the short term, be less progressive than many other ways of changing UC).
Another way that UC may affect employment is through the expanded use of work-search conditionality. Whereas under the legacy system, out-of-work claimants could receive housing benefit and tax credits without any conditionality so long as they did not also take up jobseeker’s allowance, the integrated nature of UC makes that impossible. UC also expands conditionality to more lone parents and, for the first time, to claimants in work with low earnings. Conditionality for lone parents is effective at getting people into work – though, again, typically into part-time jobs. In-work conditionality seems to have had positive, but fairly limited, effects on progression thus far, meaning that this aspect of the reform is unlikely to have significant long-term effects in its current form.
UC is also likely to affect benefit take-up in several ways. First, whereas under the legacy benefit system claimants could potentially be entitled to three benefits each requiring their own application, under UC they will only have to apply for one – making it easier to receive their full entitlement. Second, UC makes it easier to claim one’s entitlement as one moves into and out of work. Under the legacy system, a family that became entitled to a new benefit for a short period (e.g. jobseeker’s allowance when briefly between jobs) or for a small amount (e.g. a small amount of tax credits when entering work) might not claim. But under UC, so long as they are already in receipt of the benefit, they can continue claiming with an adjusted entitlement, with little or no active input from the claimant. Third, as discussed above, UC applies conditionality to more people – and is therefore likely to reduce take-up since it makes claiming more of an ordeal. Fourth, UC might change the stigma of claiming benefits. Here the effects are ambiguous. It is unclear whether the stigma associated with UC will be more like the (relatively high-stigma) out-of-work benefits that it replaces, or the (relatively low-stigma) tax credits. If the level of stigma is more like that associated with tax credits, then UC might boost take-up rates. But this is a key uncertainty, and a heavily stigmatised UC could result in lower take-up than benefits under the legacy system. The government’s branding and communications around UC may well contribute to which way the stigma effect goes (an accompanying commentary from Patrick (2023) gives a pessimistic take on this issue).
The assessment period – the length of time over which incomes are measured for calculating benefit entitlement – is the subject of another change brought about by UC. Under the legacy system, the assessment period varied by benefit, from a week or two for out-of-work benefits, to a year for tax credits. UC’s assessment period is one month. This can create a particular problem for those in work with non-monthly earnings payment schedules. For example, workers paid four-weekly have one month a year when they receive two payments, substantially reducing their UC entitlement or even ending their claim. This is not a minor issue – only about half of UC claimants in work are paid monthly (Foley, 2017; Tomlinson, 2018). Allowing claimants a little flexibility in their assessment period – for example, letting them choose whether it be monthly or four-weekly – could go a long way to making UC a much easier experience for many claimants, with minimal fiscal consequences.
The monthly assessment period is also the cause of what is surely the most controversial part of the UC reform: the ‘five-week wait’ between a claimant’s application to the benefit and their first payment. Simply ‘ending’ the five-week wait is easier said than done – it is the logical consequence of a benefit with a monthly assessment period paid in arrears. The government has chosen to mitigate its effects by offering loans, repaid with lower benefit payments in subsequent months. This is a reasonable response, though the continuing reports of difficulties associated with the wait suggest that the loans are not getting to everyone who would benefit from them. Making them opt-out, rather than opt-in, would be an obvious option. Turning them into non-repayable grants, as has been suggested by some (e.g. the House of Lords Economic Affairs Committee and the TUC46), would certainly have the most clearly ameliorative effects, though with heightened risks of fraud. Robust evidence on the impact of the five-week wait is still lacking, making it hard for policymakers to know how much resource should be allocated to the issue.
Lastly, recall that UC’s fundamental design principle is integration – and there really are good reasons for wanting that, including the removal of arbitrarily-high work disincentives caused by overlapping strands of support that had been layered on top of each other over time. But the government has significantly undermined the pursuit of integration by leaving one of the key means-tested benefits – council tax support – out of UC and instead left it under the control of local councils. As a result, once this is factored in, UC’s work incentive advantages over the legacy system are more modest: one in eight workers on means-tested benefits will still have a marginal tax rate in excess of 75%. Had council tax support been integrated, that figure would be essentially zero. There are arguments for enabling local decision-making, though one would have to consider those very significant to warrant undermining the rationalisation of work incentives that was a central goal of the universal credit reform.
10. Current policy issues
Stepping back, given the evidence presented in this chapter, what reforms might the government consider to the transfer system?
Incentivising part-time and full-time work
An increasing amount of our welfare system is supporting in-work families on low earnings. Part of the strategy over the past 25 years has been to incentivise work – as seen in the introduction of modern tax credits from the late 1990s, the increased use of conditionality for single parents from the late 2000s, and the introduction of UC. This strategy has clearly had some success – but, time and again, this has largely been in encouraging people into part-time, low-wage work that has only a modest effect on current family income. And disappointingly, such work generates little long-term pay-off when it comes to career progression.
This means that, rather than transfers being a stopgap or a stepping stone towards something better, they can end up supporting people for long periods of their lives. There is an overlap here with other areas of the Review: tools such as education, skills and labour policy should also address progression at the bottom end of the labour market. But there is also a strong case for welfare policies considering the type of work that claimants move into, rather than focusing on just getting them into any job. Most concretely, this could be done by incentivising full-time work (or at least disincentivising it less). As we discussed in Section 4, reforms that do this (such as reducing the taper rate in UC) can end up costing the government considerably less in the long run than one might expect, because the increase in human capital and wages from full-time work rebounds to the government in the form of higher tax receipts and lower benefit outlays.
Self-employment and the gig economy
There has been a steady increase in self-employment both overall and among benefit recipients. A more recent phenomenon is the rise of ‘gig’ work. There is variation both in how it is defined and in its estimated magnitude, but there seems little question that developments such as the emergence of platform technology have changed the nature of work available in the low-skilled labour market.
This has potentially far-reaching implications for policy and for inequality, discussed elsewhere in the Deaton Review. But what issues does it raise specifically for the benefits system? In systems that rely more heavily on the contributory principle, one difficulty is that rises in self-employed or gig workers mean a growing group who are not accumulating the same contributory benefit entitlements as employees. Taking the UK’s heavily means-tested system as given, that is a more minor issue, though it would pose a serious challenge to efforts to reinvigorate the contributory principle47.
However, there are respects in which the changing nature of work makes UK benefits policymaking more difficult.
First, because it is harder to accurately monitor the circumstances of the self-employed, it becomes harder for the system to treat everyone fairly. Under the legacy system prior to the introduction of UC, where working tax credit was available to those who reported working at least a certain number of hours, there was always understandable concern that actual hours of work were harder to pin down, and to monitor, for the self-employed than for employees. Under UC, there are no ‘hours rules’, but there is an earnings-based rule for the self-employed which effectively caps their UC entitlement at the level they would get if they were working a certain number of hours at the employee minimum wage (even if in fact they are earning less than that, or indeed nothing). The result is that self-employed workers whose business makes no money are entitled to significantly less in benefits than if they were unemployed and complying with work-search requirements. One of the purported functions of this so-called ‘minimum income floor’ (MIF) is to prevent unproductive or very low-intensity self-employment from being used as a tool by which to avoid the work requirements imposed on others. But a consequence is that some people in self-employment and on a low income are treated very stingily by the benefits system. There is a 12-month ‘grace period’ in which the MIF does not apply, in recognition that ultimately-successful businesses can take a while to start making money. But of course there is nothing magic about the 12-month threshold: some viable businesses will take longer than that. And some people working hard for little reward in self-employment might not be able to get an employee job in their current local labour market. In short, the rules are an imperfect compromise.
Relatedly, there is a fundamental difficulty with how to operationalise conditionality at all in a world in which large numbers of people could in principle begin working on a gig platform at any moment. Conditionality in the UK at the moment only relates to employee jobs – an out-of-work claimant can be sanctioned if they turn down an employee job, but not if they turn down self-employed work. If non-traditional forms of employment continue growing as a share of the low-wage labour market, this distinction will become increasingly difficult to maintain: why should a claimant be punished for rejecting a job offer at a supermarket, but not for failing to sign up to a gig platform, at least if the two offer similar rates of pay? One answer could lie in the differences between the wider conditions of the jobs, such as demands for flexibility and certainty of hours and income, but the distinction between gig work and traditional employee work is not a perfect predictor of those conditions. It is hard to believe that the current approach of essentially ignoring the self-employed sector will be tenable if recent trends continue.
Finally, as discussed in Section 7, the length of assessment period is of critical importance for those who have fluctuating incomes – which self-employed and gig workers often do. The rise of these forms of work therefore makes this choice over assessment period length all the more important. To the extent that self-employed workers experience significant declines in living standards during times of low earnings, that makes the case for shorter assessment periods; to the extent that they are able to smooth their consumption during those times by drawing on savings built up in higher-earning periods, that makes the case for longer assessment periods. Evidence on how well low-income self-employed workers do in fact cope with fluctuating earnings would be very helpful for evaluating the case for longer or shorter assessment periods. The reality, of course, is that this will vary, and so designing a single policy framework will again involve difficult compromises and trade-offs.
Support for those with and without children
There have been big changes to the relative support provided for families with and without children. For example, in 1975–76 the basic entitlement for a couple with two children out-of-work was 38% more than that for an equivalent couple with no children. By 2019–20 that difference had risen to 132%. This gap is a consequence of deliberate policy goals to focus on child poverty. There are many plausible justifications for a greater level of support for families with children – for example: to compensate families for the costs associated with children; in view of the long-run returns discussed in Section 8 from directing benefits to those with children; or because governments might have a greater level of concern about the living standards of children since they have no control over their circumstances (see Adam and Brewer (2004) for a longer discussion). We do not take a stand on whether the actual gap in support between those with and without children in the UK is too large or small. But it is notable that the consequence of policy decisions has been that out-of-work support for those with children has roughly grown in line with earnings over the past half-century, whereas for those without children it has grown in line with prices. This is surely part of the reason that the poverty rate for working-age non-parents has grown relative to the rest of the population, although it still remains lower. If the patterns seen over the past several decades repeat themselves, it would not be surprising to see the working-age non-parent poverty rate exceed that of others.
Insurance, earnings-related benefits and the contributory principle
The UK benefit system provides relatively little in the way of insurance against unemployment – that is, when people lose their job, they usually see a significant and immediate fall in income. This is partly a feature of the lack of earnings-related support offered in the UK, which instead relies heavily on means-testing, as discussed in Section 2, with entitlements based almost entirely on current family income48. It also partly reflects the relatively low level of out-of-work support the system offers, compared both with other developed nations today and with the UK in the past. It was partly the lack of insurance available in the system that was the impetus for the government’s headline economic response to the pandemic – instituting the Coronavirus Job Retention Scheme (CJRS), which allowed firms to place employees on furlough and have 80% of their normal earnings paid by the government, and the Self-Employment Income Support Scheme (SEISS), which paid self-employed workers affected by the pandemic a portion of their historical profits. Unlike the normal benefit system, the amount of support one gets in both of these schemes is explicitly related to prior earnings, thereby providing significant insurance.
While settling the means-tested versus contributory benefit debate is beyond the scope of this chapter, the very low level of insurance against job loss that we provide to many kinds of people is at least worth another look, and there are ways of addressing it that would not involve a highly complex root-and-branch switch to a contributory system so soon after all the upheaval of UC.
The case for some form of higher benefit early in one’s claim (as recently proposed by the Institute for Government and the Social Security Advisory Committee (2022)), when living costs are hardest to adjust, is strengthened by the fact that the system has, over the past decade, increasingly moved to linking support for children and housing to measures of ‘reasonable’ (in the government’s judgement) rather than ‘actual’ costs (discussed in Section 3). For example, private renters can now only get support for housing up to the 30th percentile of rents in their local area. This makes much less sense in the short run than in the long run: some costs are very difficult to adjust in the short term even if easier in the long term, so the distinction between ‘reasonable’ and ‘actual’ costs is blurry in the period immediately after people experience a negative shock to their incomes. Benefits that are higher at the beginning of a claim would therefore finesse how the ‘reasonable’/‘actual’ distinction is put into operation. Moreover, precisely because such circumstances are difficult to change in the short run, insurance at this point is especially valuable to people. One could also introduce an earnings-related component of the benefit system. For example, contributory JSA could be paid at a fraction of the worker’s previous earnings (up to some cap) for a short period, as proposed by Brewer, Handscomb and Shah (2021). This would provide insurance to those who lose their job but have a partner who remains in work (whereas simply tweaking the existing system to have a higher entitlement early in a claim would still not reach many with working partners).
Universalism
A concern throughout the pandemic, but especially early on, was that some people might ‘fall through the cracks’. For example, employees who simply lost their jobs instead of becoming furloughed could not benefit from the CJRS; self-employed workers who had recently started their business were ineligible for SEISS; and some families did not claim UC despite being entitled, perhaps because of hassle, social stigma or lack of awareness49.
The common theme here is that the barriers to support are too high – for individuals and families with few resources, either they are outright ineligible for programmes or it is too difficult for those who are entitled to claim. This has led a number of commentators and politicians to call for a greater degree of universalism in the benefit system – in particular by introducing a universal basic income (UBI).
Proponents suggest other advantages too, often emphasising quite different things depending on what political perspective they are coming from. For example, on the right, a UBI is often held up as advantageous because the lack of targeting means avoiding steep phase-outs of support and the associated work disincentives. Meanwhile, on the left, the lack of conditions (in particular work-search conditions) implied by a truly ‘universal’ payment is often seen as attractive because it ensures that everyone can have a minimum amount of ‘leisure’, or more accurately non-market time, and this is a basic good that everyone should have some of. Other common arguments in favour include making up for perceived inadequate current or future wages and reducing stigma and other barriers to claiming (Hoynes and Rothstein, 2019).
The debate about UBI can be quite confusing, especially because many proposals – and indeed many actual policy experiments – are given this label even though they are not pure UBI policies. For example, very often, alleged UBIs are not universal because they are still means-tested in some way or still conditional on fulfilling work-search requirements. Some of the arguments in favour of a UBI can reinforce the confusion. For example, getting rid of conditionality would indeed protect people’s time for non-market-related activity, but this does not get you to a UBI – you can have a means-tested payment with or without conditionality. With this in mind, below we discuss what we view as the idea of a genuine UBI50.
A UBI would likely have little stigma since receipt would be widespread. This would be expected to lead to high rates of take-up51. Thus no one would fully ‘fall through the cracks’ since almost everyone would always be in receipt of some support. Key questions are what level that support would be at and what other changes to the tax and benefit system would be made to pay for it.
One option would be to pay for the UBI by paring back the existing system. As an illustration, one extreme option would be to abolish the entire £100 billion working-age benefit system to pay for a flat untaxed payment to all working-age adults of roughly £2,400 per year. Such a change would be enormously regressive relative to the current system which, as shown by Figure 7, provides much more support for poorer households. This is true for every subset of benefits as well – and so even UBI proposals that envision keeping some part of the existing system (e.g. housing and disability benefits) would still target a much smaller share of support on those with the lowest incomes. Even among households with similar incomes, targeting towards needier households would worsen, since those with high housing costs or disabilities would get no more than those without (Hoynes and Rothstein (2019) provide calculations on the amount of regressivity of such a change in the US case).
At the opposite extreme, the current means-tested system could be kept, with a UBI added on top, paid for with increases to taxation. If the aim of the UBI is to be enough to provide a minimum standard of living on its own (i.e. so that no one falls through the cracks), then this would likely be hugely expensive53. For example, if a UBI were given to all working-age adults at the single person’s JSA rate (around £4,000 per year) it would cost about £160 billion annually53. Paying for this would require a colossal increase in tax rates. For comparison, increasing the basic, higher and additional rates of income tax by 1 percentage point raises about £6 billion per year (Adam and Waters, 2018). Such enormous increases in tax would also weaken work incentives, undercutting one of the key putative advantages of a UBI.
In our view, the most coherent kind of UBI proposal in principle would involve a radical overhaul of both the benefit and tax systems at the same time. And we would emphasise, more generally, that to evaluate any UBI proposal properly one does need to consider very carefully the concomitant changes to tax – something that is often not spelled out by UBI’s proponents, though also often abstracted from a little too casually by critics (perhaps because so many actual UBI proposals do not spell out the implications for tax, and can be easily dismissed on that basis).
In principle, it is in fact perfectly possible to provide an income floor through a UBI rather than a means-tested payment, while paying for it purely through a redesigned tax schedule, rather than – as we do now – through a hybrid of implicit taxation (due to means-testing) and actual taxation. There is no fundamental reason why it would be harder to design a system that pays for itself in that way than in the way we currently do – actual average effective tax rates could remain unchanged. And if you are worried enough about the problems of administration, stigma and take-up associated with means-testing, you might well be attracted by a sweeping reform that would finance the income floor through more explicit taxation and less implicit taxation (i.e. means-testing).
The practical obstacle to this approach is that the benefit system takes into account much more information about the family than the income tax system and so is able to be much more targeted54. This is partly because the modern UK income tax system is (almost) solely concerned with the individual’s income, whereas the benefit system looks at the family’s income. But it is also because the benefits system accounts for variations in needs arising from housing costs, children and disabilities, as well as variation in resources arising from assets. There is no law of nature which says that the tax system could not do all of these things instead, if we wanted it to. But making such a change would itself be a transition of vast complexity, and this is not – as far as we are aware – something that any real-world UBI proposals are explicitly making a case for. In practice, therefore, it is very hard to see how a UBI reform would avoid significantly weaker targeting of support on the neediest. Proponents would say that this targeting inextricably brings with it many of the downsides of means-testing, and so getting rid of it is, on balance, advantageous. But at a minimum we must acknowledge the huge potential consequences for how large a share of the welfare budget is going to the poorest – something that many arguments in favour of a UBI, at least in popular discourse, fail to do.
Finally, we would point out that the idea behind the UC reforms in the UK was to try to reduce some of the classic downsides of means-testing, such as incomplete take-up, extremely weak work incentives, administrative complexity and stigma. UC remains very much a means-tested benefit, so it is important not to over-claim in relation to its advantages: the classic trade-offs associated with means-testing are going to remain, even if the edge can be taken off some of them. But the background of this already-radical overhaul in the UK does seem relevant when contemplating something as radical as a UBI, particularly when there is some overlap in the goals of the two reforms. With or without more universalism in our system, there is the crucial task of making UC work as well as it can.
Benefit indexation
Although it never sounds the most exciting part of benefits policy, the default indexation of benefits – what happens to their value each year if the government takes no deliberate action – is a first-order issue over the long term, and even over the short term when inflation is high. Over multiple years, it can transform the size of the system with little ‘active’ decision-making by policymakers. This can be seen in the level of out-of-work support for families without children. For the past half-century, this has generally simply gone up with prices, meaning that as a share of average earnings the single person rate has declined from 23% to 14% (Bourquin and Waters, 2020)56.
Almost all of the working-age system in the UK is indexed to prices, meaning that, without discretionary policy changes, those relying entirely on benefits see their living standards constant over time but falling behind the rest of the population; moreover, the insurance value of benefits – the share of earnings that benefits replace upon job loss – steadily declines. A government that wanted to ensure that those on the lowest incomes keep up with society as a whole, or that the insurance against job loss that the system provides remains constant, could instead index benefits to average earnings. One downside of that may be due to the political economy of policymaking. Indexing benefits to earnings means that the benefits bill would remain roughly constant relative to national income, and hence fiscally sustainable, by default. But this would mean that each time the government actively decided it wanted to increase the generosity of the system to a particular group, it would have to either cut support for another group (which is politically difficult) or accept a general tendency for benefits to drift ever-upwards as a share of national income. Of course, a government could chart a course in between these alternatives and their trade-offs by choosing an intermediate option, such as uprating benefits with the average of earnings growth and inflation.
We have recently been reminded that, at times of rapid economic change, indexation policy can not only shape the long-term direction of the system, but also affect how well the system actually insures people against shocks from month to month or year to year. At the time of writing, consumer price inflation over the 2022–23 financial year is expected to be 10%, but benefits are only 3% higher than in 2021–22, meaning a 7% real fall year on year. This is despite the fact that the intention is explicitly to raise benefits in line with inflation. The discrepancy arises because benefits are uprated each April in line with inflation measured to the previous September, meaning that sharp changes in inflation after September can knock real benefit levels away from their ‘intended’ level for 18 months. Central to this seemingly unnecessary anomaly is the fact that the government’s old computer systems do not allow for benefit levels to be changed at short notice. Thankfully, this constraint is no longer present under the UC system, and the government should leverage that advantage by updating its indexation policy. This would be a well-overdue reform: back in 1983, Baroness Jeger, a member of the House of Lords, lamented the six-month gap between the decision and implementation of benefit uprating, and asked the then Parliamentary Under-Secretary of State for the Department of Health and Social Security, ‘Could we not with modern technology get a shorter gap? We know all about the computerisation that is supposed to be coming in in 1984–85. Can we not get something closer between the forecast and the implementation, or is everybody still sitting around with pens and pencils at the Elephant and Castle and the other places?’57.
11. Conclusions
We now offer some brief concluding thoughts, reflecting on the evidence summarised in this chapter. We do not systematically recapitulate the key findings (see the executive summary for this), and nor is it our goal to reach policy recommendations, as this is part of the evidence-gathering phase of the Deaton Review.
The slightest glance at what the transfer system is doing, and how it has evolved over time, tells you that policy in this area is inseparable from wider economic and social policy. The UK’s transfer system is largely there to patch up problems that we have not found better ways of addressing, from low pay to high housing costs to ill health and its effects. When those problems get larger the transfer system’s job gets harder, and when social ills ease – as has happened with unemployment – the challenges facing the transfer system get a little smaller. We have focused in this chapter on what transfer policy can do, and is doing, but in the process we have highlighted a key point of the wider Deaton Review: we must coordinate thinking across key policy areas.
This point also runs deeper than simply saying that transfer policy is a backstop if other policies fail. The effects of transfers depend on policy in other spheres. The potential for in-work transfers to end up benefiting employers is different if there is a minimum wage below which employers cannot pay. If labour market and skills policies are successful in boosting career progression routes for low-skilled workers then the long-term impacts of job-search conditionality, or of financially incentivising people to take a job, will be different. Different parts of government must work together on this.
When it comes to the impacts of various transfer policy choices, there are some things we know quite a lot about. These include the distributional impacts from a financial point of view, and the impacts on patterns of paid work – at least in broad-brush terms and at least in the short term. There are other areas where we know less but have begun to acquire a better evidence base than we used to have, and where there is probably scope for policy development to catch up a little with the insights from social science. In particular we have in mind the crucial question of how the transfer system can support wider efforts to improve long-term career progression prospects for those with limited skills.
Finally, there is a set of issues on which we are in great need of further evidence. In-work transfers and housing benefits are effectively large subsidies to parts of the labour and housing markets, and we still do not know with confidence which side of those markets they benefit most, or (crucially) what this depends on – even though the policy intention is clearly to benefit the employee and tenant sides. In the UK, we still have little evidence on the intergenerational effects of transfer provision for families with children, which would be among the most profound possible effects of transfer policies. And the scope for increasing take-up of benefits in different ways, and the beneficiaries of that, is still little understood. This is an area in which careful policy experimentation and evaluation looks increasingly valuable, in part because IT developments are making automation of payment, or of alerts about eligibility for payments, a more realistic possibility, and we do have evidence that information provision and ‘nudges’ can increase take-up. Encouragingly, the Scottish Government has very recently announced a ‘benefit take-up strategy’ for the few benefits it has devolved control over, incorporating some of the principles discussed in Section 5. Studying the impact of policies arising from this strategy – including how they affect targeting – would be of very high value both to the Scottish Government and to policymakers more widely.
There are big and long-running debates about the basic shape that a transfer system should take which will not go away. From the UK’s current starting point of a heavily means-tested system, these include the case for more universalism and the case for more earnings-related support – rather different directions for policy from each other, but both of which seem to have been in the ascendancy recently. We have reviewed many of the arguments for and against these policy directions in this chapter, and associated commentaries go into more detail still.
Some of the most difficult issues that have a bearing on big questions in transfer policy are at what we might call the intersection of the material, the relational and the political. It is natural to see transfers as a tool to help address deficiencies, or inequalities, in material resources that the market produces. When all else fails, there is no other option, except to leave the problem unaddressed – meaning poverty. But an orientation towards redressing material inequalities means targeting of some kind. It is what creates the need to, on some level or other, make judgements about who needs what or assessments about whether people are deserving of the support on offer. And it creates a spectrum of connectedness to the system, with some people heavily reliant on it for much of their lives and others unlikely ever to be. This is not to be deterministic: no doubt there are ways of addressing material inequality that have greater or lesser impacts on feelings of stigma and social solidarity, depending on how they are implemented. But it is the targeting of material support that opens the door to these challenges: they would not be present in a truly universal system, for example. Finally, political constraints cannot be ignored when it comes to actually improving the world. People have quite strong views about the legitimacy of different forms of support. Again, this is not to say they are deterministic: over the long term, those views are probably themselves partly the product of the history of policy and rhetoric – these become part of the culture against which opinions are formed. Whether there is scope for moving towards a new and preferable equilibrium between the material, the relational and the political is perhaps one of the biggest questions that the next stage of the Review should consider.
Appendix
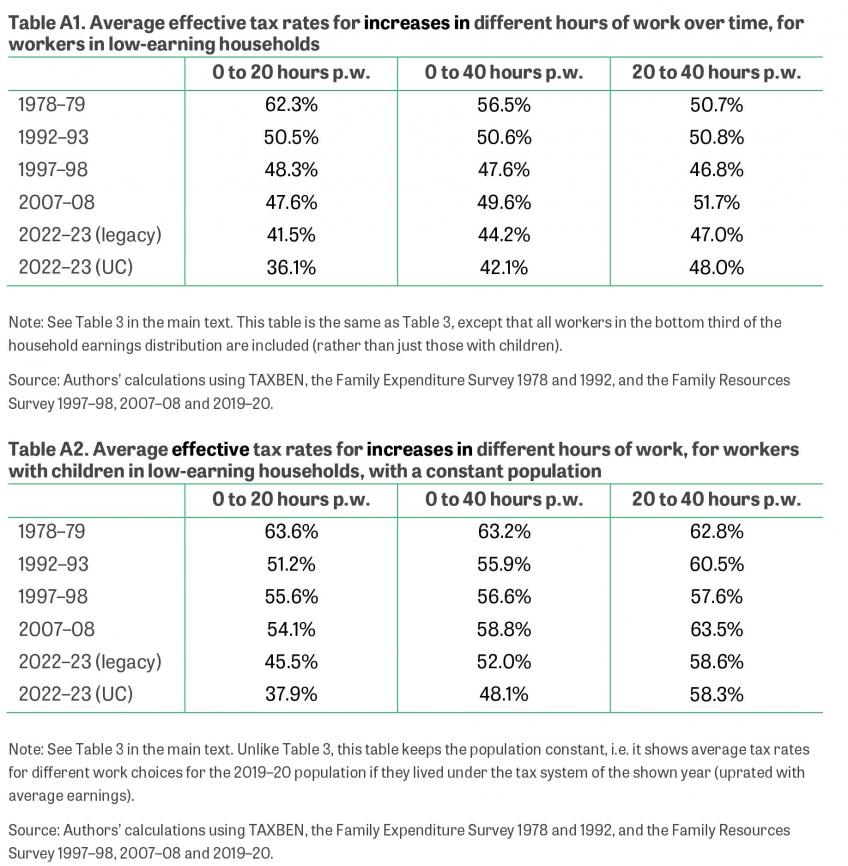
Figure A1. AHC relative poverty rates for working-age non-parents and others
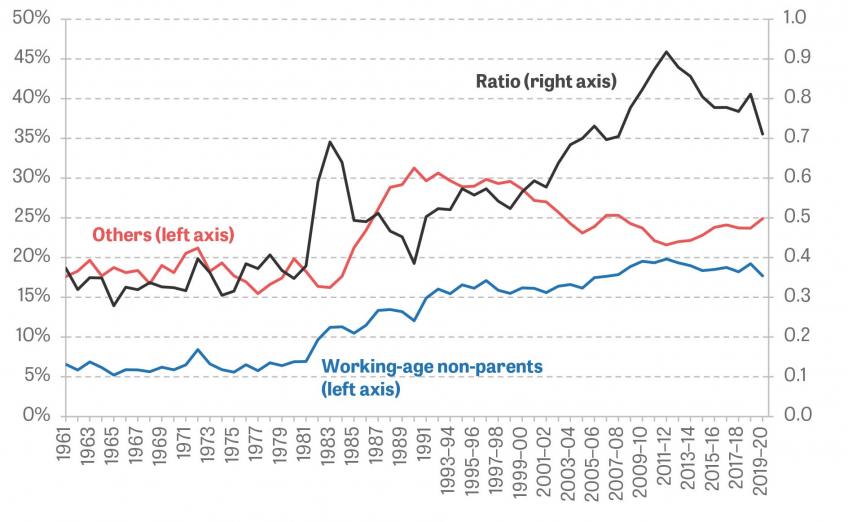
Source: Households Below Average Income, 1961 to 2019–20.
References
Adam, S., and Brewer, M. (2004), ‘Couple Penalties and Premiums in the UK Tax and Benefit System’, Institute for Fiscal Studies (IFS), Report BN102. https://ifs.org.uk/publications/couple-penalties-and-premiums-uk-tax-and-benefit-system
Adam, S., Chandler, D., Hood, A., and Joyce, R. (2015), ‘Social Rents Policy: Choices and Trade-Offs’, Institute for Fiscal Studies (IFS), Report R108. https://ifs.org.uk/publications/social-rents-policy-choices-and-tradeoffs
Adam, S., Miller, H., and Waters, T. (2020), ‘Income Protection for the Self-Employed and Employees during the Coronavirus Crisis’, Institute for Fiscal Studies (IFS), Report BN277. https://ifs.org.uk/publications/income-protection-self-employed-and-employees-during-coronavirus-crisis
Adam, S., and Waters, T. (2018), ‘Options for Raising Taxes’, in C. Emmerson, C. Farquharson and P. Johnson (eds), The IFS Green Budget: October 2018. https://ifs.org.uk/books/options-raising-taxes
Anderson, P. M., and Meyer, B. D. (1997), ‘Unemployment Insurance Takeup Rates and the After-Tax Value of Benefits’, Quarterly Journal of Economics, 112(3), 913–37. https://www.jstor.org/stable/2951259
Armour, P. (2018), ‘The Role of Information in Disability Insurance Application: An Analysis of the Social Security Statement Phase-In’, American Economic Journal: Economic Policy, 10(3), 1–41. https://doi.org/10.1257/pol.20160605
Atkinson, A. B. (2015), Inequality: What Can Be Done? (illustrated edition). Harvard University Press.
Autor, D. H., Dorn, D., and Hanson, G. H. (2013), ‘The China Syndrome: Local Labor Market Effects of Import Competition in the United States’, American Economic Review, 103(6), 2121–68. https://doi.org/10.1257/aer.103.6.2121
Autor, D. H., and Duggan, M. G. (2003), ‘The Rise in the Disability Rolls and the Decline in Unemployment’, Quarterly Journal of Economics, 118(1), 157–206. https://doi.org/10.1162/00335530360535171
Avram, S., Brewer, M., and Salvatori, A. (2018), ‘Can’t Work or Won’t Work: Quasi-Experimental Evidence on Work Search Requirements for Single Parents’, Labour Economics, 51, 63–85. https://doi.org/10.1016/j.labeco.2017.10.002
Azmat, G. (2019), Incidence, Salience, and Spillovers: The Direct and Indirect Effects of Tax Credits on Wages’, Quantitative Economics, 10(1), 239–73. https://doi.org/10.3982/QE319
Bailey, M. J., Hoynes, H. W., Rossin-Slater, M., and Walker, R. (2020), ‘Is the Social Safety Net a Long-Term Investment? Large-Scale Evidence from the Food Stamps Program’, National Bureau of Economic Research (NBER), Working Paper w26942. https://doi.org/10.3386/w26942
Banks, J., Blundell, R., and Emmerson, C. (2015), ‘Disability Benefit Receipt and Reform: Reconciling Trends in the United Kingdom’, Journal of Economic Perspectives, 29(2), 173–90. https://doi.org/10.1257/jep.29.2.173
Banks, J., Karjalainen, H., and Waters, T. (forthcoming), ‘Inequalities in Disability in the UK’, IFS Deaton Review of Inequalities.
Bastian, J., and Michelmore, K. (2018), ‘The Long-Term Impact of the Earned Income Tax Credit on Children’s Education and Employment Outcomes’, Journal of Labor Economics, 36(4), 1127–63. https://doi.org/10.1086/697477
Baumberg Geiger, B., Scullion, L. C., Summers, K., Martin, P. B., Lawler, C., Edmiston, D., Gibbons, A. R., Ingold, J., Robertshaw, D., and de Vries, R. (2021), ‘Non-Take-Up of Benefits at the Start of the COVID-19 Pandemic’, Welfare at a (Social) Distance. https://www.distantwelfare.co.uk/take-up
Beatty, C., and Fothergill, S. (2020), ‘The Long Shadow of Job Loss: Britain’s Older Industrial Towns in the 21st Century’, Frontiers in Sociology, 5. https://www.frontiersin.org/articles/10.3389/fsoc.2020.00054
Benhassine, N., Devoto, F., Duflo, E., Dupas, P., and Pouliquen, V. (2015), ‘Turning a Shove into a Nudge? A “Labeled Cash Transfer” for Education’, American Economic Journal: Economic Policy, 7(3), 86–125. https://doi.org/10.1257/pol.20130225
Bennmarker, H., Calmfors, L., and Seim, A. (2014), ‘Earned Income Tax Credits, Unemployment Benefits and Wages: Empirical Evidence from Sweden’, IZA Journal of Labor Policy, 3(1), 54. https://doi.org/10.1186/s40173-014-0026-1
Bertrand, M., Mullainathan, S., and Shafir, E. (2004), ‘A Behavioral-Economics View of Poverty’, American Economic Review, 94(2), 419–23. https://www.jstor.org/stable/3592921
Bettinger, E. P., Long, B. T., Oreopoulos, P., and Sanbonmatsu, L. (2012), ‘The Role of Application Assistance and Information in College Decisions: Results from the H&R Block FAFSA Experiment’, Quarterly Journal of Economics, 127(3), 1205–42. https://doi.org/10.1093/qje/qjs017
Beveridge, W. (1942), Social Insurance and Allied Services. The Beveridge Report. https://www.parliament.uk/about/living-heritage/transformingsociety/livinglearning/coll-9-health1/coll-9-health/
Bhargava, S., and Manoli, D. (2015), ‘Psychological Frictions and the Incomplete Take-Up of Social Benefits: Evidence from an IRS Field Experiment’, American Economic Review, 105(11), 3489–529. https://doi.org/10.1257/aer.20121493
Bitler, M. P., Currie, J., and Scholz, J. K. (2003), ‘WIC Eligibility and Participation’, Journal of Human Resources, 38, 1139–79. https://doi.org/10.2307/3558984
Black, D., Daniel, K., and Sanders, S. (2002), ‘The Impact of Economic Conditions on Participation in Disability Programs: Evidence from the Coal Boom and Bust’, American Economic Review, 92(1), 27–50. https://doi.org/10.1257/000282802760015595
Blundell, R., Costa Dias, M., Meghir, C., and Shaw, J. (2016), ‘Female Labor Supply, Human Capital, and Welfare Reform’, Econometrica, 84(5), 1705–53. https://doi.org/10.3982/ECTA11576
Blundell, R., and MaCurdy, T. (1999), ‘Chapter 27 – Labor Supply: A Review of Alternative Approaches’, in O. C. Ashenfelter and D. Card (eds), Handbook of Labor Economics, Volume 3, Elsevier. https://doi.org/10.1016/S1573-4463(99)03008-4
Blundell, R., Reed, H., Van Reenen, J., and Shephard, A. (2003), ‘The Impact of the New Deal for Young People on the Labour Market: A Four-Year Assessment’, in R. Dickens, P. Gregg and J. Wadsworth (eds), The Labour Market under New Labour: The State of Working Britain 2003, Palgrave Macmillan. https://doi.org/10.1057/9780230598454_2
Bourquin, P., and Waters, T. (2019), ‘The Effect of Taxes and Benefits on UK Inequality’, Institute for Fiscal Studies (IFS), Report BN249. https://ifs.org.uk/publications/effect-taxes-and-benefits-uk-inequality
Bourquin, P., and Waters, T. (2020), ‘The Temporary Benefit Increases beyond 2020-21’, in C. Emmerson, C. Farquharson and P. Johnson (eds), The IFS Green Budget: October 2020. https://ifs.org.uk/books/temporary-benefit-increases-beyond-2020-21
Brewer, M., Browne, J., Emmerson, C., Hood, A., and Joyce, R. (2019), ‘The Curious Incidence of Rent Subsidies: Evidence of Heterogeneity from Administrative Data’, Journal of Urban Economics, 114, 103198. https://doi.org/10.1016/j.jue.2019.103198
Brewer, M., Duncan, A., Shephard, A., and Suárez, M. J. (2006), ‘Did Working Families’ Tax Credit Work? The Impact of In-Work Support on Labour Supply in Great Britain’, Labour Economics, 13(6), 699–720. https://doi.org/10.1016/j.labeco.2005.11.002
Brewer, M., Finch, D., and Tomlinson, D. (2017), ‘Universal Remedy: Ensuring Universal Credit Is Fit for Purpose’, Resolution Foundation. https://www.resolutionfoundation.org/publications/universal-remedy-ensuring-universal-credit-is-fit-for-purpose/
Brewer, M., Handscomb, K., and Shah, K. (2021), ‘In Need of Support? Lessons from the Covid-19 Crisis for Our Social Security System’, Resolution Foundation. https://www.resolutionfoundation.org/publications/in-need-of-support/
Brewer, M., Joyce, R., Waters, T., and Woods, J. (2019), ‘Universal Credit and Its Impact on Household Incomes: The Long and the Short of It’, Institute for Fiscal Studies (IFS), Report BN248. https://ifs.org.uk/publications/universal-credit-and-its-impact-household-incomes-long-and-short-it
Browne, J., Hood, A., and Joyce, R. (2016), ‘The (Changing) Effects of Universal Credit’, in C. Emmerson, P. Johnson and R. Joyce (eds), The IFS Green Budget: February 2016. https://ifs.org.uk/books/changing-effects-universal-credit
Card, D., Kluve, J., and Weber, A. (2018), ‘What Works? A Meta Analysis of Recent Active Labor Market Program Evaluations’, Journal of the European Economic Association, 16(3), 894–931. https://doi.org/10.1093/jeea/jvx028
Case, A., and Kraftman, L. (2022), ‘Health Inequalities’, IFS Deaton Review of Inequalities. https://ifs.org.uk/inequality/health-inequalities/
Charles, K. K., Li, Y., and Stephens, M., Jr (2018), ‘Disability Benefit Take-Up and Local Labor Market Conditions’, Review of Economics and Statistics, 100(3), 416–23. https://doi.org/10.1162/rest_a_00692
Codreanu, M., and Waters, T. (2023), ‘Do Work Search Requirements Work? Evidence from a UK Reform Targeting Single Parents’, Institute for Fiscal Studies (IFS), Working Paper 23/02. https://ifs.org.uk/publications/do-work-search-requirements-work-evidence-uk-reform-targeting-single-parents
Collinson, R., and Ganong, P. (2018), ‘How Do Changes in Housing Voucher Design Affect Rent and Neighborhood Quality?’, American Economic Journal: Economic Policy, 10(2), 62–89. https://doi.org/10.1257/pol.20150176
Crafts, N. (2023), ‘The Welfare State and Inequality: Were the 1940s’ UK Reforms a Success?’, IFS Deaton Review of Inequalities. https://ifs.org.uk/inequality/the-welfare-state-and-inequality
Cribb, J., Giupponi, G., Joyce, R., Lindner, A., Waters, T., Wernham, T., and Xu, X. (2021), ‘The Distributional and Employment Impacts of Nationwide Minimum Wage Changes’, Institute for Fiscal Studies (IFS), Working Paper 21/48. https://ifs.org.uk/publications/distributional-and-employment-impacts-nationwide-minimum-wage-changes
Cribb, J., Joyce, R., and Wernham, T. (2022), ‘Twenty-Five Years of Income Inequality in Britain: The Role of Wages, Household Earnings and Redistribution’, Institute for Fiscal Studies (IFS), Working Paper 22/12. https://ifs.org.uk/publications/twenty-five-years-income-inequality-britain-role-wages-household-earnings-and
Cribb, J., Waters, T., Wernham, T., and Xu, X. (2022), ‘Living Standards, Poverty and Inequality in the UK: 2022’, Institute for Fiscal Studies (IFS), Report. https://ifs.org.uk/publications/living-standards-poverty-and-inequality-uk-2022.
Currie, J. (2004), ‘The Take Up of Social Benefits’, National Bureau of Economic Research (NBER), Working Paper 10488. https://doi.org/10.3386/w10488
Currie, J., and Grogger, J. (2002), ‘Medicaid Expansions and Welfare Contractions: Offsetting Effects on Prenatal Care and Infant Health?’, Journal of Health Economics, 21(2), 313–35. https://doi.org/10.1016/s0167-6296(01)00125-4
Currie, J., Grogger, J., Burtless, G., and Schoeni, R. F. (2001), ‘Explaining Recent Declines in Food Stamp Program Participation’, Brookings-Wharton Papers on Urban Affairs, 203–44. http://www.jstor.org/stable/25058786
Dahan, M., and Nisan, U. (2010), ‘The Effect of Benefits Level on Take-Up Rates: Evidence from a Natural Experiment’, International Tax and Public Finance, 17(2), 151–73. https://doi.org/10.1007/s10797-009-9109-0
Dahl, G. B., Kostøl, A. R., and Mogstad, M. (2014), ‘Family Welfare Cultures’, Quarterly Journal of Economics, 129(4), 1711–52. https://doi.org/10.1093/qje/qju019
Daponte, B. O., Sanders, S., and Taylor, L. (1999), ‘Why Do Low-Income Households Not Use Food Stamps? Evidence from an Experiment’, Journal of Human Resources, 34(3), 612–28. https://doi.org/10.2307/146382
Delestre, I., Joyce, R., Rasul, I., and Waters, T. (2020), ‘Income Protection Policy during COVID-19: Evidence from Bank Account Data’, Institute for Fiscal Studies (IFS), Report BN303. https://ifs.org.uk/publications/income-protection-policy-during-covid-19-evidence-bank-account-data
Department for Work and Pensions (2017), ‘Universal Credit Employment Impact Analysis: Update’, DWP Ad Hoc Research Report 53. https://www.gov.uk/government/publications/universal-credit-employment-impact-analysis-update
Department for Work and Pensions (2018), ‘Universal Credit: In-Work Progression Randomised Controlled Trial’. https://www.gov.uk/government/publications/universal-credit-in-work-progression-randomised-controlled-trial
Deshpande, M., and Li, Y. (2019), ‘Who Is Screened Out? Application Costs and the Targeting of Disability Programs’, American Economic Journal: Economic Policy 11(4), 213–48. https://doi.org/10.1257/pol.20180076
Dilnot, A. W., Kay, J. A., and Morris, C. N. (1984), The Reform of Social Security, Clarendon Press.
Dolton, P., and Smith, J. A. (2011), ‘The Impact of the UK New Deal for Lone Parents on Benefit Receipt’, IZA, Discussion Paper 5491. https://ideas.repec.org//p/iza/izadps/dp5491.html
Dorsett, R., and Oswald, A. J. (2014), ‘Human Well-Being and In-Work Benefits: A Randomized Controlled Trial’, IZA, Discussion Paper 7943. https://ideas.repec.org//p/iza/izadps/dp7943.html
Dube, A. (2019), ‘Minimum Wages and the Distribution of Family Incomes’, American Economic Journal: Applied Economics, 11(4), 268–304. https://doi.org/10.1257/app.20170085
Emmerson, C., Joyce, R., and Sturrock, D. (2017), ‘Working-Age Incapacity and Disability Benefits’, in C. Emmerson, P. Johnson and R. Joyce (eds), The IFS Green Budget: February 2017. https://ifs.org.uk/books/working-age-incapacity-and-disability-benefits
Engström, P., Forsell, E., Hagen, J., and Stefánsson, A. (2019), ‘Increasing the Take-Up of the Housing Allowance among Swedish Pensioners: A Field Experiment’, International Tax and Public Finance, 26(6), 1353–82. https://doi.org/10.1007/s10797-019-09538-9
Eriksen, M. D., and Ross, A. (2015), ‘Housing Vouchers and the Price of Rental Housing’, American Economic Journal: Economic Policy, 7(3), 154–76. https://doi.org/10.1257/pol.20130064
Fack, G. (2006), ‘Are Housing Benefit an Effective Way to Redistribute Income? Evidence from a Natural Experiment in France’, Labour Economics, 13(6), 747–71. https://doi.org/10.1016/j.labeco.2006.01.001
Finkelstein, A., and Notowidigdo, M. J. (2019), ‘Take-Up and Targeting: Experimental Evidence from SNAP’, Quarterly Journal of Economics, 134(3), 1505–56. https://doi.org/10.1093/qje/qjz013
Foley, B. (2017), ‘Delivering on Universal Credit’. https://www.citizensadvice.org.uk/Global/CitizensAdvice/welfare%20publications/Delivering%20on%20Universal%20Credit%20-%20report.pdf
French, E., and Song, J. (2014), ‘The Effect of Disability Insurance Receipt on Labor Supply’, American Economic Journal: Economic Policy, 6(2), 291–337. https://doi.org/10.1257/pol.6.2.291
Gerfin, M., and Lechner, M. (2002), ‘A Microeconometric Evaluation of the Active Labour Market Policy in Switzerland’, Economic Journal, 112(482), 854–93. https://doi.org/10.1111/1468-0297.00072
Gibbons, S., and Manning, A. (2006), ‘The Incidence of UK Housing Benefit: Evidence from the 1990s Reforms’, Journal of Public Economics, 90(4–5), 799–822. https://doi.org/10.1016/j.jpubeco.2005.01.002
Goll, D., Joyce, R., and Waters, T. (2023), ‘Intensive Margin Labour Supply and the Dynamic Effects of In-Work Transfers’, Institute for Fiscal Studies (IFS), Working Paper 23/03. https://ifs.org.uk/publications/intensive-margin-labour-supply-and-dynamic-effects-work-transfers
Grislain-Letrémy, C., and Trevien, C. (2014), ‘The Impact of Housing Subsidies on the Rental Sector: The French Example’, Documents de Travail de l’Insee - INSEE Working Paper, g2014-08. https://ideas.repec.org/p/nse/doctra/g2014-08.html
Hendra, R., Riccio, J., Dorsett, R., Greenberg, D., Knight, G., Phillips, J., Robins, P., Vegeris, S., Walter, J., Ray, K., Smith, J., and Hill, A. (2011), ‘Breaking the Low-Pay, No-Pay Cycle: Final Evidence from the UK Employment Retention and Advancement (ERA) Demonstration’, Department for Work and Pensions, Research Report 765. https://doi.org/10.2139/ssrn.1943253
Hendren, N., and Sprung-Keyser, B. (2020), ‘A Unified Welfare Analysis of Government Policies’, Quarterly Journal of Economics, 135(3), 1209–318. https://doi.org/10.1093/qje/qjaa006
Herd, P., and Moynihan, D. P. (2018), Administrative Burden: Policymaking by Other Means. Russell Sage Foundation.
HM Revenue and Customs (2013), ‘Child Benefit, Child Tax Credit and Working Tax Credit: Take-Up Rates – 2011-12’, https://assets.publishing.service.gov.uk/government/uploads/system/uploads/attachment_data/file/502601/cwtcchb-take-up2011-12-Corrected-1602-V1.pdf.
Homonoff, T., and Somerville, J. (2021), ‘Program Recertification Costs: Evidence from SNAP’, American Economic Journal: Economic Policy, 13(4), 271–98. https://doi.org/10.1257/pol.20190272
Hotz, V. J., Imbens, G. W., and Klerman, J. A. (2006), ‘Evaluating the Differential Effects of Alternative Welfare‐to‐Work Training Components: A Reanalysis of the California GAIN Program’, Journal of Labor Economics, 24(3), 521–66. https://doi.org/10.1086/505050
Hoynes, H., and Patel, A. J. (2018), ‘Effective Policy for Reducing Poverty and Inequality? The Earned Income Tax Credit and the Distribution of Income’, Journal of Human Resources, 53(4), 859–90. https://doi.org/10.3368/jhr.53.4.1115.7494R1
Hoynes, H., and Rothstein, J. (2019), ‘Universal Basic Income in the United States and Advanced Countries’, Annual Review of Economics, 11, 929–58. https://doi.org/10.1146/annurev-economics-080218-030237
Hoynes, H., and Schanzenbach, D. W. (2018), ‘Safety Net Investments in Children’, National Bureau of Economic Research (NBER), Working Paper 24594. https://doi.org/10.3386/w24594
Hoynes, H., Schanzenbach, D. W., and Almond, D. (2016), ‘Long-Run Impacts of Childhood Access to the Safety Net’, American Economic Review, 106(4), 903–34. https://doi.org/10.1257/aer.20130375
Institute for Government and the Social Security Advisory Committee (2022), ‘Jobs and Benefits: The COVID-19 Challenge’. https://www.gov.uk/government/publications/jobs-and-benefits-the-covid-19-challenge/jobs-and-benefits-the-covid-19-challenge
Joyce, R., Ray-Chaudhuri, S. and Waters, T. (2022), ‘The Number of New Disability Benefit Claimants Has Doubled in a Year’, Institute for Fiscal Studies (IFS), Report R233. https://ifs.org.uk/publications/number-new-disability-benefit-claimants-has-doubled-year
Ko, W., and Moffitt, R. A. (2022), ‘Take-Up of Social Benefits’, National Bureau of Economic Research (NBER), Working Paper 30148. https://doi.org/10.3386/w30148
Laferrère, A., and Le Blanc, D. (2004), ‘How Do Housing Allowances Affect Rents? An Empirical Analysis of the French Case’, Journal of Housing Economics, 13(1), 36–67. https://doi.org/10.1016/j.jhe.2004.02.001
Leigh, A. (2010), ‘Who Benefits from the Earned Income Tax Credit? Incidence among Recipients, Coworkers and Firms’, B.E. Journal of Economic Analysis & Policy, 10(1). https://doi.org/10.2202/1935-1682.1994
Linos, E., Prohofsky, A., Ramesh, A., Rothstein, J., and Unrath, M. (2022), ‘Can Nudges Increase Take-Up of the EITC? Evidence from Multiple Field Experiments’, American Economic Journal: Economic Policy, 14(4), 432–52. https://doi.org/10.1257/pol.20200603
Lundberg, S., and Pollak, R. A. (1996), ‘Bargaining and Distribution in Marriage’, Journal of Economic Perspectives, 10(4), 139–58. https://doi.org/10.1257/jep.10.4.139
Lundberg, S. J., Pollak, R. A., and Wales, T. J. (1997), ‘Do Husbands and Wives Pool Their Resources? Evidence from the United Kingdom Child Benefit’, Journal of Human Resources, 32(3), 463–80. https://doi.org/10.2307/146179
Manning, A. (2009), ‘You Can’t Always Get What You Want: The Impact of the UK Jobseeker’s Allowance’, Labour Economics, 16(3), 239–50. https://doi.org/10.1016/j.labeco.2008.09.005
Manoli, D. S., and Turner, N. (2014), ‘Nudges and Learning: Evidence from Informational Interventions for Low-Income Taxpayers’, National Bureau of Economic Research (NBER), Working Paper 20718. https://doi.org/10.3386/w20718
Manoli, D. S., and Weber, A. (2016), ‘The Effects of the Early Retirement Age on Retirement Decisions’, National Bureau of Economic Research (NBER), Working Paper 22561. https://doi.org/10.3386/w22561
Matikka, T., and Paukkeri, T. (2016), ‘Does Information Increase the Take-Up of Social Benefits? Evidence from a New Benefit Program’, VATT Institute for Economic Research, Working Paper 83. https://papers.ssrn.com/abstract=2890822
Meghir, C., and Phillips, D. (2010), ‘Labour Supply and Taxes’, in J. Mirrlees, S. Adam, T. Besley, R. Blundell, S. Bond, R. Chote, M. Gammie, P. Johnson, G. Myles, and J. M. Poterba (eds), Dimensions of Tax Design: The Mirrlees Review, Oxford University Press. https://ifs.org.uk/books/dimensions-tax-design
Mirrlees, J., Adam, S., Besley, T., Blundell, R., Bond, S., Chote, R., Gammie, M., Johnson, P., Myles, G., and Poterba, J. M. (eds) (2011), Tax by Design: The Mirrlees Review, Oxford University Press. https://ifs.org.uk/books/tax-design
Moffitt, R. (1983), ‘An Economic Model of Welfare Stigma’, American Economic Review, 73(5), 1023–35. https://www.jstor.org/stable/1814669
Moffitt, R. (2003), ‘The Role of Nonfinancial Factors in Exit and Entry in the TANF Program’, Journal of Human Resources, 38, 1221–54. https://doi.org/10.2307/3558986
Moffitt, R. (2023), ‘Transfers, Taxes, and Tax Credits for Those on Low Incomes: Beyond Mirrlees’, IFS Deaton Review of Inequalities. https://ifs.org.uk/inequality/transfers-taxes-and-tax-credits-for-those-on-low-incomes
Nichols, A., and Rothstein, J. (2016), ‘The Earned Income Tax Credit’, in R. A. Moffitt (ed.), Economics of Means-Tested Transfer Programs in the United States, University of Chicago Press. https://econpapers.repec.org/bookchap/nbrnberch/13484.htm
Nichols, A. L., and Zeckhauser, R. J. (1982), ‘Targeting Transfers through Restrictions on Recipients’, American Economic Review, 72(2), 372–7. https://www.jstor.org/stable/1802361
Office for Budget Responsibility (2018), ‘Welfare Trends Report – January 2018’. https://obr.uk/wtr/welfare-trends-report-january-2018/
Office for Budget Responsibility (2019), ‘Welfare Trends Report – January 2019’. https://obr.uk/wtr/welfare-trends-report-january-2019/
Olsen, E. (2003), ‘Housing Programs for Low-Income Households’, in R. A. Moffitt (ed.), Economics of Means-Tested Transfer Programs in the United States, University of Chicago Press. https://econpapers.repec.org/bookchap/nbrnberch/10259.htm
Patrick, R. (2023), ‘Living at the Sharp End of Socio-Economic Inequality: Everyday Experiences of Poverty and Social Security Receipt’, IFS Deaton Review of Inequalities. https://ifs.org.uk/inequality/living-at-the-sharp-end-of-socio-economic-inequality
Paukkeri, T. (2017), ‘The Take-Up of Welfare Benefits: Combining a Static and Dynamic Perspective’. http://www.ecineq.org/ecineq_nyc17/FILESx2017/CR2/p422.pdf
Petrongolo, B. (2009), ‘The Long-Term Effects of Job Search Requirements: Evidence from the UK JSA Reform’, Journal of Public Economics, 93(11–12), 1234–53. https://doi.org/10.1016/j.jpubeco.2009.09.001
Radford, L. (2012), ‘Quantitative Evaluation of the Pension Credit Payment Study’, Department for Work and Pensions, Research Report 796. https://www.gov.uk/government/publications/quantitative-evaluation-of-the-pension-credit-payment-study-rr796
Reeves, A., Fransham, M., Stewart, K., and Patrick, R. (2020), ‘Did the Introduction of the Benefit Cap in Britain Harm Mental Health? A Natural Experiment Approach’, https://largerfamilies.study/publications/did-the-introduction-of-the-benefit-cap-in-britain-harm-mental-health.
Riley, R., and Young, D. G. (2001), ‘The Macroeconomic Impact of the New Deal for Young People’, National Institute of Economic and Social Research (NIESR), Discussion Paper 184. https://ideas.repec.org/p/nsr/niesrd/184.html
Roantree, B., and Shaw, J. (2018), ‘What a Difference a Day Makes: Inequality and the Tax and Benefit System from a Long-Run Perspective’, Journal of Economic Inequality, 16(1), 23–40. https://doi.org/10.1007/s10888-017-9362-x
Rossin-Slater, M. (2013), WIC in Your Neighborhood: New Evidence on the Impacts of Geographic Access to Clinics’, Journal of Public Economics, 102, 51–69. https://doi.org/10.1016/j.jpubeco.2013.03.009
Rothstein, J. (2008), ‘The Unintended Consequences of Encouraging Work: Tax Incidence and the EITC’, Princeton University, Department of Economics, Center for Economic Policy Studies, Working Paper 1049. https://ideas.repec.org/p/pri/cepsud/165.html
Rothstein, J. (2010), ‘Is the EITC as Good as an NIT? Conditional Cash Transfers and Tax Incidence’, American Economic Journal: Economic Policy, 2(1), 177–208. https://doi.org/10.1257/pol.2.1.177
Saez, E. (2002), ‘Optimal Income Transfer Programs: Intensive versus Extensive Labor Supply Responses’, Quarterly Journal of Economics, 117(3), 1039–73. https://doi.org/10.1162/003355302760193959
Sayag, D., and Zussman, N. (2015), ‘The Distribution of Rental Assistance between Tenants and Landlords: The Case of Students in Central Jerusalem’, Bank of Israel, Working Paper 2015.01. https://ideas.repec.org//p/boi/wpaper/2015.01.html
Schanzenbach, D. (2009), ‘Experimental Estimates of the Barriers to Food Stamp Enrollment’, University of Wisconsin-Madison, Institute for Research on Poverty, Discussion Paper 1367-09. https://www.irp.wisc.edu/resource/experimental-estimates-of-the-barriers-to-food-stamp-enrollment/
Social Security Advisory Committee (2018), ‘The Universal Credit (Miscellaneous Amendments, Savings and Transitional Provision) Regulations (S.I. 2018 No. 65)’. https://assets.publishing.service.gov.uk/government/uploads/system/uploads/attachment_data/file/675908/uc-regs-si-2018-65-surplus-earnings-ssac-report.pdf.
Stewart, K., Patrick, R., and Reeves, A. (2021), ‘A Time of Need: Exploring the Changing Poverty Risk Facing Larger Families in the UK’, https://largerfamilies.study/publications/a-time-of-need.
Susin, S. (2002), ‘Rent Vouchers and the Price of Low-Income Housing’, Journal of Public Economics, 83(1), 109–52. https://doi.org/10.1016/S0047-2727(01)00081-0
Timmins, N. (2023), ‘Why Has the UK’s Social Security System Become So Means-Tested?’, IFS Deaton Review of Inequalities. https://ifs.org.uk/inequality/why-has-the-uks-social-security-system-become-so-means-tested
Tomlinson, D. (2018), ‘Irregular Payments: Assessing the Breadth and Depth of Month to Month Earnings Volatility’. https://www.resolutionfoundation.org/publications/irregular-payments/
Viren, M. (2013), ‘Is the Housing Allowance Shifted to Rental Prices?’, Empirical Economics, 44(3), 1497–518. https://doi.org/10.1007/s00181-012-0589-x
Whelan, S. (2010), ‘The Take-Up of Means-Tested Income Support’, Empirical Economics, 39(3), 847–75. https://doi.org/10.1007/s00181-009-0329-z
Zantomio, F. (2015), ‘The Route to Take-Up: Evidence from the UK Pension Credit Reform’, Oxford Bulletin of Economics and Statistics, 77(5), 719–39. https://doi.org/10.1111/obes.12080
Zantomio, F., Pudney, S., and Hancock, R. (2010), ‘Estimating the Impact of a Policy Reform on Benefit Take-Up: The 2001 Extension to the Minimum Income Guarantee for UK Pensioners’, Economica, 77(306), 234–54. https://doi.org/10.1111/j.1468-0335.2008.00755.x
Endnotes
Authors

Hilary Hoynes
Hilary is a Research Fellow of the IFS and a Professor of Public Policy and Economics at the University of California, Berkeley.


Tom Waters
Tom is an Associate Director at the IFS and Head of the Income, Work and Welfare sector.
More from IFS
Understand this issue


Policy analysis


Academic research


