
At its recent conference, the Labour party committed to removing charitable status from private schools and the associated exemptions from VAT and business rates. The extra funding would then be used to increase state school spending and would be targeted at pupils from disadvantaged backgrounds.
In this article, we provide further context by showing that the gap between private school fees and state school spending per pupil has more than doubled over the last decade. Such figures will naturally feed into longstanding concerns about inequalities between private and state school pupils, such as differences in access to particular universities and occupations. These have come into sharp focus during the pandemic and will not be easily addressed while the sectors enjoy such different levels of resourcing.
Throughout this article, we use the term private schools to refer to all independent or fee-paying schools, which are sometimes also (confusingly) referred to as public schools. This analysis was funded by the Nuffield Foundation and forms part of a larger programme of work examining trends and challenges in education spending across different phases.
Doubling of gap between state school spending and private school fees
There have long been concerns about different levels of resources available in private and state schools. In the 2006 Pre-Budget Report, the then Chancellor Gordon Brown committed to increase state school spending up to spending levels in private schools. This pledge got a bit lost over time, partly because it lacked specifics. However, the issue has not gone away. Indeed, the gap in spending between private and state schools has increased significantly over the last decade.
Figure 1 shows the total level of state school spending per pupil in England between 2003–04 and 2020–21. These figures are higher than others we have published as they include both current and capital spending, given that private schools will need to fund their own capital expenditure. For comparison, we then show the average day fee at private day schools over time (i.e. excluding the cost of boarding). We show this before and after deducting estimated levels of bursaries and scholarships, given that over one-quarter of pupils receive some kind of discount or bursary. Figure 2 then shows the percentage difference between spending per pupil in the state sector and private school fees (minus bursaries and scholarships).
This is not a perfect comparison between resources in the private and state sectors, but there are good reasons to believe that these figures probably understate the gap in resources. First, we do not account for investment income, endowments or gifts/donations, which are likely to push up private school spending by more. Second, private school fees are for the UK as a whole, with state school spending shown for England only due to the availability of data over time. Figures for private school fees in England only would probably be higher given that figures for Scotland and Wales are below the UK average.
Figure 1. Comparing state school spending per pupil and average private school fees over time (2021–22 prices)
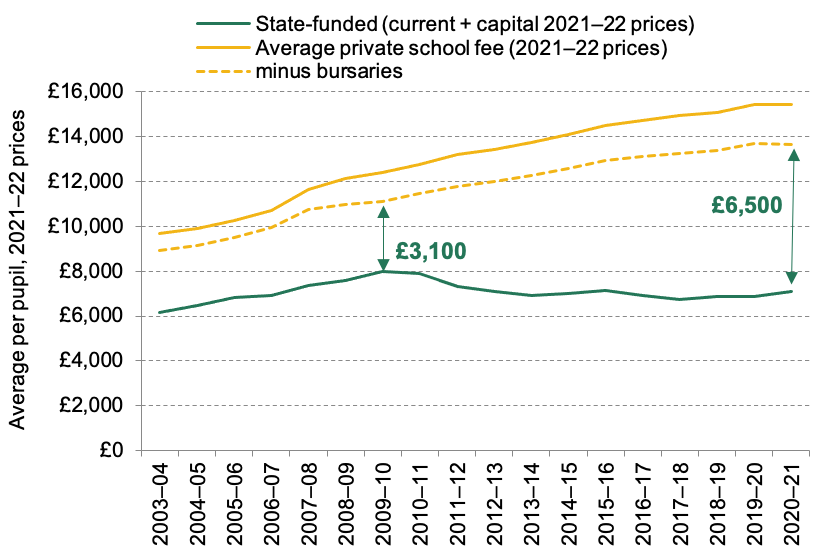
Note and source: State-funded school spending includes both current and capital spending, with figures for current spending and pupil numbers taken from Sibieta (2021) and capital spending taken from Britton et al. (2020) and PESA (2021). Private school fees represent the average termly day fee at day schools multiplied by three as reported in the Independent School Council (ISC) Annual Census 2004–21 (https://www.isc.co.uk/research/annual-census/), with figures prior to 2007 backcast using an older methodology for calculating average fees across different age groups. Level of bursaries calculated using total spending by schools on bursaries and scholarships divided by the total number of pupils at ISC schools. HM Treasury GDP deflators, October 2021 (https://www.gov.uk/government/collections/gdp-deflators-at-market-prices-and-money-gdp), with deflator increases smoothed between 2019–20 and 2022–23.
Figure 2. Percentage difference between state school spending per pupil and private school fees (minus bursaries and scholarships)

Note and source: See Figure 1.
The trends over the last decade have been very dramatic. Back in the late 2000s, when Gordon Brown was making his pledge to increase state school resources up to private school levels, total spending per pupil in the state sector was approaching £8,000 (in today’s prices and thus adjusted for 13 years of inflation) compared with net fees of around £11,000 in private schools. The gap in spending was thus about £3,100 or 40%.
Since then, total state school spending per pupil dropped to about £6,900 in 2019–20. This represents a drop of 14% in real terms and is partly driven by a large drop in capital spending, which was somewhat inflated in 2009 and 2010 due to delays in a large school building programme. However, our figures for current or day-to-day spending still show a drop of 9% over the decade between 2009–10 and 2019–20.
In very sharp contrast, net private school fees rose from £11,000 in 2009–10 to £13,700 in 2019–20, a real-terms increase of 23% over the decade. As a result, the gap in spending between the two sectors more than doubled from under £3,100 to £6,800, or from 40% to nearly 100% in relative terms, i.e. net private school fees were effectively double state school spending levels in 2019–20. These figures won’t include any effects of fee discounts for the 2020 summer term during the first lockdown, though there were clearly still differences across sectors in the nature of remote education offered and fee discounts were reportedly much less common in 2021.
In the latest year, this gap has come down a little bit to £6,500 or 92% in 2020–21. This partly results from increased state school spending, including increases to core spending, funding to cover higher employer pension contribution rates and higher capital spending. There was also a small real-terms drop in private school fees in 2020–21 (the first in more than 20 years), which is likely linked to the effects of the pandemic. Nevertheless, the gap in spending between the two sectors remains more than double its level in the late 2000s.
This represents the average gap and there is clearly a wide distribution in spending levels within the state-funded and private sectors. However, funding for the most deprived state-funded secondary schools (about £7,000 in 2019–20) is only half the value of average fee levels in private schools, and private school fees are 2.4 times more than funding levels at the least deprived state secondary schools.
Looking across phases, the difference in fee levels between senior and junior private schools (13–14% over the last three years) actually closely matches the difference between state-funded secondary and primary school funding levels (14% in 2019–20). Where there is more of a difference is sixth forms, with average sixth-form fees in 2019–20 over £15,000 (allowing for an assumed level of bursaries and discounts), about three times larger than sixth-form funding per pupil in the same year in the state-funded sector. This will exclude capital spending in the state sector, but declining student numbers in sixth forms and falls in school capital spending mean that dedicated capital spending on sixth forms was probably quite small over this time frame anyway.
Stable overall pupil numbers in private schools
Despite these large increases in private school fees over the last decade, Figure 3 shows that there has only been a small drop in the share of pupils attending private schools in England, which fell from 7.1% in 2010 to 6.5% in 2020. Furthermore, this fall was mainly driven by a rising pupil population in the state-funded sector, with the number of pupils in private schools remaining around 560,000–570,000 over most of the last decade in England. The number of non-British pupils whose parents live overseas attending private schools across the UK has risen over time, but only from about 23,000 in 2010 to 29,000 in 2020.
Figure 3. Number and share of pupils attending private schools in England over time
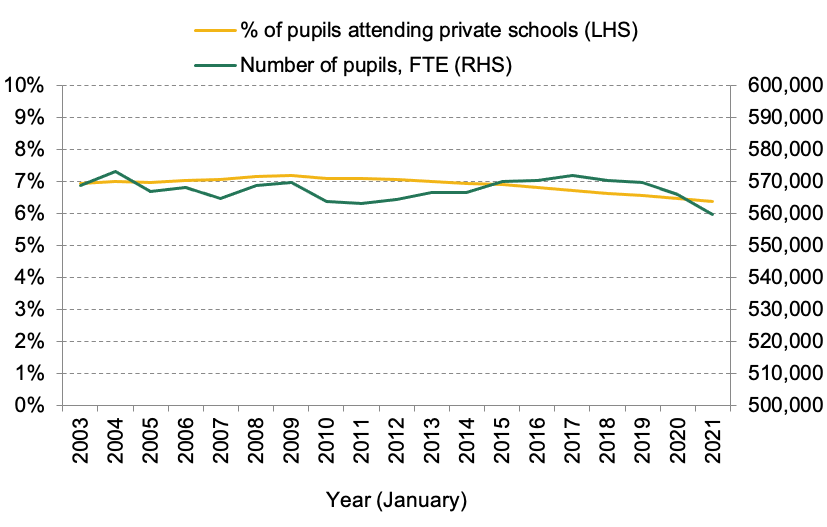
Note and source: FTE is full-time-equivalent. Department for Education, ‘Pupils, schools and their characteristics’.
Authors

Luke Sibieta
Luke is a Research Fellow at the IFS and his general research interests include education policy, political economy and poverty and inequality.
More from IFS
Understand this issue


Policy analysis


Academic research

