A well known consequence of increasing longevity and an ageing population is the upward pressure it places on health spending. Looking simply at the correlation between age and average spending there is an upward age profile in health spending, with older people costing more to treat on average than younger people. Growth in the size of the older population will therefore tend to increase total spending. However, exactly by how much and how quickly this growth in spending occurs depends on how the average health of a person at a given age changes: if additional years of life are spent in good health, then the cost of a person at a given age should fall and overall increases in spending will be less than anticipated. This is an important unknown and there is currently no clear consensus.
How does medical spending change at the end of life?
One driver of the upward age profile in health spending is the costs associated with the end of life. It is well established that health spending is much higher at the end of life. Figure 1 shows how average public spending on NHS inpatient treatment varied by age across people aged 50 and above with different distance to death between 2003 and 2018. The black line shows spending for all people in different age groups. The green line shows spending for those who died in the next year, while blue line shows spending for those who survived for at least another five years. This shows that spending is considerably higher for those in the last year of life, with average spending of £6,651 compared to £624 for those who lived for at least another five years.
Figure 1: Average inpatient spending by time to death, 2003–2018 (2018/19 prices)
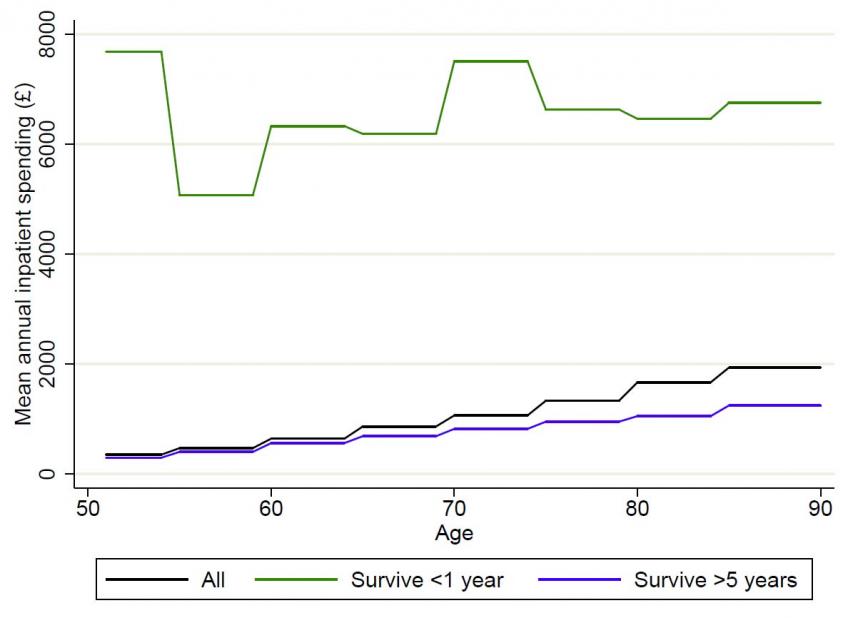
Notes and sources: Author’s calculations using linked HES-ELSA data for 2003 – 2018. Figures are weighted. Costs refer only to inpatient hospital treatment at NHS hospitals.
The figure also shows that while spending increases slightly with age among survivors, these increases are far below those seen for the entire population. For example, among those who survived at least an additional year, spending on someone aged 80-84 year was 4 times higher than on someone aged 50-54. However, among the entire population this was 5.5 times. This indicates that an important reason as to why average health spending is so much higher at older ages is that individuals are much more likely to die in the next year at an older age.
As people live longer – and die at older ages - these end of life costs will be postponed under older ages. This means that average health care costs could fall at many ages. This reduces the growth of health spending that would be implied purely by increasing life expectancies. The OBR incorporate such an effect in their projections for health spending – utilizing both profiles for both ‘age-related’ and ‘death related’ costs and weighting these given projections for population composition and mortality rates.
Given the importance of these end-of-life costs it is important to understand more about them. In a new working paper published today, and funded by the Health Foundation and ESRC, we use new data to reconfirm the distinction between age and death costs, and importantly to highlight differences in average end of life costs between individuals with different characteristics.
To do this we use a new dataset that links together survey information on the demographic, socioeconomic and health characteristics of a representative sample of older people who died in England between 2007 and 2018 with their administrative hospital records from the five years before they died. These data come from respondents in the English Longitudinal Study of Ageing (ELSA) who gave consent for their survey responses to be linked to their hospital records in the Hospital Episode Statistics (HES). This represents an important advance in data availability and quality, allowing researchers for the first time to observe both the use of hospital services and the personal characteristics of a nationally representative sample of older people in England.
We find that the pattern of end-of-life spending varies across people who live with a partner and those who don’t. While spending 2-5 years prior to death was slightly lower for those with a partner, spending over the last 18 months of life was significantly higher. Importantly, this difference in spending is not explained by differences in the other observed characteristics of those with and without partners. When controlling for differences in the age, sex, underlying health conditions, and the cause of death of people in these groups, our estimates suggest that spending in the last 18 months of life was £1,569 higher for people in a couple relative to a person who is single. This means that spending over this period was 16% higher for those with a partner relative to mean spending for a single person (£9,852).
Why does spending vary across groups?
There could be a number of reasons as to why end-of-life spending varies across these groups. First, while we take into account observed differences in health between the different groups, there may be other differences in health that we cannot see that could explain the variation in spending. Second, there may be differential access to care. For example, partners may help to arrange or keep hospital appointments. Finally, there may be variation in the preferences for care across different groups: those with partners may have a greater willingness to undergo extensive treatment for a prolonged period of time. Establishing which of these channels are operating is important in thinking about how much care the NHS should provide to different people at the end of life, whether the current distribution of care is equitable, and whether there is scope to both lower costs and improve patient wellbeing by reducing the amount of care given to patients who do not want to undergo extensive treatment.
What does this mean for forecasts of health spending?
Even before we understand fully the mechanisms through which this operates, it still matter for forecasters. Between 2002 and 2014, the likelihood of living with a partner increased by 5% among the population aged 60 and older in England. This means that, all else equal, spending on inpatients in hospital in the last 18 months of life would have been around 1% higher in 2014 than in 2002, just because of changes in household composition. This trend of increased likelihood of living with a partner at older ages is expected to continue in future and so costs may be expected to rise even further. Factoring these household compositional changes into forecasts of health spending may improve the accuracy of such models, and therefore help us to better plan for meeting future healthcare costs.
Authors

George Stoye
I completed a PhD at UCL in 2020. My work examines the drivers of variation in the quantity and quality of healthcare provided to different patients.
More from IFS
Understand this issue


Policy analysis


Academic research


