Today the Scottish Government released the latest version of Government Expenditure and Revenue Scotland (GERS) covering 2017–18. In this observation we discuss what we can learn about Scotland’s fiscal position from these figures. And we look beyond the headline deficit figures to look at the trends in onshore revenue and government spending north and south of the border.
In broad-terms, relative to the size of its economy, Scotland has a much bigger deficit than the UK as a whole, and this looks set to continue. This reflects relatively high levels of government spending and relatively low levels of onshore tax revenues. Weak economic growth in the last few years seems to have depressed revenue growth, despite increases in devolved income taxes.
Scotland’s overall fiscal position – past, present and future
Figure 1 shows GERS estimates for Scotland’s and the UK’s net fiscal balance (i.e. their budget deficits or surpluses) between 2009–10 and 2017–18. It also shows our projections for the years between 2018–19 and 2022–23 which are based on the Office for Budget Responsibility’s (OBR’s) March 2018 forecasts and the UK government’s tax and spending plans at that time.
Figure 1. Net fiscal balance, UK and Scotland, 2009–10 to 2017–18 (outturns) and 2018–19 to 2022–23 (projections), % of GDP
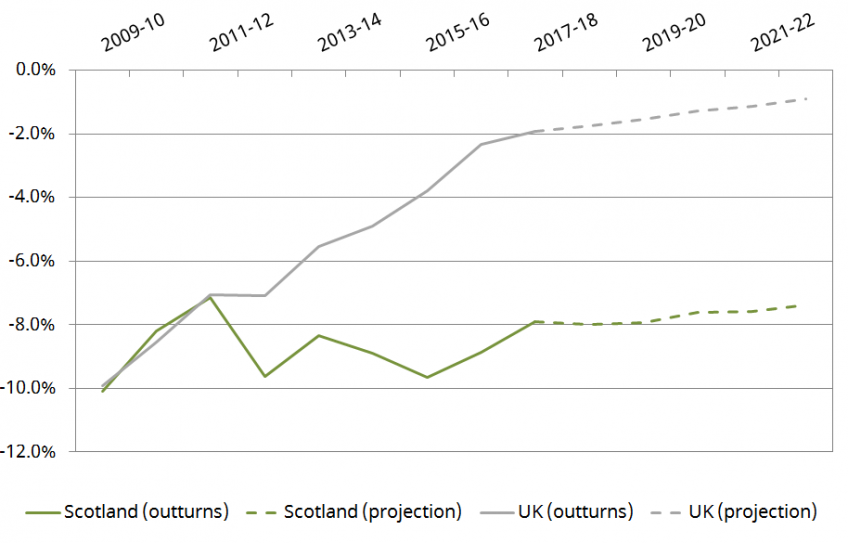
Source: Author’s calculations using GERS 2017–18 and the OBR’s Economic and Fiscal Outlook: March 2018.
The GERS estimate for Scotland’s implicit budget deficit in 2017–18 was 7.9% of GDP. This compares to 1.9% for the UK as a whole: a ‘fiscal gap’ of 6.0% GDP or around £10.3 billion. That means extra borrowing of £1,885 per person in Scotland, on top of the £600 being borrowed by the government for every person in the UK.
Under current fiscal arrangements, it is the UK government and UK taxpayers that have responsibility for dealing with the vast majority of these higher borrowing levels. However, the Scottish Government can borrow a relatively small amount to invest or smooth its revenues and spending. The £450 million the Scottish government borrowed to invest in 2017-18 explains around 4.5% of the ‘fiscal gap’ of £10.3 billion.
Figure 1 also shows that while Scotland’s implicit budget deficit has fallen from 9.7% of GDP in 2015-16, the fiscal gap with respect to the UK has remained roughly constant at around 6% of GDP. That large gap developed between 2011-12 and 2015-16 as falls in oil production and then oil prices took their toll on offshore tax revenues from the North Sea (which GERS allocates to Scotland on a geographical basis). North Sea revenues have risen a lot in percentage terms since 2015-16 (from £50 million to £1.3 billion in 2017-18) but remain a fraction of their 2011-12 levels (£7.9 billion). Without these increased oil revenues the fiscal gap would have increased from 6% to 6.7% of Scottish GDP.
Looking to the future, the OBR forecasts are for oil and gas revenues to remain at current low levels (indeed to fall back a little). Thus, while forecast growth in onshore revenues and continued restraint on public spending means we project a fall in Scotland’s implicit budget deficit from 7.9% of GDP in 2017-18 to 7.4% of GDP in 2022-23, we project the fiscal gap with respect to the rest of the UK to grow slightly. Our projection is for borrowing to be 6.5 percentage points of GDP higher than for the UK as a whole in 2022-23: a gap of £13.0 billion in cash terms. The total budget deficit for Scotland in that year is projected to be £14.6 billion.
Government spending in Scotland
The main reason for Scotland’s higher implicit budget deficit is that government spending per person is higher than the UK average while onshore tax revenues are a little lower than the UK average. For instance, Table 1 shows that in 2017–18, government spending per person was 13.2% above the UK average, but onshore revenues were 4.7% below the UK average. At their current low levels, offshore oil and gas revenues from the North Sea can only make up a small part of this difference.
The Table also shows that government spending per person in Scotland has increased relative to the UK average in recent years: it was 11.3% above average in 2015–16 and 9.5% above average in 2009–10. This results in part from the way the Barnett formula works – during periods of fiscal restraint it ensures that Scotland (and the other devolved nations) don’t quite suffer from the full force of spending cuts being made by the UK government. In addition, as mentioned above, the Scottish Government has been making use of devolved borrowing powers to invest more in new infrastructure and facilities since 2015–16.
Table 1. Scottish public expenditure and onshore revenues per person, as a percentage of the UK averages, 2009–10 to 2017–18
Fiscal aggregates | 2009–10 | 2011-12 | 2013-14 | 2014–15 | 2015–16 | 2016–17 | 2017–18 |
Scotland as % of UK |
|
|
|
|
|
|
|
Expenditure per person | 109.5% | 111.0% | 111.2% | 110.6% | 111.3% | 112.3% | 113.2% |
Onshore revenue per person | 97.4% | 96.9% | 97.5% | 97.3% | 95.6% | 94.7% | 95.3% |
Source: Author’s calculations using GERS 2017–18.
Delving deeper into the figures, Table 2 shows where the extra government spending in Scotland goes, and which areas explain the increases in spending in relative to the UK.
Table 2. Scottish public expenditure per person by service area (selected services) as a percentage of the UK average, 2009–10, 2015–16, 2017–18
Service area | 2009–10 | 2015–16 | 2017–18 |
Scotland as % of UK |
|
|
|
Social protection (inc. benefits and pensions) | 106.8% | 106.8% | 106.9% |
Health | 108.7% | 106.4% | 107.1% |
Education and training | 104.0% | 112.0% | 116.3% |
Transport | 153.3% | 136.6% | 150.0% |
Recreation, culture and religion | 136.5% | 145.3% | 144.5% |
Enterprise and economic development | 135.0% | 177.6% | 185.6% |
|
|
|
|
Investment (capital) spending | 116.9% | 116.9% | 130.6% |
Day-to-day (current) spending | 108.5% | 110.7% | 111.2% |
Source: Author’s calculations using GERS 2017–18.
The table orders service area by overall spending levels (from largest to smallest). It shows that government expenditure per person is higher for all service areas but the biggest differences are for the smaller service areas. For instance, spending per person on social protection – which includes benefits and pensions – and health is only around 7% higher than the UK average. On the other hand, spending per person on transport is around 50% higher, and on enterprise and economic development over 85% higher than the UK average.
The table also shows that since 2009–10, while spending per person on health has fallen slightly relative to the UK average, spending per person on education and training has risen significantly (from 104% to 116% of the UK average). This may reflect the Scottish Government’s higher education and early-years policies. Spending per person has on recreation, culture and religion and enterprise and economic development has also increased relative to the UK average. This is in spite of significant real-terms cuts to these areas in Scotland (21% in both cases): spending has been cut even more (26% and 43%, respectively) across the UK as a whole.
The table also shows that most of the increase in government spending in Scotland relative to the UK as a whole since 2015–16 reflects higher capital investment: capital spending per person in 2017–18 was over 30% higher than the UK average, compared to 17% higher in 2015–16.
These differences will reflect different prioritisations by the Scottish and UK governments and the use of Scotland’s new borrowing powers for investment.
Scottish onshore tax revenues
Turning to revenues, Table 3 shows that among the big three taxes, substantially less is raised per person from income tax in Scotland than in the UK as a whole, whereas revenues from VAT and National Insurance Contributions are much more similar. Relatively low income taxes reflect the fact that a lot of income tax is raised from those with the very highest income – a relatively small fraction of whom live in Scotland (most live in London and the South East of England). This and the fact that house prices are lower in Scotland also explains why revenues from stamp duty, capital gains and inheritance taxes are substantially lower the UK average.
Table 3. Scottish onshore revenues per person by tax (selected taxes) as a percentage of the UK average, 2009–10, 2015–16, 2017–18
Service area | 2009–10 | 2015–16 | 2017–18 |
Scotland as % of UK |
|
|
|
Income tax | 87.3% | 86.0% | 84.5% |
National Insurance Contributions | 97.5% | 96.5% | 96.9% |
Value added tax (VAT) | 102.5% | 101.1% | 98.7% |
Alcohol, tobacco and fuel duties | 109.9% | 111.4% | 112.5% |
Corporation tax (onshore) | 84.9% | 83.7% | 84.8% |
Business rates | 102.8% | 109.3% | 112.0% |
Council tax | 90.3% | 85.2% | 85.5% |
Stamp duty, capital gains and inheritance taxes | 83.9% | 62.3% | 60.9% |
Non-tax revenues | 117.4% | 111.1% | 116.4% |
Source: Author’s calculations using GERS 2017–18. Note that stamp duty, capital gains and inheritance taxes figures include the new Scottish land and buildings transaction tax.
On the other hand, more is raised per person from alcohol, tobacco and fuel duties, business rates and non-tax revenues than in the UK as a whole.
The table also provides insight into why overall onshore revenue growth per person has been slower than the UK since 2009–10.
It shows that revenues from income tax and VAT have dipped a little relative to the UK average. The findings for income tax may seem surprising given that the Scottish Government froze the higher rate tax threshold in 2017–18 in order to bring in additional revenue. It likely reflects two things.
First, the fact Scotland has relatively few very high earners mean that higher taxes on this group (e.g. due to the additional rate of income tax, and restrictions to tax relief for pension contributions) raise relatively less in Scotland. Related to this, the increase in the income tax personal allowance will have cost relatively more in Scotland.
Second is that the Scottish economy has grown less quickly than the UK’s in recent years. Onshore GDP per capita has barely grown at all since 2014–15 (while it is up 3.7% for the UK as a whole), and is up 7% since 2009–10, compared to 10% for the UK as a whole. A slower economy will generate less tax revenues.
Revenues from stamp duty, capital gains and inheritance tax fell much more relative to the average for the UK as a whole: from 83.9% in 2009–10 to 60.9% in 2016–17. This is because house prices have not recovered as strongly as they have elsewhere – particularly in London and the South East of England.
Revenues from council tax also fell relative to the UK average. This likely reflects the Scottish Government’s long-standing council tax freeze, and its decision to fully fund council tax benefit (which pays the council tax bills of low income households) when it was devolved to Scotland in 2013–14. The slight uptick in revenue since 2015–16 reflects the Scottish Government’s decision to increase tax rates on the highest-valued properties – although this has been offset to some extent by the slower increase in the Band D rates charged by Scottish councils.
It is worth noting that some revenue streams have bucked the trend. For example, revenue from business rates has grown from 103% to 112% of the average since 2009–10. This will largely reflect faster growth in the tax base (i.e. the stock of non-residential property) rather than changes in tax policy.
Summary
Overall, the GERS figures continue to paint a fascinating picture of Scotland’s public finances. They are, of course, estimates and can be subject to revision as updated data becomes available. But they are credible and as we highlighted recently, it’s therefore welcome that the SNP’s Growth Commission used them as the basis of its fiscal plans. This year’s figures continue to paint a relatively weak fiscal picture that is likely to persist unless there is a strong rebound in oil revenues or a substantial increase in Scottish economic growth. Relying on the former would be a particular gamble, which is why the Growth Commission’s emphasis on boosting productivity growth is so important.
Notes on methodology for projecting Scotland’s fiscal position beyond 2017–18
In order to project forward the GERS 2017–18 figures to the period covering 2018–19 to 2022–23 using figures from the OBR’s March 2018 EFO, the following method is used:
- Spending is projected on the basis that government spending in Scotland remains the same proportion (9.3%) of UK-wide government spending as in 2017–18.
- Onshore taxes are projected on the basis that the amount paid per person in Scotland grows in line with forecast growth in onshore revenues per person for the UK as a whole. This means onshore tax revenues per person in Scotland are projected to be 95.3% of the average for the UK as a whole, as in 2017–18.
- Offshore (oil and gas) taxes are projected under the assumption that Scotland’s share of overall UK offshore tax revenues remains the same as in 2017–18 at 111.3% (i.e. revenues from the rest of the UK are projected to be negative as they were in 2017–18).
We have chosen the assumptions on the basis of their simplicity and as a reasonable baseline case. As with any economic or fiscal forecast or projection, the projections outlined in this observation will differ from eventual outturns. This includes the OBR forecasts for the UK as a whole; and trends in spending and government revenues in Scotland relative to the UK.
Note that projections for the UK and Scottish net fiscal balances are based on OBR spending and revenue forecasts from prior to recent announcements about NHS funding. Estimates of the fiscal gap between Scotland and the UK as a whole should be robust to this announcement though as extra spending (and the extra tax revenues to pay for it) would have a very similar impact on the fiscal positions of Scotland and the UK as a whole.
Authors

David Phillips
David is Head of Devolved and Local Government Finance. He also works on tax in developing countries as part of our TaxDev centre.
More from IFS
Understand this issue


Policy analysis


Academic research


