
This comment has been updated following new estimates of average earnings growth in May–July 2026 from the Office for National Statistics published on 15 September.
Each April, the level of the state pension (or, more precisely, the flat-rate parts of the state pension) is increased in line with the ‘triple lock’. This means that payments increase by the highest of CPI inflation, average earnings growth, or 2.5%.
The triple lock has materially increased the generosity and cost of the state pension since its introduction in 2011. Given current levels of inflation and average earnings growth, it is very likely that the increase in the level of the state pension that occurs in April 2027 will be determined by the rate of average earnings growth.
The earnings growth figure to be used in this calculation was released by the ONS today (15 September). Average total earnings were 3.9% higher in May-July 2026 than in the same period last year, in line with expectations.
Unless this figure is revised, this implies that the full new state pension will increase from the current £241.30 per week (or around £12,500 per year), to £250.70 per week (or around £13,000 per year) next April. The full basic state pension would increase from £184.90 per week (or around £9,600 per year) currently, to £192.10 per week (or around £10,000 per year) next April.
This Comment answers key questions about the triple lock: how much has it cost so far; what does it mean for pensioner incomes; and why are the effects of the triple lock so uncertain?
How much does the government spend on the state pension, and how much has the triple lock increased spending?
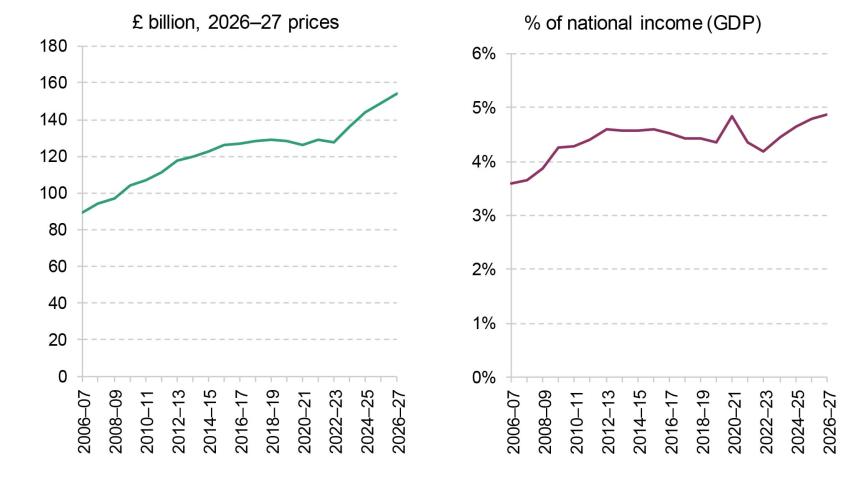
Public spending on the state pension is currently (in 2026–27) £154 billion per year. It is by far the largest benefit in the UK. Compared with departmental spending, it is similar in magnitude to the combined annual budgets of the Ministry of Defence and the Department for Education.
Between 1980 and 2010, the state pension increased each year in line with inflation. But with strong real earnings growth over those decades, growth in the state pension fell well behind growth in the average earnings that workers were receiving. Concerned by this, and following the recommendations of the 2002–06 Pensions Commission, in the mid-2000s the Labour government committed to increase the state pension in line with average earnings growth.
The Coalition government went a step further by introducing the triple lock. Since 2011 the flat-rate components of the state pension (the ‘basic’ and ‘new’ state pensions) have been uprated in line with the triple lock. Together these triple-locked components form the vast majority (£131 billion) of state pension expenditure. Smaller elements of state pension spending (e.g. earnings-related state pensions) continue to rise in line with CPI inflation.
Annual state pension spending is now £47 billion higher in real terms (i.e. after accounting for inflation) than it was in 2010 (Figure 1). This is a marked increase and comes despite significant increases in the state pension age (especially for women). The triple lock is not the only reason for this increase in spending, but it is an important one. Indeed, spending on the state pension is now £16 billion per year higher than it would have been in absence of the triple lock. As a fraction of GDP, the government now spends 4.9% of national income on state pension spending, up from 4.3% in 2010 and 3.6% 20 years ago in 2006–07.
Figure 1. Annual spending on the state pension in levels (left panel) and as a share of national income (right panel)
Source: https://www.gov.uk/government/publications/benefit-expenditure-and-caseload-tables-2026. Forecast figures (2025–26 and 2026–27) for state pension spending and GDP are consistent with the Spring 2026 Economic and Fiscal Outlook (EFO) published by the Office for Budget Responsibility (OBR) in March 2026. Forecasts reflect the government’s delivery plans and the OBR’s additional judgements, as set out in the EFO.
How are pensioner incomes changing over time?
The increase in real value of the state pension has contributed to higher pensioner incomes. A full ‘new state pension’ is currently (2026–27) worth around £12,500 per year. If instead of the triple lock, flat-rate state pensions had risen in line with average earnings since 2010, this would be 12% lower than today’s value, or worth approximately £1,500 per year less.
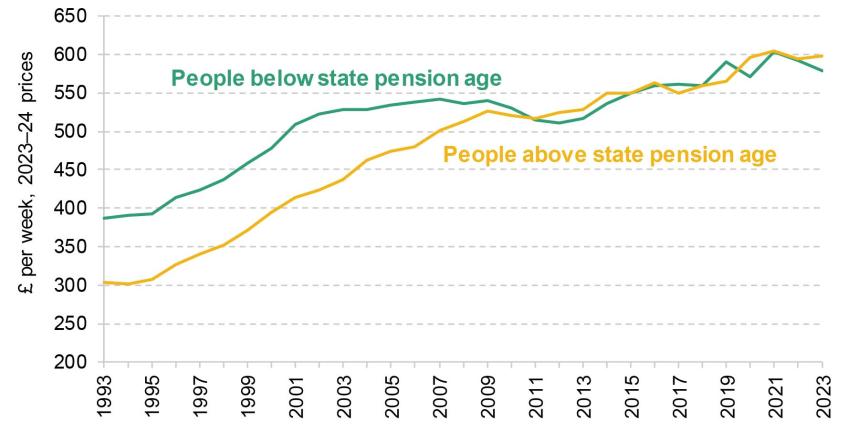
While this is not the only reason for rising pensioner incomes (rising employment and private pensions have also contributed), the triple lock has therefore played an important role. The median (middle) disposable household income for pensioners rose by 15% between 2010 and 2023, as shown in Figure 2. The Figure also shows that the median income of pensioners is now at a similar level to the median income of non-pensioners (after deducting housing costs). In contrast, 30 years ago pensioners had 20% lower incomes at the median than people under state pension age. The relative income poverty rate among pensioners in the latest data is around 14%, compared with 20% among the population as a whole.
Figure 2. Median household disposable incomes of pensioners and non-pensioners over time, £ per week, 2023–24 prices
Source: Authors’ calculations using the Family Resources Survey and Family Expenditure Survey, various years. Note: Incomes are measured after housing costs are deducted and adjusted (equivalised) for household size and structure and expressed as the equivalent for a childless couple.
How much would it cost to keep the triple lock and why is it so uncertain?
The government is currently committed to keeping the triple lock until the end of this parliament. Over this period the triple lock is likely to push up the cost of the state pension system (compared with a baseline of increases in line with average earnings) but not to a dramatic degree.
The economic forecasts from March produced by the Office for Budget Responsibility suggest that in April 2027, the state pension would rise in line with average earnings. Its forecast suggests that in April 2028 and April 2029, the state pension would increase by 2.5% (above both earnings growth and inflation). If these forecasts were borne out, the triple lock would push up state pension spending by a further £600 million per year by 2029–30.
Compared with overall state pension spending, this increase is small. But it is ‘locked in’. It comes on top of previous increases, and future increases would build on top of it. These all add up over time. Moreover, changes to the macroeconomy since March, specifically the conflict in the Middle East, have driven up energy prices and expectations of inflation. If this drives up inflation materially faster than earnings growth, it would mean a further increase in the cost of maintaining the triple lock.
This scenario helps show why it is so hard to know what the cost of keeping the triple lock would be over the longer term. The cost depends on exactly how earnings and inflation change over time. This means that, although our previous modelling suggests that keeping the triple lock until 2050 would cost around £20 billion per year in expectation, in practice this figure could reasonably be anywhere between £5 billion and £40 billion per year. If economic growth translates into steady earnings growth in excess of inflation (and 2.5%) in most years in coming decades, the cost is likely to be at the lower end of this range. If instead we experience a volatile macroeconomy, with inflation and earnings growth rising and falling at different points, the cost is likely to be much higher.
While the triple lock has now been in place for more than 15 years, at some point a government will have to decide to move away from it towards a more predictable and less costly way of uprating the state pension over time. As discussed in the IFS Pensions Review, one attractive option would be the system used in Australia, where the level of the state pension increases in line with average earnings in the long run, but temporary protection against inflation is provided when it is in excess of average earnings growth.
For press
On Tuesday (15 September), the Office for National Statistics (ONS) released their estimate of average earnings growth in May–July 2026, of 3.9%. Given the rules of the ‘triple lock’, this will likely determine next April’s increase in the value of the state pension.
Unless these figures are revised, this implies that the full new state pension will increase from the current £241.30 per week (or around £12,500 per year), to £250.70 per week (or around £13,000 per year) next April. The full basic state pension would increase from £184.90 per week (or around £9,600 per year) currently, to £192.10 per week (or around £10,000 per year) next April.
State pension spending this year is expected to be £154 billion. The triple lock has increased annual spending on the state pension by around £16 billion, compared with uprating in line with average earnings growth since 2010.
Current forecasts from the Office for Budget Responsibility suggest that the triple lock will push up state pension spending by £600 million per year in 2029–30, compared with a baseline of increases in line with average earnings. While this is small compared with total state pension spending, each increase adds up over time and the triple lock’s ratcheting effect permanently locks in increases in spending. This is both costly and very uncertain in the long run, because it depends on the exact path of inflation and earnings.
We estimate that by 2050 keeping the triple lock would, in expectation, cost around £20 billion per year in today’s terms. But the high uncertainty means that, in fact, the cost could reasonably be anywhere between £5 billion and £40 billion per year.
Jonathan Cribb, Deputy Director at IFS, said:
“The triple lock is forecast to push up state pension spending by around £600 million per year by 2029–30, though the cost would be higher if inflation spikes. Each increase in spending builds upon the last, and so the long-run cost is substantial but very uncertain. If the triple lock were kept in place until 2050, its cost would be around £20 billion per year in expectation, but could reasonably be anywhere between £5 billion and £40 billion per year. The more volatile inflation and average earnings growth are, the higher the cost.”
Authors

Jonathan Cribb
Jonathan joined IFS in 2011. His research areas includes: pensions, ageing and demographic change, public sector pay, housing, and inequalities.

Heidi Karjalainen
Heidi is a Senior Research Economist in the Retirement, Saving & Ageing sector. Her current research is on pensions and saving for retirement.
More from IFS
Understand this issue


Policy analysis


Academic research


