
The increase in economic inactivity since the pandemic is a focus for the current government, with policies aimed at boosting workforce participation expected in the upcoming Budget. Most of the rise in inactivity has been among 50- to 64-year-olds. New data provide tentative indications that the trend may be turning – though it is too early to say for sure – likely reflecting financial pressures from the cost of living crisis.
Previous research has shown that, since the pandemic, the increase in the numbers of older workers leaving work has been largely driven by people who describe their main reason for inactivity as retirement.1 On average, those who left work during the so-called ‘Great Retirement’ appeared relatively well off and expressed little desire to return to work. As such, many commentators have understandably expressed scepticism about the likelihood of a quick rebound in activity levels among older workers.
How durable these early retirements are, however, was always likely to be tested by the rapid erosion of living standards during the cost of living crisis. New data from the Labour Force Survey show signs of a possible reversal, though more data are needed to establish a change in trend. In October–December 2022, there was a sharp and statistically significant uptick in 50- to 64-year-olds moving out of inactivity and back into the workforce (Figure 1).2 In particular, there has been an uptick among people who had been out of work for less than three years – that is, they had left the workforce after the pandemic began – who accounted for the majority (57%) of the 197,000 50- to 64-year-olds who moved out of inactivity in the latest quarter.3
Figure 1. Share of economically inactive 50- to 64-year-olds moving into workforce in next quarter, by period and when they last worked
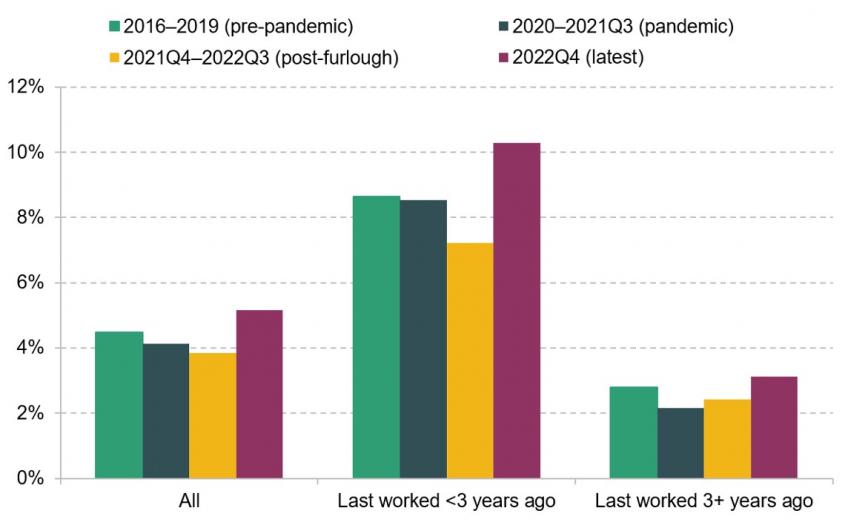
Note: ‘Quarter’ refers to quarter in which left economic inactivity (second quarter in two-quarter longitudinal data). Never worked included in last worked 3+ years ago. Workforce refers to people who are either in work or looking for work.
Source: Authors’ calculations using Two-Quarter Longitudinal Labour Force Survey.
The uptick in flows out of inactivity led to a small drop in the inactivity rate among 50- to 64-year-olds, from its post-pandemic peak of 27.7% in May–July 2022 to 27.1% in October–December 2022 (Figure 2). It is still too early to tell whether this is a temporary blip or the start of a new trend, and the graph is very instructive in putting this relatively small change into its longer-term context. That said, there are reasons to think that we might have reached a turning point, and that we might continue to see higher flows out of inactivity in the months to come.
Figure 2. Share of 50- to 64-year-olds who are economically inactive
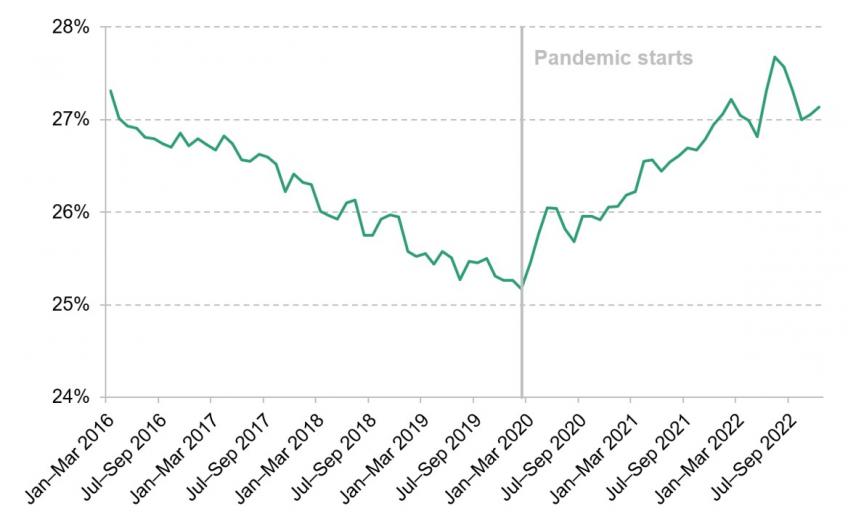
Note: Seasonally adjusted. Shows three-month moving average.
Source: ONS A05 dataset.
First, the share of economically inactive 50- to 64-year-olds who say they would ‘probably’ or ‘definitely’ not work again has fallen for two consecutive quarters, from 68.9% in April–July 2022 to 65.9% in October–December 2022 (Figure 3). Second, the share of economically inactive 50- to 64-year-olds who say they would like to work has also ticked up in the last few quarters.4
Figure 3. Shares of economically inactive 50- to 64-year-olds who say they would like to work, and who say they would ‘probably’ or ‘definitely’ not work again
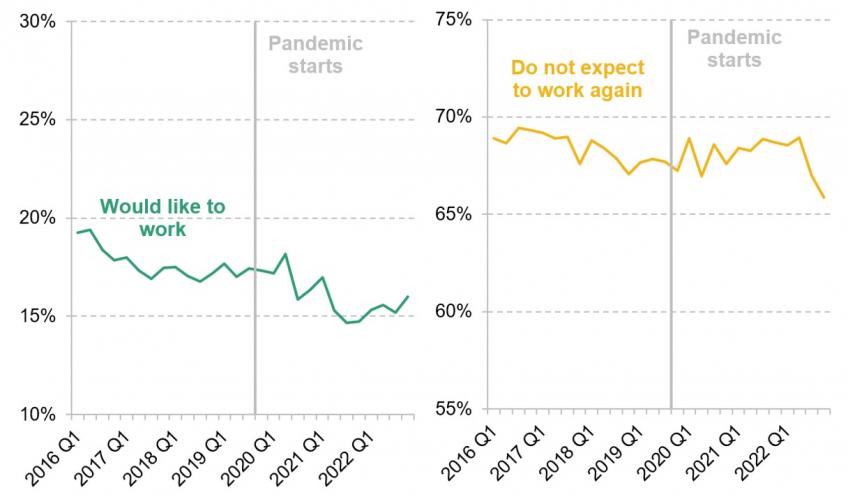
Source: Authors’ calculations using Quarterly Labour Force Survey.
A few early indicators therefore point in the same direction: we may be seeing some return to the labour force among older workers, and we should not write off the possibility of a wave of ‘unretirements’. As yet, however, any change has been very small compared with what we have seen since 2020, and it is not clear whether it will become an established trend.
The bigger picture is that, if indeed there is a turnaround and it has been triggered by the cost of living crisis, it is no cause for celebration – that would represent people responding to becoming poorer. At best one might read it as evidence that some of these people are not as far removed from the labour market as we might have thought, meaning that perhaps policy action could entice them to return for more positive reasons than an inflation shock.
For the wider labour market and public finances, the bigger issue remains longer term: will future cohorts of older workers follow the recent ones in exiting the labour force earlier? And this in turn links to the whole life course – greater labour market attachment earlier in life is likely to lead to greater attachment later. Whether an ‘unretirement’ is under way or not, we would agree with views expressed by others that in the forthcoming Budget, the Chancellor would be well advised to take a broad view of labour force participation and its causes, rather than focusing merely on undoing what has happened since 2020.
This work was funded by the Fund for International Collaboration (FIC) and by ESRC on behalf of UKRI (grant reference ES/W01159X/1).
Endnotes
Authors

Xiaowei Xu
Xiaowei joined the IFS in 2018 and works in the Income, Work and Welfare sector.

David Sturrock
David’s research covers household wealth, intergenerational transfers, social mobility, pensions taxation, and health and work at older ages.
More from IFS
Understand this issue


Policy analysis


Academic research


