The Welfare Benefits Up-rating Bill, which gets its Second Reading in the House of Commons tomorrow, proposes to cap the annual increases in most working-age benefits at 1% in cash terms in 2014–15 and 2015–16, in addition to the 1% cap on increases already confirmed for 2013–14.
By default, working-age benefits and tax credits are up-rated each April in line with the Consumer Prices Index (CPI) in the preceding September. CPI inflation was 2.2% in September 2012 and is forecast to be 2.6% and 2.2% in the Septembers of 2013 and 2014 respectively. The government plans instead to uprate the majority of these benefits by 1% for the next three years (though only the proposed April 2014 and April 2015 cash increases are included in the bill). Given current forecasts of inflation, this implies a cumulative 4% real cut in the benefits affected. The actual real-terms cut, though, will depend on future levels of inflation. If inflation is much lower than forecast then the real cuts will be small. If it is higher than forecast then the real cuts will be bigger than is currently expected. Similarly the effect of the measures on benefit levels relative to earnings levels will depend upon future rates of earnings growth. There is an arbitrariness to this eventual outcome. That is the result of specifying future benefit changes in nominal terms rather than, for example, relative to actual price or earnings changes.
When announcing the policy, the Chancellor drew attention to the fact that out-of-work benefit rates have grown substantially faster than earnings since 2007, as shown in Figure 1. This essentially reflects the fact that earnings have not kept pace with inflation, whereas rates of out-of-work benefits (Income Support, Jobseeker’s Allowance and Employment and Support Allowance) have risen broadly in line with prices (though there have been discretionary cuts to the rates of other benefits and tax credits).
Figure 1. Earnings and out-of-work benefits (Jan 2007 = 100)
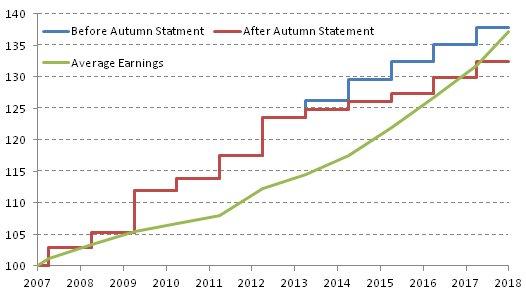
Sources: Past earnings from ONS series DTWM, ROYK, MGRZ, MGRQ, past benefits from DWP (JSA personal allowance for a single person over 25), forecasts of inflation and earnings growth from OBR
If earnings fall relative to benefit levels, then being in work becomes less financially attractive, all else equal. At present, out-of-work benefits for a home-owning couple without children stand at 27.7% of what the family’s net income would be if one of the couple earned £560 per week. If instead earnings had grown as fast as benefit rates since 2007, that fraction would have been 25.3%. However, higher wages would not have significantly affected the incentive to work for all groups. For a lone parent with two children and rent of £100 a week working 16 hours a week at the minimum wage, out-of-work income is 80% of in-work income in both scenarios, because almost all of the additional earnings are lost in withdrawn benefits.
There is, of course, nothing special about relativities in 2007. Historically, earnings have tended to rise in real terms and hence outstrip price-indexed benefit rates (although, particularly for families with children, above-indexation increases have seen some entitlements grow considerably faster than prices). Relative to that “normal” scenario, the recent fall in earnings compared to out-of-work benefits looks even more striking. On the other hand this is a reminder that when real earnings growth returns, current policy implies that benefit rates will fall relative to earnings.
Figure 2 shows the distributional effect of the benefit reductions contained in the Welfare Benefits Up-rating Bill in the context of all the Autumn Statement tax and benefit announcements and the consolidation package as a whole. This shows that the majority of the impact of the Autumn Statement announcements will come through the changes to up-rating policy set out in the Bill, but that this is only a small fraction of the net ‘takeaway’ from households resulting from the overall fiscal consolidation.
As far as the effects of benefit up-rating measures are concerned, reductions in entitlement are unsurprisingly concentrated in the bottom half of the income distribution. The lowest-income decile group see the largest fall in entitlements as a percentage of income (1.5%) as a result of measures in the Bill, and the second decile see the largest decrease in cash terms, losing about £150 per year on average.
Because the proposed uprating changes apply to almost all benefits and tax credits, both in-work and out-of-work households are affected. Of 2.8 million workless households of working age, 2.5 million will see their entitlements reduced, by an average of about £215 per year in 2015 –16. Of 14.1 million working-age households with someone in work, 7.0 million will see their entitlements reduced, by an average of about £165 per year. Note that this figure includes 3.0 million families who lose only from the cuts to Child Benefit, at an average of about £75 per year (monetary amounts are in current prices).
As the chart shows, other elements of the consolidation package have been much more significant, especially for those with the very highest incomes. It is important to see the effects of this Bill alongside the other tax and benefit changes, as well as falling real earnings which have hit those in the middle and upper parts of the overall distribution the hardest.
Figure 2: Distributional impact of tax and benefit reforms
January 2010 - April 2015 inclusive, as if Universal Credit fully in place
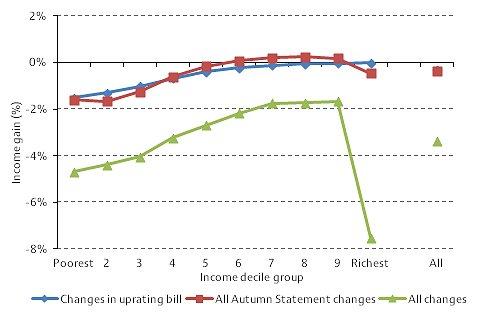
Note: Income decile groups are derived by dividing all households into 10 equal-sized groups according to income adjusted for household size using the McClements equivalence scale. Source: Authors’ calculations using 2010–11 Family Resources Survey and TAXBEN, the IFS’ tax and benefit micro-simulation model.
When cutting public spending dramatically to help reduce an unsustainable budget deficit it is almost inevitable that spending on benefits and tax credits – which account for 30% of the government’s total budget – will be targeted. This policy achieves savings through an across-the-board reduction in the real value of benefits for people of working age at a time when real earnings have been falling.
But we don’t know two things. First, the actual effects of the bill on real benefit rates are unknown, because they depend on future price levels. This exposes the poorest in society to inflation risk. Second, we don’t know the government’s view on how benefit rates should be indexed in the longer run. We ought to.


