
Next week, on 23 March, the Chancellor will deliver the 2022 Spring Statement. In the just over two years since taking office, Mr Sunak has presided over four major fiscal events. During that time, his tax policy has been characterised by large temporary tax cuts – targeted primarily at providing immediate support to sectors hit hardest by the economic effects of the COVID-19 pandemic – coupled with even larger (and permanent) tax rises, backloaded to the final years of the parliament.
If current plans are enacted, the scale of the tax increases will be large by historic standards. These will start this April with an increase in rates of National Insurance Contributions and a cash freeze in income tax thresholds, and be followed by an increase in corporation tax rates in April 2023. The overall impact will be to gradually ramp up the UK tax burden by an eventual 2% of GDP, according to the Treasury’s own scorecard – equivalent to around £46 billion in today’s money.
In this observation, we briefly examine the tax changes announced by this government so far, before placing them in the wider context of 50 years of fiscal policy by comparing to the tax changes made by Prime Ministers and Chancellors since 1970.
The scorecard giveth and the scorecard taketh away
Figure 1 shows the forecast impact of all tax policies announced under Mr Johnson’s premiership. Over the last two years there have been substantial temporary tax giveaways – notably a large cut to business rates – implemented in response to the pandemic. These have acted to reduce tax revenue as a share of GDP, relative to what was expected before Mr Johnson took office.
Starting from April, however, the expiry of these temporary tax cuts, in combination with the implementation of a substantial increase in the rates of National Insurance Contributions announced last year will see that trend reverse. Tax as a share of GDP will increase. And it will increase further in coming years as a result both of the ongoing effect of income tax thresholds being frozen in cash terms at their April 2021 levels and a large increase in the corporation tax rate scheduled for April 2023. By 2024-25, government policy is set to have added 2% of GDP to the UK tax burden.
This would represent a substantial increase in the size of the British state. To give a sense of scale, an additional 2% of GDP would be enough, in today’s terms, to roughly double the nation’s annual defence budget or increase education spending by around 50% a year (though, in reality, most will likely flow to the burgeoning health and social care budget).
Figure 1. Forecast impact of tax policies announced by the current prime minister
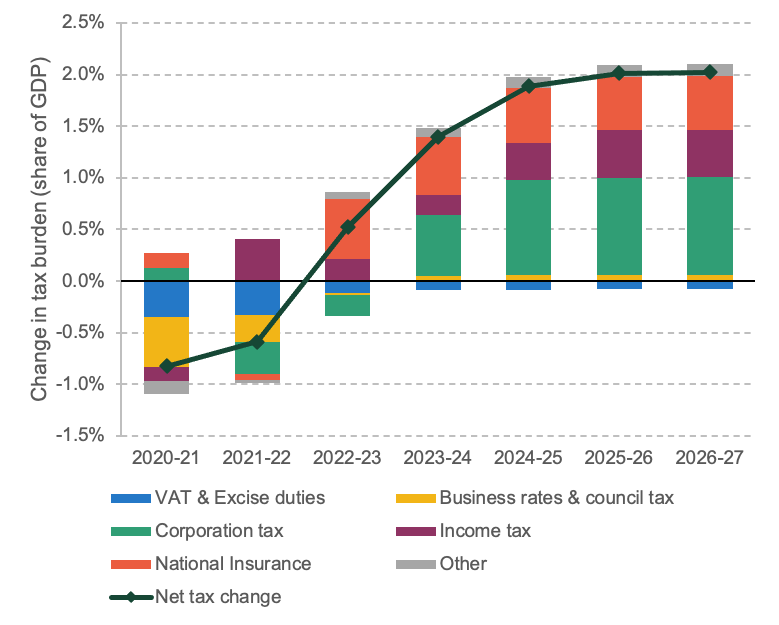
Notes: The costing of each policy is taken from the forecast provided by the Treasury ‘scorecard’ at the fiscal event when the policy was announced, divided by nominal GDP as forecast at that fiscal event. Updated scorecards published at subsequent fiscal events are not considered. National Insurance includes the health and social care levy. Corporation tax includes changes to the digital services tax and the bank surcharge. Figures exclude spending impacts of tax measures (for example through adjustments to Scotland’s block grant).
Source: Authors’ calculations using policy costings from OBR Policy measures database (Dec 2021), historical GDP forecasts from OBR Historical official forecasts database (Oct 2021).
Planned tax rises are on a historic scale
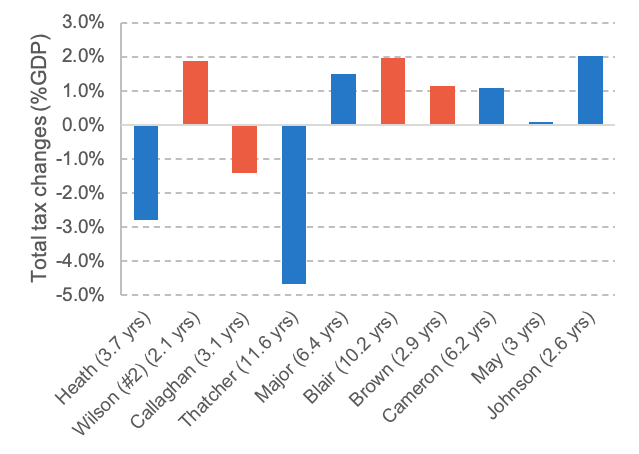
The 2% of GDP increase in taxation that, under current plans, the UK will be facing by 2024-25 is large by historical standards. Figure 2 compares the total magnitude of permanent tax changes (i.e. excluding temporary tax cuts or rises) announced by each chancellor and prime minister to take office since 1970.
In only slightly more than two years, the current chancellor has announced tax rises of a similar scale to those seen under Gordon Brown’s chancellorship. Given that Mr Brown’s period in the Treasury stretched for almost a decade, the annual rate of increase in taxation announced under the current administration is substantially higher. Not since Margaret Thatcher – who enacted substantial tax cuts in the latter years of her premiership – has a prime minister announced policy changes that act to reduce, rather than increase, the overall tax burden.
Two caveats should be borne in mind when considering the current government’s place in Britain’s fiscal history. First, the tenures of the current occupants of Numbers 10 and 11 Downing Street are not yet over. The coming years could yet see the announcement of tax reductions (or cancellations of planned increases) that would make the current administration seem less high-taxing – although it is extremely hard to imagine that plans could change by so much that taxes would be cut overall.
Second, Figure 2 is based on forecasts made at the point when policies were first announced. They should be thought of as what a chancellor intended when initially setting out policy. If circumstances change (or forecasters’ assumptions turn out to be wrong), these estimates will not always capture the true long-term impact of a given policy. For example, when Mr Sunak announced a freeze in income tax thresholds in March 2021, he expected it to raise around £8 billion. Since then, inflation has been much higher, such that under the latest forecasts it could raise as much as £21 billion.
Such differences (between the initial forecast effect of a tax policy and the eventual outturn), as well as underlying economic conditions, mean that the tax policy changes set out in Figure 2 will not equate to the ultimate change in the burden of tax during a given premiership or chancellorship. Figure 2 shows the impact of announced policies relative to a world in which that policy was never implemented. Other factors – such as changes in the size and structure of the economy – will affect what ultimately happens to overall tax revenues as a share of GDP, which could change by more or less than implied by policy changes.
For example, Mrs Thatcher announced policies that were forecast to reduce the tax burden by 4.7% of GDP (see Figure 2). Yet, as shown in Figure 3, overall tax revenue as a share of national income fell by only 0.8% during her time in office. This was in part due to growth at the higher (and more heavily taxed) end of the income distribution, and burgeoning profits in the finance, oil and gas industries. In the absence of policy changes, Mrs Thatcher’s period in office would likely have been a period of substantial growth in government tax receipts.
Figure 2. Total permanent tax changes announced while in office
(a) Prime Ministers
(b) Chancellors
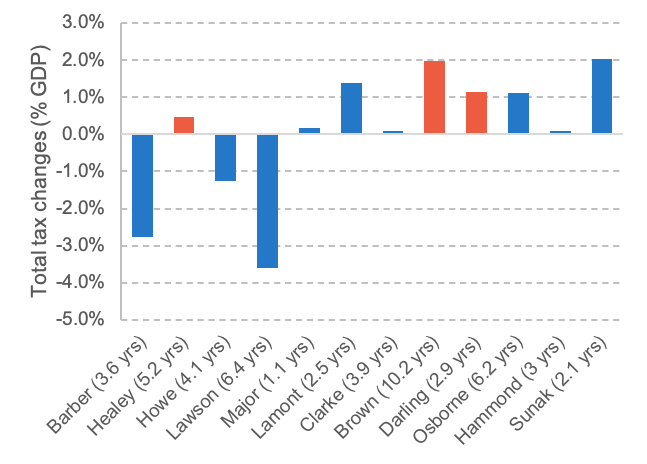
Notes: Chart shows the total change in taxation announced at fiscal events presided over by each chancellor/prime minister. Policy costings are based on the final year forecast of the Treasury ‘scorecard’ at each fiscal event divided by nominal GDP as forecast at that fiscal event. Updated scorecards published at subsequent fiscal events are not considered. For fiscal events prior to the 1982 Budget, contemporary GDP forecasts are not available, and outturn nominal GDP has been used in its place. Only chancellors/prime ministers who took office after 1 Jan 1970 are included. Iain Macleod and Sajid Javid are excluded on the basis that neither presented a budget during their terms as chancellor. Data for Harold Wilson refers to his second term in office only. Figures exclude spending impacts of tax measures (for example through adjustments to Scotland’s block grant).
Sources: Authors’ calculations using policy costings from OBR Policy measures database (Dec 2021), historical GDP forecasts from OBR Historical official forecasts database (Oct 2021) and outturn nominal GDP from OBR Public finances databank (Feb 2022).
Figure 3. UK Tax as a share of GDP, 1970-71 to 2026-27
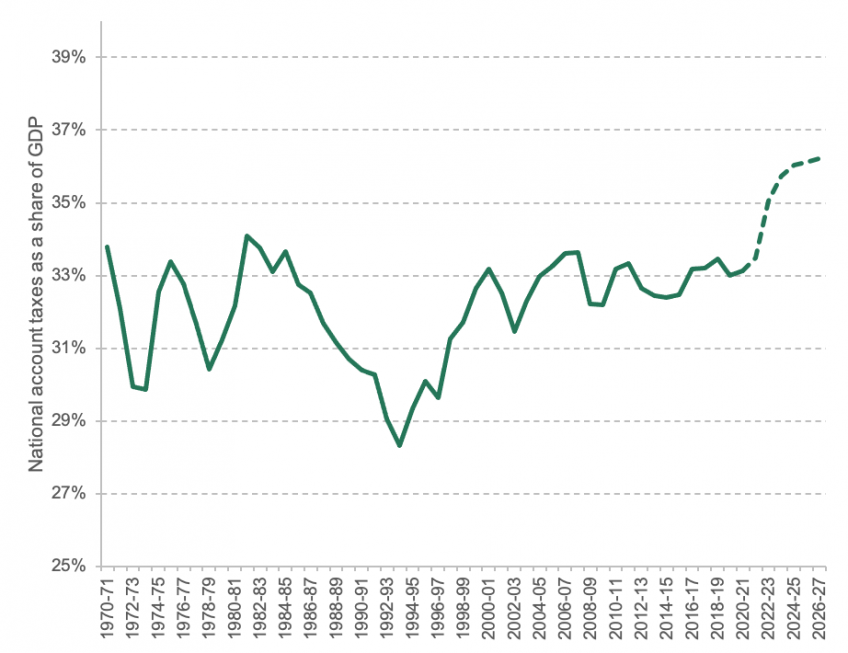
Notes: Chart shows total national account taxes as a share of nominal GDP by financial year. Dashed line indicates forecast.
Source: Authors’ calculations using OBR Public finances databank (Feb 2022).
Tax rises have become the new normal thanks to long term pressures
While the scale of the tax rises announced by the current government is historically unusual, the direction of travel is not. As Figure 2 makes clear, tax-raising governments have, over the last 30 years, become the norm.
Tax rises since 2010 have in part been a response to a weakening of the public finances (in particular an increase in the structural deficit), caused initially by the Financial Crisis and more recently by the COVID-19 pandemic. Such pressures will likely be compounded by surging energy prices and the conflict in Ukraine. But governments have also faced an ageing population that demands both more, and more expensive, health and social care. Health spending has been increasing as a share of both national income and total spending for over 70 years. To a large extent, this has been achieved by steadily cutting the amount spent on defence, but defence spending has more or less flat-lined since the mid-2000s. More recently, demands for higher spending have instead been met through higher taxes.
If the Chancellor’s plans remain unchanged, next month will mark the beginning of a steep ascent in the path of UK taxation. It will come hand in hand with a spike in inflation, only fuelled further by the conflict in Ukraine. Not for nothing did T.S. Eliot call April the cruellest month.
Looking further ahead, whether this government cuts taxes in the short run, or finds a way to cut some taxes before the next election, the longer-term direction of travel is clear. This government will not be the last to raise taxes in face of the inexorable spending pressures of an ageing population.
Authors

Helen Miller
Helen is Deputy Director of the IFS and Head of the Tax sector.

Ben Zaranko
Ben is a Senior Research Economist and an editor of the IFS Green Budget. His work focuses on the health and social care system and UK fiscal policy.

Isaac Delestre
Isaac is a Research Economist in the Taxation sector, focusing on the taxation of high-income individuals and closely-held corporate entities.
More from IFS
Understand this issue


Policy analysis


Academic research


