
Paul Johnson, Director of the IFS, said:
‘Jeremy Hunt’s first fiscal event as Chancellor was a sombre affair. Surging global energy prices have made the UK a poorer country. The result is an OBR forecast that the next two years will see the biggest fall in household incomes in generations.
The swing over a couple of months from Kwasi Kwarteng’s fiscal loosening to a big fiscal tightening is a belated recognition of some harsh fiscal realities. The sharp and sustained increase in how much we now expect to spend on debt interest, in particular, has forced difficult decisions elsewhere. At around £100 billion a year by the end of the forecast period, spending on debt interest will be higher than spending on any single public service bar the NHS.
The Chancellor has felt obliged to relax his fiscal mandate. He is no longer looking to balance the current budget at all, and has pushed out to five years the point at which he says he wants debt to be falling as a fraction of national income. Even so, he has had to announce a package of tax rises and spending cuts amounting to around £50 billion (about 2% of GDP) to meet his new mandate. And even with that, we’re still set to be borrowing 2.4% of GDP, or £69 billion, at the end of the forecast. A return to Osborne-era targets of an overall budget surplus, this is not.
The fiscal tightening is heavily back-loaded, with the vast bulk spending cuts in particular pencilled in for after April 2025. Given the profound uncertainty around the outlook, and the potential economic and social costs of an unnecessarily large up-front fiscal tightening, this is probably the right choice, on balance. But delaying all of the difficult decisions until after the next general election does cast doubt on the credibility of these plans. The tight spending plans post-2025, in particular, may stretch credulity.
The Chancellor will be hoping that his clear commitment to fiscal responsibility and the independence of the Bank of England, his full involvement of the Office for Budget Responsibility, and his less pugilistic approach to economic policy-making will be enough to restore the UK’s tattered international reputation. Let’s hope so.’
Public finances
As expected, the new Chancellor had to contend with a much worse economic and fiscal outlook than forecast back in March. For 2025-26, weak growth and high inflation led to receipts being revised down by £25 billion and spending on benefits and state pensions being revised up by £14 billion. Even more strikingly, the upwards revision to the Office for Budget Responsibility’s assumed parth for interest rates led to forecast spending on debt interest in that year being doubled from £47 billion to £95 billion. On top of this, policy announcements since March - in particular the decision not to introduce the health and social care levy - added around another £16 billion to borrowing in that year. Overall, before incorporating the measures from today’s Autumn Statement, the increase in borrowing amounted to around £90 billion in 2026-27. A lot has certainly changed since March.
So how did the new Chancellor respond? His response, perhaps sensibly, was largely one of wait and see. The net effect of measures announced in the Autumn Statement is to reduce borrowing in 2024-25 by just £11 billion. So not much new fiscal tightening in this parliament. After that, tax rises and, in particular, reductions in the numbers pencilled in for public services build up. But even in 2026-27 the total impact of new Autumn Statement measures is to reduce borrowing by ‘only’ £42 billion. This still leaves borrowing in that year being forecast to be £80 billion, compared to the £32 billion forecast in March.
The size of the fiscal tightening increases further in 2027-28, with the overall impact of new measures reaching £54 billion, driven by the squeeze on public service spending growing over the period from April 2025. But this still leaves borrowing at £69 billion in 2027-28. This is sufficient for the government to be on course for underlying debt to be falling as a share of national income. But only just. It now has headroom of just £9 billion compared to the £34 billion it had back in March and this is despite the target year for debt to be falling being pushed back two years. And even then the Government is on course to be still running a current budget deficit, contrary to the commitment made alongside its 2019 general election manifesto.
As ever, the forecasts are uncertain. The government’s finances could end up much healthier than expected. But if the outlook deteriorates further then Jeremy Hunt really has not left himself with much room to manoeuvre.
Living standards
Living standards growth since 2008 has been extremely weak by historical standards. Unsurprisingly given the cost of living crisis, today’s Office for Budget Responsibility forecast suggests that this is going from bad to worse. This year we are set to see the largest fall in real household disposable income per head (4.3%) since the late 1940s; next year, we are set to see the second-largest fall (2.8%). Modest growth is expected to return after that, but even by 2027-28 we are not expected to have had a single year of growth higher than the pre-2008 average since 2015-16. Average household income per head is due to be the same in 2027-28 as it was in 2018-19, and 31% below where it would have been if the pre-2008 trend had continued.
Year-on-year growth in real household disposable income over time
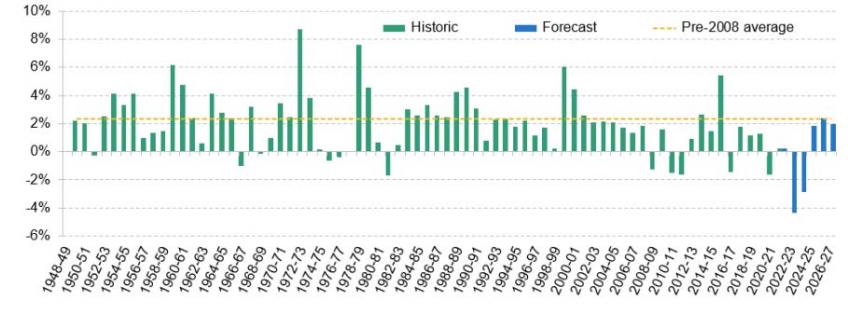
Source: IFS calculations based on ONS UK Economic Accounts (historical RHDI and population statistics), OBR EFO November 2022 (forecast per-capita RHDI).
Personal taxes
The government is leaning about as heavily as it could on freezing tax thresholds to raise revenue.
All the main income tax and employee National Insurance thresholds were already set to be frozen between now and April 2026, and the Chancellor’s Statement extended this by a further two years to April 2028. Further freezes to inheritance tax and VAT registration thresholds have also been added.
The Statement also extended the freeze to the employer NICs threshold. While in the immediate term this will have relatively little impact on employees, in time it will affect them similarly to an increase in employee NICs, since taxing employers on the salaries they pay will reduce the salaries they are willing to pay.
Freezing the employer NICs threshold means that the government has now announced multi-year freezes to every major income tax or National Insurance threshold that was not already frozen by default.
As ever, using freezes to raise revenue can be politically easier than other options and it does have the advantage of avoiding sharp overnight reductions in income, but it also comes with significant downsides, especially when implemented over several years. The real-terms impacts are highly uncertain because they depend on unknown future rates of inflation. The past few months illustrate this starkly. Inflation expectations have fallen, meaning that the freezes already announced are now expected to raise less than previously thought.
Nonetheless, together the freezes to income tax and NICs thresholds from April onwards will raise around £30 billion per year when finished (excluding freezes to thresholds that were already frozen by default).
The freezes to income tax thresholds also mean that more people will be brought into tax or see their marginal tax rate increase. By 2027-28 the total number of income taxpayers is set to rise from 34 million to 35.6 million (63% and 66% of the adult population respectively). The number of higher- or additional-rate taxpayers is set to rise from 6.1 million to 7.8 million (11% and 15% of the adult population respectively). As can be seen in the figure below, this represents the biggest proportion of adults paying higher-rate tax since the beginning of the individual income tax system in 1990-91.
Proportion of adults paying higher-rate income tax
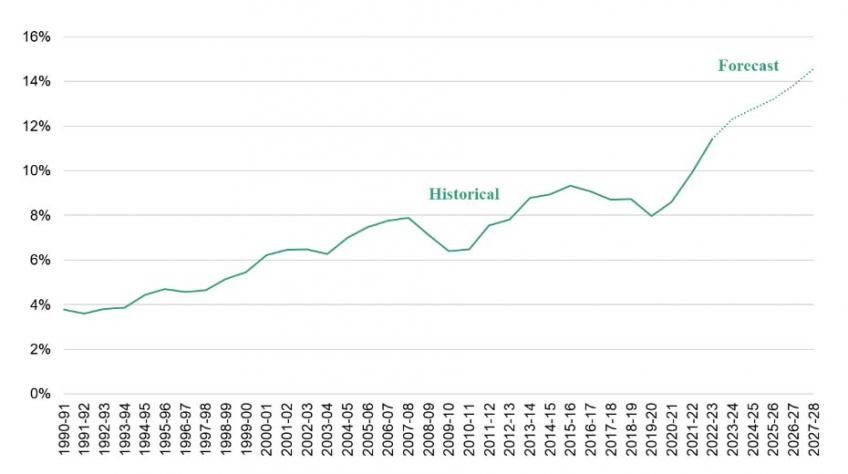
Source: Authors’ calculations using HMRC, Personal Income Tax Statistics, Family Resources Survey 2019-20 and TAXBEN, the IFS tax and benefit microsimulation model.
The Chancellor also announced that the additional-rate threshold - at which 45% income tax becomes due - will be lowered from £150,000 to £125,140 (the point at which a taxpayer loses their personal allowance) from April 2023. This will increase the number of additional-rate taxpayers by about 350,000, bringing the total to approximately 1 million - up from 236,000 when the additional rate was first introduced in 2010-11.
The chart below summarises the combined impact, in 2027-28, of all the income tax and NICs measures implemented since 2021-22. Anyone with a taxable income of about £9,000 or more is set to see their take-home pay fall because of these changes, with most higher-rate taxpayers seeing a fall of £1,700 per year. Losses rise to £1,815 per year for those on £150,000 or more, due to the reduction in the additional-rate threshold.
Impact of income tax and NICs changes introduced since 2021-22 on take-home pay in 2027-28
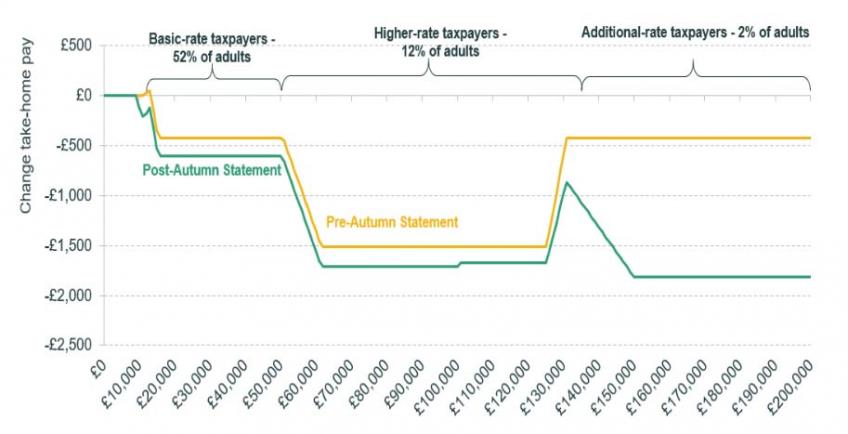
Note: In 2027-28 prices; expected number of taxpayers in 2027-28 shown. The change in take-home pay includes increases in income tax and employee NICs, and assumes the increase in employer NICs is fully passed on to employees.
Public spending
The Chancellor found some additional cash for the NHS and schools over the next two years to ease the inflation squeeze those priority areas are facing. This was funded in large part by recycling £5 billion previously earmarked for increasing overseas aid spending to 0.7% of national income (instead, it will remain at 0.5%).
Beyond the end of the spending review period - which coincides with the likely date of the next election - he cut back plans for public service spending. Departments’ day-to-day budgets will still grow, on average, but less quickly than previously planned. That decision alone accounts for about 40% (£21.5 billion) of the fiscal tightening announced in the Autumn Statement for 2027-28. The Chancellor also pared back plans for capital spending after 2025 (announcing a cash-terms freeze, which equates to real-terms cuts). That decision represents a further £14.8 billion tightening, relative to previous plans.
This raises three key questions.
First, can cash spending plans for the next two years really be stuck to, in the face of higher inflation? Pressure for higher pay awards, in particular, are likely to put pressure on departmental budgets.
Second, will the plans pencilled in for the years after 2025 really be implemented? Since 2015, these provisional spending totals have, in the event, been revised upwards by an average of 3.7%. Were that to be repeated, that would suggest an extra £18 billion of spending in 2027-28.
Third, if the post-2025 plans are implemented, where will the cuts fall? The Chancellor has pencilled in average real-terms growth of 1% per year for departments’ day-to-day budgets. But if the NHS budget grows at anything like its historical average, and the defence and overseas aid budgets grow in line with the economy (to maintain the 2% and 0.5% of GDP commitments, respectively) then everything else could be facing cuts. For areas like local government, prisons, the police, HMRC and the courts system, that could spell a very difficult few years indeed.
Energy Price Guarantee
The Chancellor has been helped by falling wholesale energy prices, which have reduced the cost of energy support measures for households and businesses. The energy price guarantee (EPG) for households announced on 8 September was set to cost £31 billion up to the end of March 2023, but is now expected to cost only £25 billion for that period. Chancellor Hunt had already announced that the EPG would not continue to provide support at the current level beyond that point; today he announced that a less generous EPG will continue for a further 12 months (until end of March 2024), capping the typical yearly energy bill at £3,000 rather than the current £2,500 from April 2023 (alongside providing additional cost of living support payments to households, discussed above). In total, the EPG is now expected to cost £38 billion over 18 months, whereas keeping it at £2,500 for 2 years as originally proposed by Kwasi Kwarteng would now be expected to cost £55 billion.
The figure below shows how much the EPG is expected to save different households in 2023-24. The Chancellor stated there would be an average saving of around £500 per household - though this is a mean figure, and for a household with median energy use we would expect the saving to be roughly half of that (since the mean is skewed by the highest energy users). For households in the bottom tenth of the income distribution the savings amount to 1.9% of their total expenditure on average, compared to 0.7% for the highest-income decile.
Savings from Energy Price Guarantee, 2023-2024
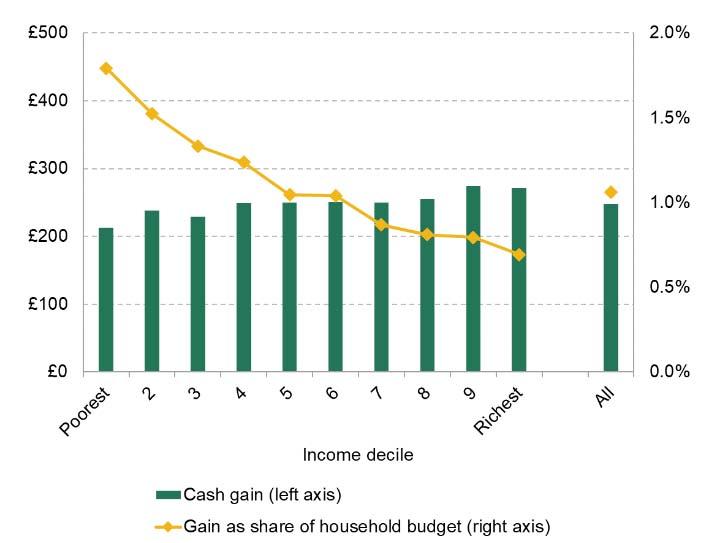
Source: Authors’ calculations using price cap forecasts from Cornwall Insights and energy spending data from the 2019 Living Costs and Food Survey. Savings are for the median household within each income group. We use the same Q4 2023 forecast for the energy price cap for Q1 2024 (for which forecasts are not yet available).
The energy bill relief scheme for businesses only lasts until April 2023, with details of what will be available after that date expected to be announced by the end of this year.
Cost of living grants
The Chancellor announced further ‘one-off’ grants for households in 2023-24, targeted at households on means-tested or disability benefits and pensioners. Unlike the 2022-23 vintage, there will be no such support this time for those not receiving a benefit or state pension. With £900 for those on means-tested benefits, £300 for pensioners and £150 for those on disability benefits (none of which are mutually exclusive), these grants will - alongside the tax rises - mean that the package of measures announced today has a highly progressive effect in 2023-24.
However, one must remember the backdrop for this rather ad hoc form of additional support for benefit recipients: the actual rates of ‘ordinary’ benefits (i.e. excluding the one-off grants) will, despite the 10.1% increase confirmed for April 2023, remain lower in real terms than prior to the current spike in inflation until at least April 2024. The inadequacies in our method of uprating benefits in line with the cost of living - done once per year, and using out-of-date inflation measures - are directly related to the choice to provide these additional, temporary grants. And the grants are not a genuine substitute for ordinary benefits actually keeping up with inflation. Their flat-rate nature does not account for variation in circumstances, such as the number of children people have, and there is a cliff-edge in support for low-earning working households at the point when the last £1 of Universal Credit is withdrawn and they lose their £900 grant as well.
Minimum wage
The National Living Wage for employees aged 23 and over will rise from £9.50 to £10.42 in April 2023. This 9.7% rise is slightly below inflation, but much larger than the expected 5.5% increase in average wages over the same period. As a result, the ambition for the NLW to reach two thirds of median wages will in fact be realised one year early, in April 2023. This represents a large and rapid change in the lowest wages - the minimum wage was 47% of median wages when introduced in 1999, and 59% of median wages in 2016. The particularly large uplifts we’ve seen since 2016 have substantially boosted wages for low-paid workers (including many workers paid a little above the legal minimum) with, as yet, no evidence of significant effects on employment.
Real minimum wage and median wage over time, 2023 Q2 prices
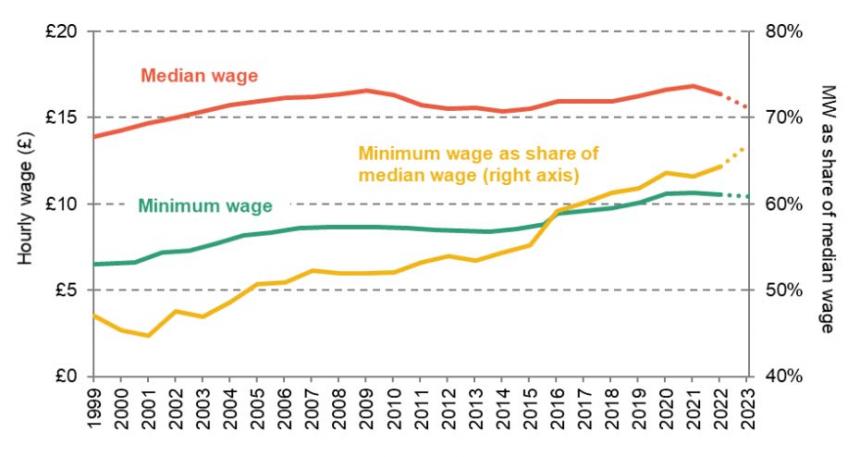
Note: Assumes change in median wage from 2022 Q2 to 2023 Q2 is the same as for the mean wage.
School spending
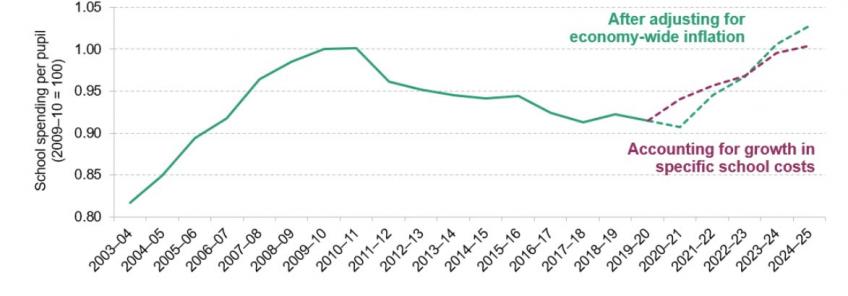
The Chancellor announced an extra £2.3 billion in school funding in England for 2023-24 and 2024-25. This comprises an extra £2 billion compared with prior plans and £0.3 billion that no longer needs to be spent on the Health and Social Care Levy. This represents a 4% increase in school funding for 2023-24 and 2024-25.
This will allow school spending to return to at least 2010 levels in real-terms. Based on economy-wide inflation captured by the GDP deflator, spending per pupil in 2024-25 will be about 3% above 2010 levels. If we adjust for an estimated index of school-specific costs, spending per pupil will return almost exactly back to 2010 levels. This means that school funding is now forecast to exceed growth in school costs, such as growth in teacher and support staff pay levels.
By contrast, other stages of education - like early years and further education - did not receive any uplift and so will be facing a significant squeeze from higher-than-expected inflation. Despite making much of the Education Secretary’s background in vocational education, the Chancellor has done nothing in this statement to reverse the long-standing squeeze on resources for further and adult education.
Real-terms trends in school spending per pupil, based on economy-wide inflation and specific school costs
Response on Twitter
Authors

Stuart Adam
Stuart is a Senior Economist working in the Tax sector, and focuses on analysing the design of the tax and benefit system.


Heidi Karjalainen
Heidi is a Senior Research Economist in the Retirement, Saving & Ageing sector. Her current research is on pensions and saving for retirement.

Peter Levell
Peter joined in 2009. He has published several papers on the microeconomics of household spending and labour supply decisions over the life-cycle.

Isabel Stockton
Isabel works in the Healthcare sector, and on the public finances. Their research focuses on retaining and developing the NHS workforce.

Tom Waters
Tom is an Associate Director at the IFS and Head of the Income, Work and Welfare sector.

Tom Wernham
Tom's main research areas are living standards and poverty, the benefits system, and its interactions with the labour market.

Xiaowei Xu
Xiaowei joined the IFS in 2018 and works in the Income, Work and Welfare sector.

More from IFS
Understand this issue


Policy analysis


Academic research


