
Downloads
Read the full report as a PDF here
PDF | 885.13 KB
Executive summary
In March, the government released a Green Paper outlining a series of far-reaching reforms to the UK benefit system and particularly to working-age health-related benefits. The package as a whole is intended to reweight the system away from support for those considered to have less severe disabilities and towards people who are out of work for other reasons. In this report, we consider what effects the proposed reforms might have. We study how they affect claimants’ incomes; what effect they have on the protection that the benefit system provides against job loss and disability onset; and, with a view to the policy questions the government faces around the flow onto and off health-related benefits, the persistence of ill health. We address the implications for the benefit system.
Some of the key proposed reforms include:
- Tighter eligibility conditions for the daily living component of personal independence payment (PIP), the working-age benefit for those whose health condition increases their living costs. Most of those who lose eligibility because of this reform would lose £3,850 per year.
- Scrapping the work capability assessment, which currently determines eligibility for the universal credit health element (UCHE) – the additional element of universal credit paid to those who cannot work due to ill health or disability. Instead, the government proposes allocating the UCHE to universal credit claimants who also receive the daily living component of PIP.
- A reduction in the value of UCHE. The payment will be frozen for four years (implying a real-terms cut from £5,080 to £4,620 per year) for existing claimants and reduced to £2,370 per year in real terms for new claimants.
- At the same time, the government is planning an additional premium for new UCHE recipients with the most severe disabilities, providing extra support for claimants who otherwise would get the reduced £2,370 rate. In the short run, eligibility for this premium will be tied to being assessed – in the work capability assessment – as having a severe limitation that is expected to be lifelong. The government has yet to announce how eligibility will be determined once the work capability assessment is scrapped.
- The government is consulting on increasing the generosity of the time-limited support available for those who have just lost their jobs, branded as a new ‘unemployment insurance’ benefit. It would not be means-tested and anyone who is unemployed and has sufficient National Insurance contributions could claim it. It would provide the equivalent of £7,330 per year for a time-limited period (the government has suggested 6–12 months). This benefit would operate in a similar manner to the current contributory jobseeker’s allowance but with a higher award rate.
- The government is consulting on removing eligibility to UCHE for 16- to 21-year-olds.
- The standard allowance paid to all universal credit claimants will increase by 4.8% in real terms by 2029–30. For a single adult over the age of 25, this increases their UC award by £230 per year.
By 2029–30, there will be an extra £1 billion allocated to employment support programmes to help those in receipt of benefits with health conditions find work.
Both because of data limitations and because we do not have detail on how the policies will interact with Scottish devolved disability benefits, our calculations are for England and Wales only.
Key findings
1. The impact of the cuts is mostly felt by new claimants and by existing claimants when they have their next health reassessment. No individuals will immediately experience a cash reduction in their benefits as a result of these reforms. By 2029–30, the tighter PIP assessment will cause 800,000 claimants to receive less in PIP than they would receive without reform. Half of those affected will be existing claimants who will lose some or all of their PIP when reassessed and half will be new PIP applicants who receive a lower amount than they would without the reforms. Most of the 800,000 affected claimants will lose £3,850 in PIP a year. In 2029–30, a quarter of UCHE claimants will be new claimants and so receive the new lower rate, which is £2,700 lower than the current UCHE rate in real terms. The other three-quarters of UCHE claimants will have had their UCHE frozen – a £450 real-terms cut to their entitlement. The increase in the standard allowance of universal credit (UC) will be fully in place, benefiting 6.9 million households claiming UC by around £230 a year. In 2029–30, these three reforms (the only ones with enough detail to cost for a specific year) are in total set to save the government £4.6 billion – a £5.6 billion reduction in health-related benefit spending offset by a £1.0 billion increase in other benefit spending.
2. Official forecasts suggest that these reforms will slow the growth in health-related benefit claimant numbers and spending but both will still be higher in 2029–30 than they are now. The reforms come against a backdrop of working-age health-related benefit spending rising sharply from £36 billion to £52 billion between 2019–20 and 2024–25 (in today’s prices). Without reform, spending is expected to grow to £66 billion by 2029–30. These reforms reduce spending on health-related benefits in 2029–30 by £6 billion, leaving it at 61 billion in that year – still £8 billion higher than it was in 2024–25. Official forecasts also suggest the number of disability benefit claimants will grow from 3.1 million in 2024–25 to 3.9 million in 2029–30, despite tightening eligibility requirements. Naturally, forecasts are uncertain and the numbers could turn out higher or lower than this.
3. However, the long-run legacy of these reforms is far greater. The reform package will still be being rolled out well into the 2030s. Based on 2029–30 claimant numbers, we expect the three main reforms could save £10 billion per year when fully rolled out. Adding in the removal of UCHE for under-22s, the proposed additional premium for those with the most severe disabilities and the scrapping of the work capability assessment brings the savings to as much as £11 billion per year, equivalent to 17% of pre-reform expected health-related working-age benefit expenditure in 2029–30. If the number of applicants for health-related benefits continues to grow past 2029–30, both spending on health-related benefits and the savings from these reforms could be even bigger than these figures.
4. These savings – and again, this is after the reforms are fully rolled out – come from 3.2 million claimants of health-related benefits losing an average of £4,000 per year and 5 million individuals, largely without an assessed disability, gaining £410 per year on average. For some, the losses will be much greater: perhaps as many as half a million will see their incomes fall by more than £8,000.
5. One consequence of these reforms is to make the PIP assessment especially important for determining health-related benefit support. Anyone claiming UC who gets just enough points to qualify for PIP will be able to get UCHE too, together worth £6,230 per year – while someone who just misses out on PIP will get no health-related benefits. The difference could be as small as whether they are unable to wash both their upper and lower body, or just their lower body. This creates a big incentive to qualify for PIP, and claimants are likely to respond to this by making more effort at the assessment and appealing their award if they fail initially.
6. The reforms, together with the new unemployment insurance, shift the kind of protection that the welfare system provides against unexpected shocks. On average, at the moment, a worker who has been employed for the past two years who loses their job (but with no change in their health) sees an immediate drop in family income of 48%. Under the reformed system, that figure will be 43%, primarily because of the new unemployment insurance. But the average immediate drop following a worker developing a health condition and losing their job will rise, from 23% to 29%. This shift also means that work incentives for those not on health-related benefits will be weaker, at least before they hit the unemployment insurance time limit, while those on health-related benefits should on average face stronger incentives to work.
7. Health problems start several years before a benefit claim. For example, two years before they start to receive health-related benefits, 64% of future claimants already report having a long-standing health problem – double the rate for the rest of the population. This suggests there may be scope for stemming the inflow to these benefits through employer support, or DWP’s engagement with benefit claimants who are not receiving specific support for a health condition.
8. Health problems for those on health-related benefits are remarkably persistent after the claim has begun. Even five years after the start of a claim, the share of individuals reporting a long-standing health condition has only declined by 5 percentage points (from 84% to 79%). This raises challenges for getting such individuals back into work.
1. Introduction
Health-related benefit payments are a large and growing part of the UK’s working-age welfare system (see Box 1 for a brief overview). Spending (in today’s prices) on benefits targeted at working-age adults and children with health conditions has grown from £38 billion in 2019–20 to £57 billion in 2024–25. Over this same period, spending on the rest of the benefit system for working age adults and children remained broadly unchanged at £84 billion, meaning that the health-related part now makes up 40% of all welfare spending for working-age adults and children – up from 31% in 2019–20. One in ten 16- to 64-year-olds in England and Wales now receive a health-related benefit. The Office for Budget Responsibility (2025) forecasts spending to grow by a further £10 billion (or 17%) by 2029–30 in real terms.1
The government has responded to these trends with a broad set of proposed reforms laid out in the ‘Pathways to Work’ Green Paper (Department for Work and Pensions, 2025b), which aim to reduce projected benefit spending and increase employment. The government hopes to achieve these aims through a combination of significant cuts to health-related benefits, a smaller increase in the generosity of universal credit and increased spending on proactive employment support programmes. It is also consulting on an increase in time-limited unemployment support, branded as unemployment insurance. Finally, the government is considering a range of options that affect the flow into health-related benefits – such as increasing the demands placed upon employers to support employees with health problems – and the flow out of health-related benefits, such as the frequency and nature of health assessments.
The report is structured as follows. We begin in Section 2 by describing the reforms outlined in the Green Paper. In Section 3, we study how the reforms affect the incomes of health-related benefit claimants. In Section 4, we estimate the impact of the reforms on the protection that the benefit system offers against job loss and the onset of health problems. In Section 5, we examine the onset and persistence of claimants’ health problems, which determine where in the process the government can most effectively intervene to either stem the inflow to health-related benefits or speed the outflow from them. Section 6 concludes.
Box 1. The working-age health-related benefit system
Health-related benefits are often grouped into two categories: incapacity benefits and disability benefits. Incapacity benefits supplement incomes for people whose health is judged to limit their ability to work. They are mostly means tested (only available to adults in low-income families). Claimants of universal credit (UC) – the UK’s main means-tested benefit – can receive additional support if they are assessed to have ‘limited capability for work-related activity’. If so, they receive the UC health element (UCHE) – an additional £5,080 a year on top of the rest of their UC award – and are exempted from requirements to look for a job. New claimants who are assessed as having a ‘limited capability for work’ – indicating a less severe incapacity – do not receive additional support but are exempted from some job-search requirements.
Disability benefits are intended to help cover additional living costs faced by people with disabilities. Personal independence payment (PIP) is the main disability benefit for working-age adults in England and Wales. It is not means tested, nor is it related to capability for work; instead, eligibility and the level of support depend on an assessment of the applicant’s inability to do a range of activities.a There are two elements to a PIP award – mobility and daily living – which are assessed on two different sets of activities. Claimants can receive either element separately or both elements together. For each element, a claimant can receive either the standard level or a higher enhanced level, based on their assessed level of disability. Depending on which elements they receive, PIP awards range from £1,520 to £9,770 a year.
2. What are the reforms?
The package of reforms contains a substantial number of measures. Here we summarise some of the key ones that directly change benefit amounts or eligibility.2
- A reduction in the universal credit health element (UCHE). Claimants of universal credit (UC), the UK’s main working-age means-tested benefit, who are assessed as having a health condition that significantly limits their capability for work are eligible for an additional element in their UC, worth £5,080 per year. The government plans to freeze that level for four years (a 9% real-terms cut) for existing claimants, while new claimants will see their UCHE reduced to £2,370 per year (which will also be frozen for the next four years).
- At the same time, the government is considering an additional premium for new UCHE recipients with the most severe disabilities, such that they get the same amount as existing claimants (currently worth £5,080 per year) rather than the reduced £2,370 rate. In the short run, this premium will be available to those who, at a work capability assessment, are determined to have a ‘severe condition’ – which includes having a limitation that constantly affects them and will do so for the rest of their life. The government estimates that 200,000 people are in that category. Recipients of this premium will not be reassessed. But – as discussed below – in the long run the government is getting rid of the work capability assessment. It has not yet set out how eligibility for this premium will be established in a world without the work capability assessment.
- Tighter eligibility conditions for the daily living component of personal independence payment (PIP), the working-age benefit for those whose health condition increases their living costs. PIP entitlement is based on an assessment of an applicant’s inability to do a range of activities, with the severity of the inability determining how many points are scored for each activity. Currently, to get the ‘standard daily living’ component of PIP (worth £3,850 per year), an applicant must score eight points on this assessment, and to get the ‘enhanced daily living’ component (£5,760), twelve points. The proposed reform is to require applicants to also score at least four points on at least one activity. At their last assessment, 46% of recipients of the daily living component would not have met the new criteria (Department for Work and Pensions, 2025a), although the changes will only apply to new claims and at reassessment. Most who lose eligibility would otherwise receive the standard daily living component and so will lose £3,850 per year.
- Scrapping the work capability assessment. Eligibility for UCHE is currently based upon being assessed as having a ‘limited capability for work-related activity’ at a work capability assessment. Instead, the government proposes allocating the UCHE to UC claimants who also receive the daily living component of PIP. Some details on this reform are yet to be announced, including what will happen to the existing stock of UCHE claimants.3, 4
- The government is consulting on an increase in time-limited unemployment support, branded as unemployment insurance. Currently, the UK has two main contributory working-age benefits – ‘new-style jobseeker’s allowance’ (for unemployed claimants, typically paid £92.05 per week) and ‘new-style employment and support allowance’ (for claimants unable to work, typically paid £140.55 per week). These are not means tested,5 and eligibility is based upon having paid National Insurance contributions in the past two to three years. In practice, these benefits offer little additional financial support to those with low enough incomes to qualify for UC: UC generally provides at least as high a level of entitlement, and any contributory benefit received is offset pound-for-pound by a reduction in UC. The proposed unemployment insurance would replace the two existing contributory benefits, be time limited (for an as-yet undecided length, though the government has suggested 6–12 months) and pay £140.55 per week – the same as new-style employment and support allowance. This would be equivalent to £7,330 per year. Unlike new-style employment and support allowance, it would not involve an assessment of capability to work. This represents a significant increase in generosity (for the weeks that it is payable) to those receiving new-style job seeker’s allowance. It is also an increase in support for UC claimants who are eligible for the unemployment insurance and get less than £140.55 per week in UC. Claimants to contributory employment and support allowance would mostly see no change in their award amounts, but their awards would become time limited.
- The government is consulting on removing eligibility to UCHE for 16- to 21-year-olds. There are currently 72,000 individuals in this age group in receipt of UCHE.
- The standard allowance that all UC claimants are eligible for will increase by 4.8% in real terms by 2029–30. For a single adult over the age of 25, this increases their UC award by £230 per year. The Office for Budget Responsibility (OBR) expects 6.9 million households to benefit from this change in 2029–30.
The government has also announced or is consulting on a number of other reforms:
- Employment support: The government is increasing employment support and expectations to engage with that support for out-of-work benefit claimants with a disability. By 2029–30, this will include an extra £1 billion in funding. It is worth noting that this extra support mostly comes after the cuts have begun.
- Support in the workplace: The government is consulting on possible reforms to ‘Access to Work’, a scheme that provides support (including financial support) to help disabled people in the workplace (e.g. grants to pay for specialist equipment). It is also considering the enforcement of and guidance on the ‘reasonable adjustments’ employers are required to make for employees with disabilities.
- Health reassessments: The government is planning to reduce the frequency of reassessments for those with very severe conditions that are unlikely to improve, and increase (from close to zero) the number of reassessments that UCHE claimants face. In an effort to reduce concerns by claimants that taking on work could lead to a health reassessment, the government is seeking to legislate to confirm that taking on more work cannot trigger a reassessment.
A common thread running through these reforms is the strengthening of the incentive for those on health-related benefits to get into work – by reducing the level of support, tightening eligibility, and weakening the link between work and award level. At the same time, the reforms increase support for those without an assessed disability, through a more generous UC system and the increased unemployment insurance. The net effect is to weaken the incentive to get onto health-related benefits in the first place.
3. Who is affected, and by how much?
The way in which claimants are set to be affected by these reforms depends in part on which combination of benefits they claim. Figure 1 shows the distribution of benefit claimants across UC (and its health element) and PIP. There is a significant but far from perfect overlap between incapacity and disability benefit claimants. Of the 3.7 million people who receive PIP and/or UCHE, 1.6 million receive both, 1.6 million receive PIP only, and 0.6 million receive UCHE only.6
Figure 1. Number of claimants claiming different combinations of benefits in England and Wales, November 2024
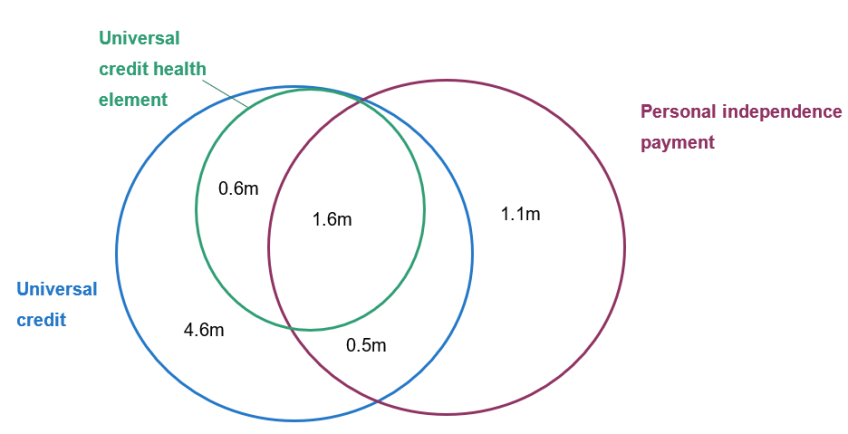
Source: Authors’ calculations using DWP Stat-Xplore data.
Take an individual who, prior to the reform, receives both the UCHE (currently £5,080 a year) and the standard daily living element of PIP (£3,850 a year) and so would be one of the 1.6 million in the green and purple circles in Figure 1. Suppose that, when they go to their next reassessment – under the new tighter PIP eligibility criteria – they lose their PIP allocation.7 Since the government plans to make UCHE dependent on receiving PIP daily living, they would also lose UCHE. Altogether, they would be £8,700 a year worse off due to the reforms.8
Conversely, take someone who currently receives UC and the daily living element of PIP, but not UCHE. Following the reforms, so long as they keep their PIP, then – since UCHE receipt will be tied to getting PIP – this individual will gain UCHE and will gain £2,370 a year (the proposed UCHE amount for new claimants).
What these examples hint at is that the reformed system makes the PIP assessment even more important for determining claimant awards. To make this concrete, suppose a new claimant gets just enough points to qualify for PIP under the new regime, and, because they get UC, they get UCHE too (at the new lower rate). Their total receipt of health-related benefits will be £6,230 per year. Another very similar new claimant applies but, despite getting the same number of total points, does not get the requisite four points in one activity – the difference between a two- and four-point score can be something such as being unable to wash one’s lower body versus being unable to wash one’s lower and upper body. Therefore, they do not get PIP and they do not get UCHE either.
Such arbitrary cut-offs are inevitable in a benefit system, but the reforms sharpen these differences, and will lead to a big incentive to qualify for PIP. Claimants are likely to respond to this incentive by making more effort at the assessment and by appealing their award if they fail initially. The government has announced a review of the PIP assessment, perhaps in recognition of its increased importance. Getting this review right will be vital if these reforms are to successfully meet the government’s objectives.
We now move beyond examples to explore how the proposed health-related benefit reforms would impact incomes across all health-related benefit claimants. Both because of data limitations and because we do not have detail on how the policies will interact with Scottish devolved disability benefits, our calculations are for England and Wales (see discussion in footnote 3). The reforms do not look as if they will result in an immediate cash loss for existing claimants. The PIP tightening only affects existing claimants at their next reassessment (and even if they are disallowed, they will continue to receive payments for a 13-week transition period). The reduction in the rate of UCHE only affects new claimants, with existing claimants seeing the real value of their frozen UCHE slowly eroded by inflation. The government has not stated what will happen to existing claimants of UCHE who are under 22, or who do not get PIP after UCHE entitlement is linked to PIP receipt, but it has indicated that these reforms will not be implemented until 2027–28 or 2028–29 respectively (and even then, it seems likely that existing claimants will have some form of transitional protection).
By 2029–30, we estimate that the reform tightening PIP eligibility will be roughly two-thirds rolled out.9 The Office for Budget Responsibility (2025) estimates that 800,000 fewer people will receive a PIP daily living award in 2029 than would have without the reforms. About half of these people (370,000) will be current claimants who lose their award at reassessment. The other half (430,000) will be new applicants who would have got an award but miss out due to the reforms. About half of the 800,000 affected claimants will still receive some PIP through a mobility award. Despite the PIP eligibility tightening, official forecasts still suggest that the total number of working-age PIP claimants will grow from 3.1 million in 2024–25 to 3.9 million in 2029–30. Forecasts are uncertain and actual claimant numbers might turn out higher or lower, but this is still an indication of the underlying increase in demand for PIP.
The OBR also estimates that 700,000 UCHE claimants (27%) will be on the new lower rate while the other 2.2 million (73%) will have had their UCHE frozen. The UC increase will be fully in place. These three reforms are the only ones for which we have enough detail to cost for a specific year. Taken together, we estimate that in 2029–30 the government will save £4.6 billion from these reforms – a £5.6 billion cut to health-related benefits offset by a £1.0 billion increase in spending on other benefits.10
However, the long-run legacy of these reforms is far greater. We now move on to estimating the effects of the reforms for which we have enough detail to examine – the tightening of PIP, reducing the level of UCHE, introducing an additional premium for new UCHE claimants, increasing UC, scrapping the work capability assessment, and removing UCHE for under-22s – once they have been rolled out fully, which will take many years. We show the effects of the reforms as if the new regime had been applied to the expected 2029–30 caseload of claimants. If the number of benefit claimants continues to grow for other reasons, the actual savings from the reforms could be larger than the figures modelled here.
We exclude the introduction of unemployment insurance as the number of people affected is particularly uncertain given that the length of the time limit has not been specified. If it was six months – the same as new-style jobseeker’s allowance – then the immediate gain would be to the 71,000 existing claimants of that benefit, who would typically gain the equivalent of £2,500 per year (for a total cost of around £175 million per year). That the benefit is more generous might also raise take-up, increasing the cost further. However, it is also worth noting that existing claimants of new-style employment and support allowance – who can claim indefinitely – will lose up to £7,300 per year when that benefit is replaced by the time-limited unemployment insurance.11
Our approach to modelling these reforms is as follows. We begin by taking the existing number of claimants of the various benefits, and scaling these numbers up in line with the OBR’s forecast for the health-related benefit caseload for 2029–30. We then impose the reforms listed above, assuming that nobody changes their behaviour in response. To calculate the impact of the tightening to PIP, we estimate that 52% of the pre-reform 2029–30 PIP daily living caseload would fail to meet the new rules.12 We use the same 52% figure for all groups of PIP claimants, whether they are claiming UC, UCHE or neither. To model the additional UCHE premium, we assume that (before behavioural responses) 10% of UCHE claimants would qualify for it – approximately the share that the government assesses as being eligible under the short-run eligibility criteria (see Section 2 for further discussion).
Given the magnitudes involved, it is likely that these reforms will induce behavioural responses. Although in practice there may be many such responses, we model the three we think likely to be the most significant. The most important behavioural response is likely to be PIP claimants and assessors changing behaviour in response to the new PIP eligibility restrictions, including by appealing decisions if rejected. The Office for Budget Responsibility (2025) assumes that changing claimant and assessor behaviour will roughly halve the number of people who lose out from this change, and we follow this assumption. The second key behavioural response is to the decision to determine UCHE eligibility by the PIP assessment rather than the work capability assessment. The key losers from this reform are people who previously claimed UCHE but not the daily living component of PIP. Following these reforms, these claimants will lose their UCHE, giving them a strong incentive to get the daily living component. We assume 10% of people who lose their UCHE due to this change start to claim PIP in response.13 The third behavioural response is to the availability of the additional UCHE premium. We assume that, after behavioural response, 20% (rather than 10%) of UCHE claimants will qualify. The scale of these behavioural responses is highly uncertain – claimants could turn out to be more or less responsive to changing incentives that they face. These numbers should be seen as illustrative. To give a sense of scale, we show one scenario where there is no behavioural response. We also include a ‘high behavioural response’ scenario where 75% (rather than half) of those who would otherwise lose out from the new PIP eligibility criteria nonetheless qualify; where 20% (rather than 10%) of those who lose out from using the PIP assessment to determine UCHE qualify for PIP; and where 30% (rather than 20%) of UCHE claimants qualify for the additional UCHE premium.
Table 1 summarises the impacts of the reforms. We estimate that in the long run, the reforms would reduce annual benefit spending by £17.5 billion before behavioural responses. Incorporating behavioural responses reduces the saving by £6.8 billion, taking it to £10.7 billion, and in the high behavioural response scenario the saving falls a further £4.3 billion, to £6.4 billion. This highlights how important behavioural responses are to the overall saving.14, 15
Table 1. Summary of long-term impacts of different reform scenarios in England and Wales
| No behavioural response | Behavioural response | High behavioural response |
Number of PIP claimants (million) | 3.5 | 3.9 | 4.2 |
Number of PIP daily living claimants (million) | 1.9 | 3.0 | 3.6 |
Number of UCHE claimants (million) | 1.2 | 1.9 | 2.3 |
Number of additional UCHE premium claimants (million) | 0.1 | 0.4 | 0.7 |
Total change in spending (£ billion per year) | –17.5 | –10.7 | –6.4 |
Number with no change in health-related benefits (million) | 0.8 | 1.2 | 1.4 |
Total increase in spending on winners | 1.4 | 2.0 | 2.5 |
Average gain for winners (£ per year) | 300 | 410 | 490 |
Number of winners (million) | 4.7 | 5.0 | 5.1 |
Total decrease in spending on losers | –19.0 | –12.7 | –8.9 |
Average loss for losers (£ per year) | –5,010 | –3,970 | –3,140 |
Number of losers (million) | 3.8 | 3.2 | 2.9 |
Number of people with losses over £8,000 | 1.0 | 0.5 | 0.2 |
Note: All £ figures are in 2025–26 prices and are based on 2029–30 award amounts. Estimates are based on projected caseload in 2029–30. Policies modelled: increase in UC standard allowance; tying UCHE eligibility to PIP daily living receipt; tightening of PIP eligibility; reducing UCHE value; introducing additional UCHE premium; preventing 16- to 21-year-olds from claiming UCHE. Does not include the impact of introducing unemployment insurance. To model the increase in the UC standard allowance, we assume that each individual gains the average standard allowance increase, taking averages across singles and couples and under- and over-25s (though this makes only a small difference to results). Does not include impacts on Scotland and Northern Ireland. Does not include knock-on impacts on carer’s allowance. Numbers losing over £8,000 per year assume that all recipients of the standard daily living element of PIP are equally likely to lose it and that all recipients of the enhanced daily living element are equally likely to lose it. Only working-age claimants.
Source: Authors’ calculations using DWP Stat-Xplore, DWP Pathways to Work evidence pack, DWP caseload and expenditure tables, and OBR March 2025 Economic and Fiscal Outlook.
The table also shows the number of winners and losers because of the reforms. Again we emphasise that these are long-run consequences, and existing claimants will not be immediately affected; and that behavioural responses are highly uncertain, and so not too much weight should be put on precise numbers. With those caveats in mind, the table shows that the reforms combine small gains for a large number of benefit claimants, with large losses for a smaller number of health-related benefit claimants. Around 5 million claimants will gain on average £410 a year, from the increase in the UC standard allowance and in a small number of cases a new UCHE entitlement. In comparison, the proposed reforms will result in 3.2 million health-related benefit claimants receiving on average £3,970 less per person. So as well as being an overall retrenchment of the benefit system, the reforms also involve large-scale redistribution away from benefit claimants with health conditions towards other benefit claimants. The number of claimants of at least one health-related benefit falls by about 17%. The distribution of losses depends on how likely different kinds of claimants are to lose the daily living element of PIP. As an indicative figure, if the likelihood of losing that element was unrelated to whether one also received UC or UCHE, then we estimate around 500,000 individuals would lose at least £8,000 per year.
We briefly return to the proposed additional premium, to be paid to the most severely disabled new claimants who would otherwise receive the new lower level of UCHE. The government has announced the eligibility criteria that will be in effect while the work capability assessment is still in place (see Section 2 for further discussion) and, based on the existing caseload, it estimates that 200,000 – approximately 10% – of UCHE claimants will qualify.
The government is yet to determine the eligibility criteria for a world without the work capability assessment, and the language of the Green Paper suggests it wants them to be fairly restrictive, with the additional premium going to ‘those with the most severe, life-long health conditions, who have no prospect of improvement and will never be able to work’.
However the government determines eligibility, another important factor is the behavioural response. In the ‘no behavioural response’ scenario above, we assumed that 10% of UCHE claimants end up qualifying; in the ‘behavioural response’ scenario, 20%; and in the ‘high behavioural response’ scenario, 30%. A 10% increase means an extra 190,000 claimants and an extra £440 million in annual expenditure.
The history of similar such reforms shows these sorts of behavioural responses are a real risk and many more people may end up qualifying than intended. For example, when employment and support allowance was introduced in 2008 to replace incapacity benefit, the expectations were that 10–20% of the caseload would be in the more severe ‘support group’; in the end, more than 70% were (Department for Work and Pensions, 2008). One reason to think that, in this case, the number eventually qualifying will be closer to the original intent is the plan to link eligibility to a ‘life-long health condition’ with ‘no prospect of improvement’, meaning the person will ‘never be able to work’. This potentially improves on where the employment and support allowance design went wrong, as it was focused on assessing someone’s health as it stood when they applied, rather than having a forward-looking component – and meaning that those with severe but short-term conditions could be put in the more severe ‘support group’.
Overall, these reforms represent a significant cut to health-related benefits partially offset by a boost to the non-health-related part of the system. The government’s hope is that these reforms will make people less willing to claim health-related benefits and will help support people into work. These are the issues to which we now turn.
4. How will the reforms change insurance against work and health shocks?
In designing the welfare system, the government typically faces a trade-off between insuring people against unexpected ‘shocks’ (such as unemployment or ill health) and avoiding perverse incentives (such as discouraging work). A key measure to summarise the degree of insurance compared with the strength of incentives is the replacement rate – the ratio of a worker’s income when in work to what their income would be if they stopped work. A replacement rate of 100% would indicate that an individual gets the same income out of work as they do in work. As well as benefits, which generally increase following job loss, replacement rates are affected by taxes, which generally decline. They are also affected by partner’s income and unearned income: these are the same in and out of work, and so cushion the income decline resulting from job loss.
In general, replacement rates for a health and work shock will be higher than for a work shock alone, because health-related benefits are more generous than unemployment benefits. However, some of this is compensation for either the cost or well-being impact of ill health. A major part of the rationale for health-related benefits is that their recipients may need more support to afford the same quality of living.
Again we begin with some examples. A single person with no children, working full-time at the National Living Wage,16 receives an annual net income of £18,120. If they lose their job, their income under the current system would fall to £4,560 – a replacement rate of 25%. Assuming they meet the unemployment insurance contribution conditions, under the reformed system their income would (temporarily) fall only to £7,050 – a replacement rate of 39%. Note that those on UC when in work both have higher replacement rates and see a smaller increase in those replacement rates as a result of the reforms. This is because a pound of after-tax earnings lost usually means a 55p increase in UC, and because new-style jobseeker’s allowance and (presumably) unemployment insurance reduce UC entitlement pound-for-pound. If our example worker had two children (and hence was eligible for UC in work), their replacement rate following losing their job would be 54% before the reform and 55% after it.
Returning to the single individual without children and turning to health shocks: if they fell ill so that they could no longer work and at the same time became entitled to PIP17 and UCHE, their income would fall only to £17,730 under the current system – a replacement rate of 98% – but to £15,450 (85%) under the reformed system. Furthermore, there would be an increased chance that our example individual would no longer pass their PIP assessment, losing access to all health-related support. In that case, the reforms could result in their net income falling to £7,050, a replacement rate of 39%.
We now move beyond examples to study the effect of the reforms on replacement rates for the working population as a whole, once the reforms are fully rolled out. Ultimately, our question is ‘For those who are currently in work, how much income protection would they get against losing their job, or losing their job and developing a health problem – and how is that changed by the government’s reforms?’. To answer this, we use IFS’s microsimulation model for taxes and benefits, TAXBEN, together with the Family Resources Survey. For each individual who is observed in paid work in the data, we model two counterfactual scenarios: one in which they lose their job – which we term the ‘work shock’ – and one in which they lose their job and simultaneously begin claiming health-related benefits – which we term the ‘health and work shock’. (The reforms will also affect people who have a health shock but not a work shock, either because they were not in work to begin with or because they are still able to work after falling ill, but we do not model this.) We then take the ratio of their out-of-work income and their in-work income, to produce the replacement rate. We model the long-run effects of PIP eligibility tightening, the reduction in UCHE, removal of UCHE for those aged under 22, scrapping the work capability assessment, the introduction of unemployment insurance, and the increase in the UC standard allowance. We do not model the additional premium for severely disabled UCHE recipients as we assume that the shock to health is not permanent. Note that the replacement rates are calculated on the assumption that those losing their jobs have sufficient National Insurance contributions to be eligible for a contributory benefit18 (new-style jobseeker’s allowance, new-style employment and support allowance or, in the reformed system, unemployment insurance). The replacement rates refer to incomes received immediately following job loss, before the individual reaches the time limit for new-style jobseeker’s allowance or unemployment insurance. If they remain out of work beyond the time limits of these benefits, their replacement rate would drop.19
Figures 2 and 3 show the distribution of replacement rates under the existing and reformed systems, for the ‘work shock’ and the ‘health and work shock’ respectively. Overall, the average replacement rate following a work shock rises from 52% to 57%, while the average replacement rate following a health and work shock falls from 77% to 71%. The levels of insurance provided against these shocks thus become considerably closer, consistent with the government’s desire to ‘rebalance’ the benefit system.
Figure 2. Replacement rates under existing and reformed systems for ‘work shock’
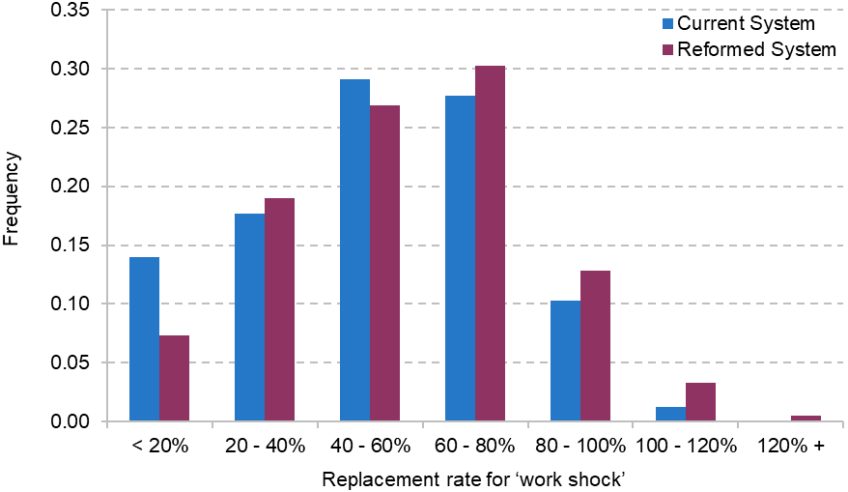
Note: See text and footnote 19 for detail.
Source: Authors’ calculations using TAXBEN, the IFS microsimulation model, and Family Resources Survey, 2022–23.
Figure 3. Replacement rates under existing and reformed systems for ‘health and work shock’
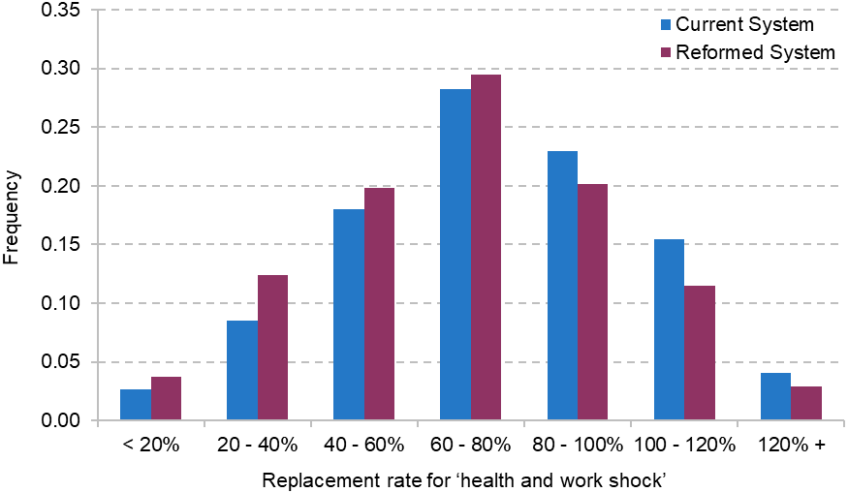
Note: See text and footnote 19 for detail.
Source: Authors’ calculations using TAXBEN, the IFS microsimulation model, and Family Resources Survey, 2022–23.
In the case of the work shock, the increased protection comes, to a considerable degree, from significantly reducing the share of people who have a very low (under 20%) replacement rate, driven by the increased time-limited unemployment support. By contrast, the protection against a health and work shock is weakened across the board: replacement rates in excess of 80% become less common, while all categories of lower protection, including very low replacement rates, are increased. This is driven by lower UCHE values, fewer people qualifying for PIP, and those who do not being unable to receive UCHE. As discussed, we have not modelled the additional UCHE premium for severe disabilities that is yet to be finalised. The decisions the government takes – on the amount of extra support and the eligibility criteria – will affect the protection the system affords against developing health problems.
Effects on work incentives and applications to health-related benefits
The flip side of providing insurance against job loss is its potential impact on work incentives. Employment rates among those on health-related benefits are, unsurprisingly, low: only 7% of UCHE claimants and 17% of PIP claimants are employed (Department for Work and Pensions, 2025a).20
For those not on health-related benefits, the increase in the UC standard allowance makes employment slightly less attractive, especially if they would not get UC if they were in work. Likewise, the increase in unemployment support will probably lower the attractiveness of employment. One important difference from UC is that while the UC expansion increases entitlements for some of those in work as well as out of work, the unemployment insurance scheme only boosts incomes out of work. This could particularly discourage part-time work, though the extent of these effects will depend on the duration of the scheme.
The government hopes that tightening eligibility for health-related benefits will encourage more people to work. This could outweigh the reduction in work incentives caused by more generous unemployment benefits. Whether this will be true depends on two factors:how responsive each group is to work incentives, and how large the group is. In particular, it matters how much the willingness and ability to work of people currently in receipt of health-related benefits respond both to financial incentives and to job-search requirements. Murphy and Thwaites (2025), drawing on existing evidence on the responsiveness of disabled people to financial incentives, suggest that the tightening of PIP eligibility, cut to UCHE, and new employment support programmes might increase employment by 60,000–105,000. Incorporating the scrapping of the work capability assessment and the removal of UCHE for under-22s would increase these numbers further. While employment increases in the low six figures are certainly not insignificant, the numbers are small relative to the 3 million losing out from the reform. The effects would be smaller still after accounting for any reduction in employment caused by the increase in support for the unemployed.
By closing part of the gap between health- and non-health-related benefits, there will also be a reduction in the incentive to claim the former. The extent to which this affects applications will depend on at least two factors. First, the permanence of disability. Since unemployment insurance is set to be time-limited, if people are unable to work again for a long period they may still have a strong incentive to claim health-related benefits, especially when they hit the unemployment insurance time limit. Second, the extent to which people are averse to the work-search requirements that will be included in unemployment insurance. Existing evidence shows that one way people respond to being required to look for a job is by applying for health-related benefits and hence avoiding those requirements (Codreanu and Waters, 2023).
Of course, whether this is a good outcome or not depends on whether the government wants to discourage people who qualify for health-related benefits from applying. If the purpose of these benefits is to support people with health problems, then arguably it is a problem if people with qualifying health problems do not apply.
5. Persistence of health problems, reassessments and the journey to claiming
In the previous section, we considered the effect of the reforms on the (short-run) protection the benefit system provides against health shocks. How important such protection is depends on the persistence of health problems. Moreover, the trade-offs around how to design the system depend in part on how claimants’ circumstances – including their health – evolve over time. A range of policy decisions that the government has announced or is consulting on will depend on these dynamics, including:
- The workplace adjustments employers are required to make to help employees with a health condition: if conditions emerge slowly, and if many new claimants were recently in work, there might be more scope to subsidise or oblige employers to make adjustments that stop the problem getting worse and hence stem the flow into health-related benefits.
- Frequency of reassessment for health-related benefits: the more persistent health problems are, the less frequent reassessments need to be.
- The duration of unemployment insurance: more transitory health problems might be better dealt with via unemployment insurance, whereas long-lasting ones likely need benefits tied to a health assessment. And if new claimants have often been out of work for a long time before developing a health problem, the unemployment insurance will provide little protection.
We now turn to studying the evolution of health for health-related benefit claimants, using data from Understanding Society over the period 2009–19. Our analysis is therefore caveated by the fact that the nature and distribution of health-related benefit claims may have changed since the COVID-19 pandemic.21
Figure 4 shows the evolution of various indicators of health problems for working-age individuals around the time of beginning a health-related benefit claim – from two years prior to the claim to five years after (note that the graph includes individuals after the start of the claim even if they stop claiming health-related benefits). We show three such indicators. First, we use whether an individual reports a long-standing health condition.22 Then, we use ‘SF-12’ scores of mental and physical health. These are each based on 12 questions about the way in which health affects the respondent’s life, such as whether they can climb several flights of stairs, or whether emotional problems have reduced what they have accomplished. The graph shows the proportions of people with SF-12 scores in the bottom quintile of the population, before and after the onset of a health-related benefit claim.
Figure 4. Percentage of working-age individuals reporting health conditions around first health-related benefit claim
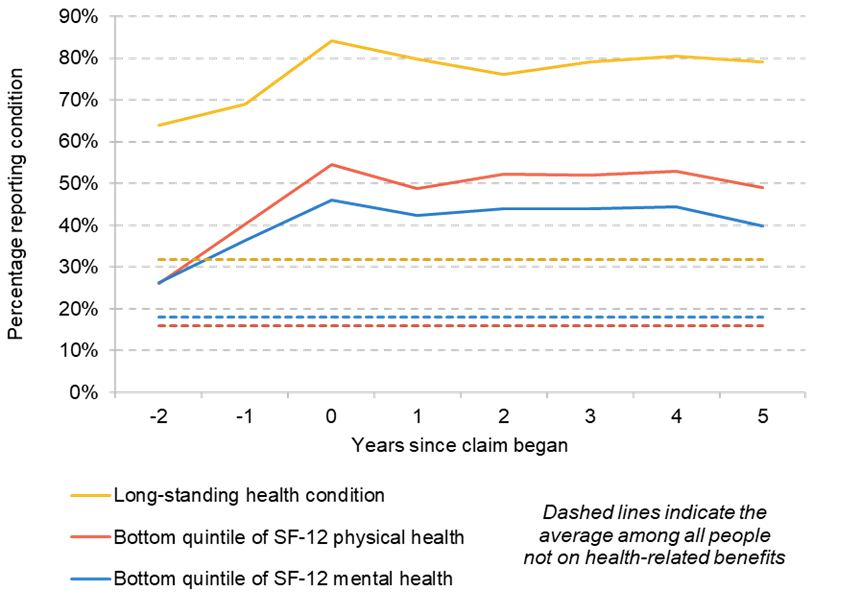
Source: Authors’ calculations using Understanding Society, 2009–19.
There are two things to take from these figures. First, even two years before their claim, people who go on to claim health-related benefits are much more likely to have health conditions than the population who are not on health-related benefits as a whole. For example, 64% of those who go on to claim health-related benefits had a long-standing health condition two years prior to starting that claim – double the average among those not on health-related benefits. Likewise, 26% of those who go on to claim have physical health in the bottom quintile, compared with 16% among the population not on health-related benefits as a whole. Could the government intervene to support people prior to their health getting (even) worse and hence stem the flow into health-related benefits? Administrative data show that 46% of new claimants to UCHE had been in work in the six months prior to their claim beginning, and a further 46% were already claiming a benefit (usually UC without UCHE).23 Taken together, these pieces of evidence suggest that there may be room for such intervention. The government could oblige or subsidise employers to make adjustments for those with health conditions (such as through the Access to Work scheme, reforms to which the government is consulting on). And DWP’s engagements with benefit claimants might offer another avenue to get claimants who have a health problem, but not yet an assessed disability, extra support before their condition worsens and they begin a health-related benefit claim.
The second thing the figures show is that health problems are very persistent for claimants. There is only a very slight decline in the share with health problems five years after the start of a claim (e.g. the share with a long-standing condition falls from 84% to 79%). This may in part be because those with transitory health problems do not claim health-related benefits (and such individuals will receive stronger protection through the increased time-limited unemployment support).24 In fact, we find that the small improvement in health problems that we do see is entirely accounted for by those who stop receiving health-related benefits after three years (see Figure A1 in the appendix) – indicating that the reassessment process may already be filtering out those whose condition is not especially long lasting. This does not necessarily mean that more reassessments will be ineffective – the figures show an average, and some of those who remain on the benefit will have seen an improvement in their health, while others will have seen a worsening. Nonetheless, the fact that, on average, claimants see little improvement does suggest that the frequency of reassessments seen over the 2010s (when the data were taken from) was not leaving a large number of healthy people in receipt of these benefits. Moreover, getting many of these people back into work when (on average) their health has not improved much is obviously going to be challenging. In the appendix, we show that similar patterns are seen for men and women, and for older and younger claimants, and for claimants who at the time of the award were in the bottom quintile of mental or physical health.
6. Conclusion
The way that this package of reforms is designed means that their full effect will not be felt for many years to come. But when that full effect is in place, the legacy of these policies is a huge change to the shape of benefits in the UK. Support for health conditions, which – unlike unemployment support – has gradually increased in real terms over recent decades (Waters, 2025), will fall significantly. Some people who would have received health-related support under the current system will not, and most people who continue to receive some will receive less. These reforms will go at least some way to slowing the rapid increase in spending on health-related benefits since the pandemic. And it is likely that that will increase employment – perhaps in the low six figures.
In contrast, the support for people without health conditions will be increased. The introduction of an unemployment insurance – a significant contributory benefit against the backdrop of our predominantly means-tested system – will represent a meaningful increase in the protection the system provides against job loss. This is bolstered by the increase in the UC standard allowance.
The size and shape of these effects remain subject to a number of policy decisions yet to be taken.
First, the government must decide the level of the new additional UCHE premium, and the eligibility criteria attached. These decisions will have a significant impact on the effect of the reforms on the most severely disabled claimants. While the government’s intention is clearly to restrict eligibility to a fairly narrow group, past experience warns that this may be easier said than done.
Second, it needs to decide what the time limit will be on the unemployment insurance. We have calculated how much protection the reformed system will provide immediately after job loss, but how meaningful that protection is depends in part upon how long unemployment insurance lasts.
Third, the government has a number of decisions to make around the nature and frequency of health reassessments. Our analysis suggests that, on average, health conditions do not improve much following the start of a claim, which may limit the value of frequent reassessments.
Fourth, the government is considering what obligations and support might be given to employers who have employees with disabilities. Given that claimants to health-related benefits seem to often be in poor health several years before they begin their claim, there may be scope for earlier intervention that obviates the need for a health-related benefit claim later on.
Fifth, the government has allocated additional funding for employment support programmes, rising to £1 billion in the last year of the parliament. The details here – as well as the expectations for engagement from claimants – are yet to be decided. Well-designed programmes could help blunt the income losses for those with health conditions, and so it is worth rigorously testing these programmes to make them as effective as possible.
Appendix
Figure A1. Percentage of working-age individuals reporting a long-standing health condition around first health-related benefit claim, split by length of time they receive health-related benefits
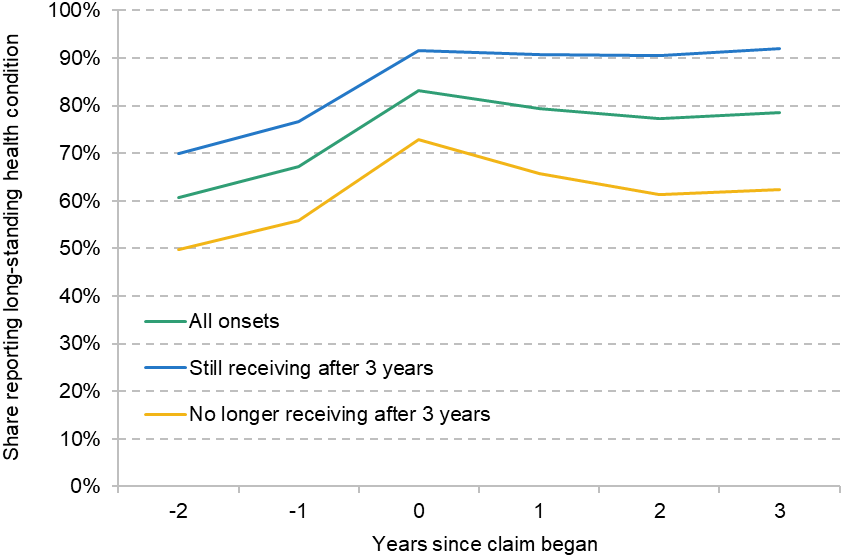
Note: For the figures in the main text, we draw a sample who we observe in every wave from two years prior to the first health-related benefit claim to five years after. Here we only require that we observe individuals three years after, in order to ensure that we have sufficient sample in both the ‘still on health-related benefits’ and ‘no longer on health-related benefits’ subgroups.
Source: Authors’ calculations using Understanding Society, 2009–2019.
Figure A2. Percentage of working-age individuals reporting a long-standing health condition around first health-related benefit claim, split by gender
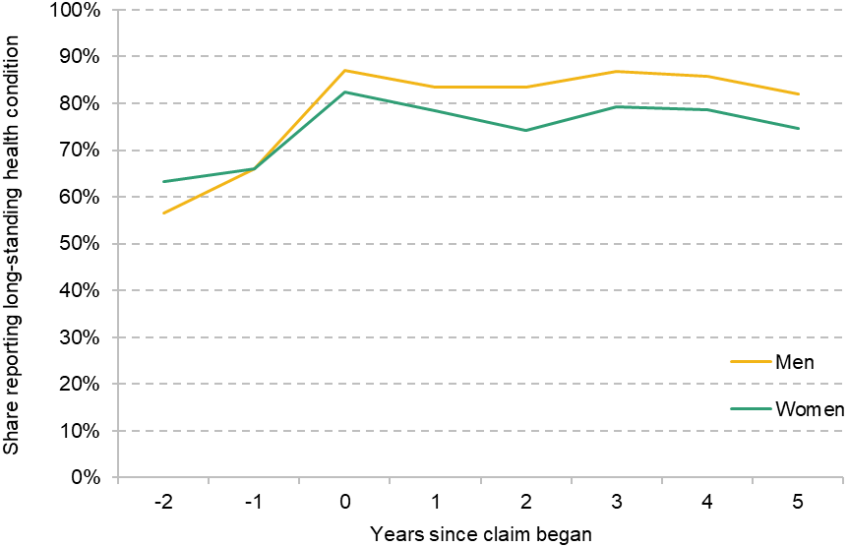
Source: Authors’ calculations using Understanding Society, 2009–19.
Figure A3. Percentage of working-age individuals reporting a long-standing health condition around first health-related benefit claim, split by age group
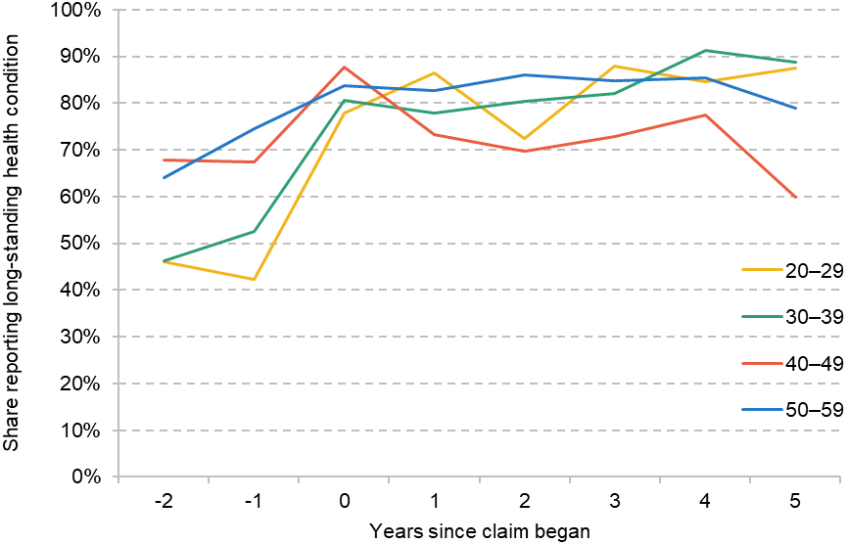
Source: Authors’ calculations using Understanding Society, 2009–19.
Figure A4. Percentage in the bottom quintile and other quintiles for mental health SF-12 around first health-related benefit claim
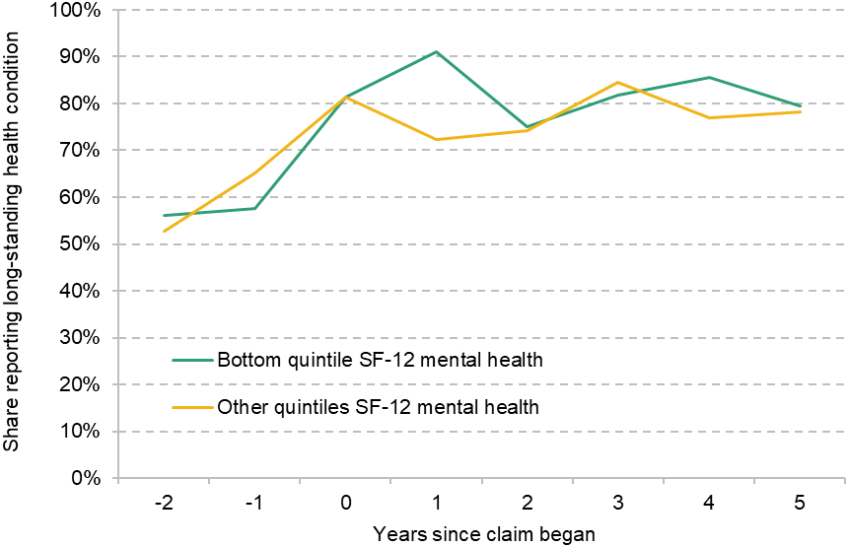
Source: Authors’ calculations using Understanding Society, 2009–19.
Figure A5. Percentage in the bottom quintile and other quintiles for physical health SF-12 around first health-related benefit claim
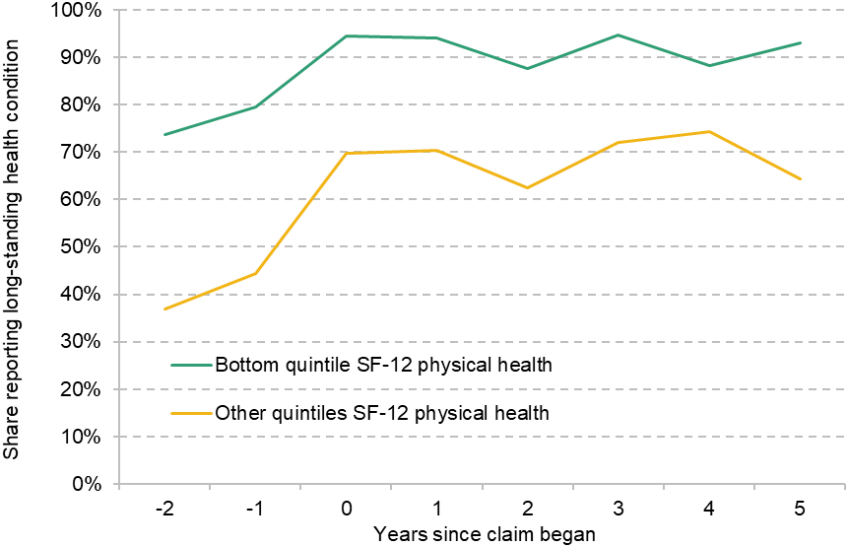
Source: Authors’ calculations using Understanding Society, 2009–19.
References
Codreanu, M. A. and Waters, T., 2023. Do work search requirements work? Evidence from a UK reform targeting single parents. IFS Working Paper 23/02, https://ifs.org.uk/publications/do-work-search-requirements-work-evidence-uk-reform-targeting-single-parents.
Department for Work and Pensions, 2008. Raising expectations and increasing support: reforming welfare for the future. https://assets.publishing.service.gov.uk/media/5a74ba2ded915d4d83b5e774/7506.pdf.
Department for Work and Pensions, 2025a. Benefit expenditure and caseload tables 2025. GOV.UK, 23 April 2025, https://www.gov.uk/government/publications/benefit-expenditure-and-caseload-tables-2025.
Department for Work and Pensions, 2025b. Pathways to Work: reforming benefits and support to get Britain working Green Paper. https://www.gov.uk/government/consultations/pathways-to-work-reforming-benefits-and-support-to-get-britain-working-green-paper/pathways-to-work-reforming-benefits-and-support-to-get-britain-working-green-paper.
Murphy, L. and Thwaites, G., 2025. No workaround: assessing the impact of the Spring 2025 disability and incapacity benefit reforms on employment. https://www.resolutionfoundation.org/publications/no-workaround/.
Office for Budget Responsibility, 2025. Economic and fiscal outlook: March 2025. https://obr.uk/docs/dlm_uploads/OBR_Economic_and_fiscal_outlook_March_2025.pdf.
Waters, T., 2025. Spring Statement 2025: IFS analysis (Tom Waters’ slides). Institute for Fiscal Studies event, 27 March 2025, https://ifs.org.uk/events/spring-statement-2025-ifs-analysis.
Data
Department for Work and Pensions, NatCen Social Research. (2021). Family Resources Survey. [data series]. 4th Release. UK Data Service. SN: 200017, DOI: http://doi.org/10.5255/UKDA-Series-200017.
University of Essex, Institute for Social and Economic Research. (2024). Understanding Society: Waves 1-14, 2009-2023 and Harmonised BHPS: Waves 1-18, 1991-2009. [data collection]. 19th Edition. UK Data Service. SN: 6614, DOI: http://doi.org/10.5255/UKDA-SN-6614-20.
Acknowledgements
The authors gratefully acknowledge the support of the ESRC Centre for the Microeconomic Analysis of Public Policy (ES/T014334/1).
Endnotes
Authors

Eduin Latimer
Eduin is a Senior Research Economist in the Income, Work and Welfare sector. His research focuses on benefits policy and the low-paid labour market.

Matthew Oulton
Matthew is a Research Economist in the Income, Work, and Welfare sector. His research focuses on the UK tax and benefit system.

Tom Waters
Tom is an Associate Director at the IFS and Head of the Income, Work and Welfare sector.
More from IFS
Understand this issue


Policy analysis


Academic research


