
Downloads
Download PDF
PDF | 813.56 KB
Executive summary
The Soft Drinks Industry Levy (SDIL) is a tax on pre-packaged soft drinks with added sugar. Introduced in 2018, the government’s stated aim was to reduce obesity (especially among children) by reducing the amount of added sugar in soft drinks, and encouraging consumers to switch to less sugary drinks (HMRC, 2016). Currently, drinks containing between 5 and 8 grams (g) of sugar per 100 millilitres (ml) are taxed at 19.4p per litre, and drinks containing over 8 g per 100 ml are taxed at 25.9p per litre. Drinks with sugar content below 5 g per 100 ml are not subject to the levy.
At the 2025 Autumn Budget, the government announced two reforms to the SDIL, to be implemented in January 2028. First, the minimum sugar content at which the levy applies will be reduced from 5 g per 100 ml to 4.5 g per 100 ml, bringing drinks with between 4.5 and 5 g of sugar per 100 ml into scope of the tax. Second, pre-packaged milk-based and milk-alternative drinks with added sugar (which were initially exempt from the SDIL) will be brought into scope.
In this report, we assess the likely effect of these reforms on sugar consumption. Given the SDIL’s explicit aim of reducing childhood obesity, we examine how impacts vary for households with and without children. We also focus on households who get the highest proportion of their total calories from free sugar, both because these households are most affected by the changes and because they are most likely to be consuming unhealthy amounts of sugar (with consequences for their long-term health).
Throughout the report, we use product level data from Worldpanel by Numerator’s GB Take Home panel, 1 January 2014 to 31 December 2024. All analysis and interpretation were undertaken independently of Worldpanel by Numerator. All conclusions are exclusively those of IFS and should not be attributed to, or interpreted as representing the views of, Worldpanel by Numerator.
Key findings
- The Autumn Budget’s changes to the SDIL will bring an additional 12% of the soft drinks market into scope of the tax. Around 8% of soft drink litres sold have just under 5 g of sugar per 100 ml (the current threshold). This partly reflects producers’ efforts to reformulate their drinks to avoid the tax – before the existing SDIL was introduced, just 2% of soft drink litres fell into this category. In addition, approximately 5% of litres sold are milk-based products, which were previously exempt but will now become liable. Some products fall into both categories, meaning that, unless products are reformulated, the total share of litres sold in scope will rise from 13% to 25%.
- The reforms will have a bigger impact on the households that currently purchase the most sugar, both in absolute terms and as a share of their total soft drink purchases. Combined, the changes at the Autumn Budget will affect 14% of the soft drink litres purchased by the households who get the largest share of their calories from free sugars, compared to 10% for households that purchase the lowest amount of sugar. This difference is largely due to changes to the lower sugar threshold: households with a high free-sugar calorie share purchase around 5 percentage points more of their soft drink litres from the 4.5–5 g band than households with a low free-sugar share. By contrast, extending the levy to milk-based drinks will not target the households with the highest free-sugar share: milk-based drinks make up, if anything, a smaller share of calories for these households.
- While reducing children’s soft drink consumption was an explicit aim of the SDIL, the recent changes are not especially well targeted at the grocery purchases made by households containing children. Households with children do not systematically buy more of the affected drinks to consume at home than households without children. However, individual-level data on out-of-home purchases suggest children spend a greater share of their total out-of-home expenditure on the products being brought into scope than adults. This means that the SDIL – and these reforms – may be more effective at reducing the sugar children consume outside the home.
- While the original SDIL had meaningful effects on sugar consumption, we find that the reforms announced at the Autumn 2025 Budget will have a very small additional impact. Under our central assumptions, we estimate that the reforms will reduce average per-person calorie purchases by 0.3 kcal per day – less than 0.02% of the recommended daily calorie intake for adults. This is in contrast to an average fall of 18 kcal per day from the original SDIL. The difference between these effects partially reflects a fall in sugar consumption from soft drinks since 2018, meaning the effects of these changes are relative to a smaller baseline. In addition, a smaller share of the market are being brought into scope compared to the original SDIL, and the expected reduction in sugar from affected drinks is smaller.
- Reflecting the small average impact these reforms will have on sugar purchases, we also estimate that they will impose very small financial costs on most households. We estimate that price increases resulting from the recent measures will cost the average household less than 2p per week. However, the effects of the tax will be felt by all purchasers of soft drinks – including those whose sugar consumption is not especially high, where it is much harder to make a case for policymakers to intervene. Consumers who prefer the taste of higher-sugar products may also be made worse off by the policy if producers reduce the sugar content of their products. Producers will also be affected by the tax, either through paying the direct costs of reformulation or through accepting lower net-of-tax prices.
- More reformulation does not necessarily mean a greater fall in sugar consumption. The SDIL can reduce sugar consumption via two mechanisms: producer reformulation and consumer switching.Manufacturers may reduce the sugar content of their products to avoid the levy (reformulation). If they do not, consumers may switch away from taxed products as their prices increase.Under the original SDIL, nearly 80% of the reduction in sugar intake came from producers reformulating their products to reduce their tax liability. By contrast, our results suggest that product reformulation in response to the recent reforms may lead to smaller reductions in sugar than if products remained unchanged and consumers switched to other drinks. This reflects the scope for producers to make modest changes to the sugariness of their drinks and thereby avoid the tax (and remove the financial incentives that would encourage consumers to switch to even lower sugar options).
- The changes may increase demand for non-milk-based drinks with very high sugar content. The reforms do not increase the tax rate on non-milk-based drinks in the higher-rate band (with sugar content greater than 8 g per 100 ml). As the price of other, less-sugary drinks brought into the tax increases, these very sugary drinks will become relatively cheaper. The resulting switching towards these products may reduce the policy’s effectiveness in reducing sugar consumption, particularly for households that consume high amounts of sugar.
- Alternative policy levers that would increase the relative prices of the most sugary drinks could have a bigger impact on the purchases of households most at risk of overconsuming sugar. For the households that purchase the most sugar, around a sixth (16%) of the soft drinks they purchase have a sugar content over 8 g per 100 ml, compared to 5% for the households that purchase the least sugar. If the government wants to reduce sugar intake among those at the greatest risk of overconsumption, policies aimed at drinks with very high sugar content would target this group more precisely. Our simulations suggest a 7p per litre increase in the higher rate (from 25.9p per litre to 32.7p per litre) would have the same average effects on sugar consumption as the Budget 2025 reforms, but would reduce the sugar intake of the households that consume the most sugar by 0.62 kcal per day, compared to 0.42 kcal per day under the actual reforms.
1. Introduction
The Soft Drinks Industry Levy (SDIL) is a levy on pre-packaged soft drinks with added sugar. It has a banded structure with thresholds based on sugar concentration: as of March 2026, drinks with between 5 g and less than 8 g of sugar per 100 ml are taxed at 19.4p per litre, and drinks with 8 g per 100 ml or more are taxed at 25.9p per litre. Drinks containing less than 5 g of sugar per 100 ml face a zero rate. At the Autumn 2025 Budget, the government announced two reforms to the SDIL, to be introduced in January 2028. The first is to reduce the lower sugar threshold from 5 g to 4.5 g per 100 ml. The second is to bring milk-based products (which were previously exempt) into the scope of the levy.
In this report, we evaluate what the likely effect of these reforms will be on soft drinks purchases and sugar consumption. We use product-level unweighted data from Worldpanel by Numerator’s GB Take Home panel, 1 January 2014 to 31 December 2024, to document the share of sales brought back into the home that will be affected by the recent changes and how this varies across household types. We focus on households with high free-sugar intakes and households with children, who may be most likely to under-internalise the health costs associated with the consumption of soft drinks. We then use a simple model of soft drinks demand to predict the effects of the recent reforms on sugar intake. Importantly, our approach allows us to quantify how these effects will vary across households, and how the results depend on two key uncertainties: the extent to which firms reformulate their products, and the extent to which consumers switch to lower-sugar alternatives.
The government’s stated objective for the SDIL is to reduce consumption of added sugar from soft drinks as part of its wider strategy to reduce obesity rates (with an emphasis on childhood obesity). The Scientific Advisory Committee on Nutrition (SACN) recommends that fewer than 5% of calories should come from free sugars1 (Public Health England, 2015), but Figure 1 suggests this is far from typical in practice: around 80% of adults aged 18–65 exceed the recommendation, often by a considerable margin. Notably, around 95% of children aged 5–17 exceed the recommended sugar intake. Survey data on dietary intake suggest that adults consume 11% of their free sugars from soft drinks with added sugar, rising to 14% for children aged 11–17 (Office for Health Improvement and Disparities, 2025a). Taken together, this suggests that added-sugar soft drinks are a meaningful source of high sugar intake.
Figure 1. Cumulative distribution of share of calories from free sugars by age group
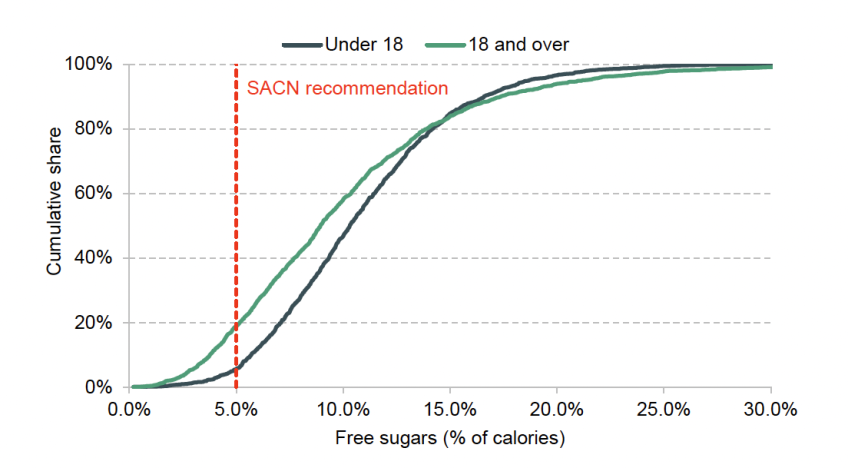
Source: Authors’ calculations using National Diet and Nutrition Survey, 2019–23. The ‘Under 18’ group contains individuals aged 5–17, and the ‘18 and over' group contains individuals aged 18–65.
From an economic perspective, the relevant criterion is not health harms in themselves. Consumers may rationally trade off health risks against pleasure derived from the consumption of soft drinks and choose to consume a large quantity of sugar from these products. However, if some of the harms from soft drink consumption are unpriced or under-internalised, a levy may improve the efficiency of market outcomes by lowering sugar consumption.
There are two ‘market failures’ that may justify government intervention in this market. The first is externalities. When individuals consume soft drinks, they may not fully account for the costs their consumption imposes on others – most obviously, the burden on public healthcare. Bell et al. (2023) estimate the annual cost to the NHS of people who are overweight and people with obesity at £19 billion. If soft drink consumption is a contributor to obesity, there is a case for taxing these products to reflect their broader social cost.
The second is ‘internalities’, where consumers bear future health costs that they do not fully consider because of imperfect information, present bias or self-control problems. In the context of soft drink consumption in the United States, Allcott, Lockwood and Taubinsky (2019) combine a survey on nutritional knowledge with data on household purchases and estimate that the average household would consume 38% to 48% fewer soft drinks if they had the nutritional knowledge of dieticians and perfect self-control. Policymakers are often particularly concerned with internalities that affect children (who may be less able than adults to make informed choices that take long-run considerations into account).
In theory, the recent changes to the levy may reduce consumption of soft drinks through two main channels. First, the changes may increase the price of drinks brought into scope, if the levy – paid by producers and importers of soft drinks – is passed through to consumers (rather than being absorbed in firm profits). This may encourage consumers to switch away from these products, potentially towards lower-sugar alternatives, which are untaxed. However, it is important to note that the measures also reduce the relative price of high-sugar, non-milk-based drinks and thus may increase demand for these products.
Second, the changes to the levy could incentivise firms to reformulate their products, reducing sugar content to lower their tax burden. This will reduce the sugar consumption of households if they are happy to continue buying these products, and do not respond to reformulation by substituting to other high-sugar products. Existing evidence suggests there was widespread reformulation in response to the original SDIL, and consumers continued to purchase reformulated products. This resulted in a fall in calorie purchases of soft drinks of around 18 calories per day per person (Dickson, Gehrsitz and Kemp, 2025), with around 80% of this reduction being attributable to reformulation by producers.
The remainder of the report proceeds as follows. In Section 2, we describe the recent reforms in more detail, before examining what share of soft drink sales is affected and how this varies across household types. In Section 3, we estimate the effects of the reforms using an economic model of soft drink demand combined with data on purchase quantities and prices. We simulate the impact under different assumptions about reformulation and consumer switching (details of the model are provided in Appendix A). In Section 4, we discuss other issues relating to the structure and implementation of the SDIL, and we conclude in Section 5.
Throughout the analysis, we use product-level unweighted data from Worldpanel by Numerator’s GB Take Home Panel, 1 January 2014 to 31 December 2024, described in full detail in Appendix B. The Worldpanel dataset provides a uniquely detailed view into the purchasing baskets of households. In particular, access to product-level information allows us to identify the specific products that are brought into scope by the extension to milk-based drinks and the reduction in the lower threshold (as we observe the sugar content of specific barcoded products). There are some considerations regarding the dataset to note. First, the data measure purchases, rather than consumption. This is well suited to our analysis, as the SDIL is designed to operate through household purchasing decisions – the dataset therefore speaks directly to the stage of behaviour the policy is intended to influence.
Second, the GB Take Home Panel captures food and drink brought back into the home and does not include out-of-home purchases (e.g. from restaurants or fast food chains), data that are available separately from Worldpanel by Numerator’s GB Out of Home panel. We focus on at-home consumption purchases (e.g. from supermarkets). In Appendix B, we show that the distribution of soft drink purchases across sugar content bands, and changes in these shares over time, follow similar patterns in the Out of Home panel data. Whether households who consume a lot of sugar inside the home also consume more or less sugar outside the home is a priori unclear and beyond the scope of this report. There is evidence that children consume a large share of their added sugars inside the home, where purchases are generally made at the household level (Griffith et al., 2020). In Section 2, we report children’s out-of-home expenditure shares on soft drinks compared with those of adults, which allows us to consider whether the recent changes are well targeted at children’s out-of-home purchases.
2. Changes to the Soft Drinks Industry Levy
The reforms mean that, from January 2028, the SDIL will change in two ways.
- Lowering the sugar threshold.The minimum sugar content at which the levy applies will be reduced from 5 g to 4.5 g per 100 ml, meaning drinks with sugar content in the 4.5–5 g range will now become liable for the levy.
- Expanding the scope to include milk-based drinks.Pre-packaged milk-based and milk-alternative drinks with added sugar, such as milkshakes, flavoured milks, sweetened yoghurt drinks, chocolate milks and ready-to-drink coffees, will now be subject to the levy, whereas they were previously exempt. (These will be subject to the new thresholds of 4.5 g per 100 ml and 8 g per 100 ml.)
To assess what these changes are likely to achieve, it is useful to focus on three questions. First, how many purchases are affected by the reforms, and who is making these purchases. We are particularly interested in whether the policy is well targeted at households most likely to overconsume sugar. Second, how far the changes will reduce sugar intake, given assumptions about how much producers reformulate their products and how consumers respond to higher prices. Third, what the reforms mean for the specific groups the policy most wants to reach.
Reducing aggregate sugar consumption is the primary aim of the policy, but the reforms are better evaluated by also asking whether they reach the right consumers. A fall in aggregate sugar intake does not, per se, show that the reform raises well-being. Households choose which soft drinks to consume by weighing perceived benefits against perceived health costs. Where some consumers underestimate those costs (or place too little weight on them at the point of purchase), a levy can improve decisions by pushing them to internalise more of the harm. But a levy of this kind applies to everyone: it also raises prices for consumers who already fully understand and take account of the health consequences of additional consumption. For these consumers, the levy does not correct a market failure – it simply makes them worse off by pushing them to consume less than they would freely choose.
In an ideal world, we would be able to levy taxes only on those who ‘overconsume’ sugar (i.e. those who fail to internalise the costs of their consumption). In practice, we do not directly observe which individuals are overconsuming sugar in this sense. One plausible concern is that households for whom (free) sugars make up a large share of total calories are less likely to be fully internalising the health costs of consumption. Another is households with children: children are unlikely to fully understand the long-run consequences of high sugar intake, and their at-home consumption is largely shaped by parental purchasing. To study whether the recent changes are well targeted, it is therefore useful to examine whether these ‘at-risk’ groups purchase more or less of the product by the reforms.
Reducing the lower threshold
Figure 2 illustrates the proposed reduction in the lower SDIL threshold, showing that it represents a relatively modest change of 0.5 g of sugar per 100 ml. Despite this, a large share of soft drink purchases is concentrated in this region, as shown in Figure 3, which plots the volume-weighted distribution of soft drink purchases by sugar content. As shown in the figure by the shift in the distributions over time, this concentration largely reflects reformulation triggered by the introduction of the SDIL, as many products were adjusted to sit just below the 5 g per 100 ml cut-off. The bottom row of Table 1 shows that, before the levy, only 2% of consumed litres of soft drinks came from products in this band; after implementation, the share rose to 10% This share is an average over the entire post-SDIL period, and will mask differences over time in the share of sales in this band. Based on the most recent full year of data in our sample (2023), we estimate that 8% of soft drinks litres sold lie in the 4.5–5 g per 100 ml band, and will be brought into scope of the levy by this change.
Figure 2. Changes to the SDIL threshold
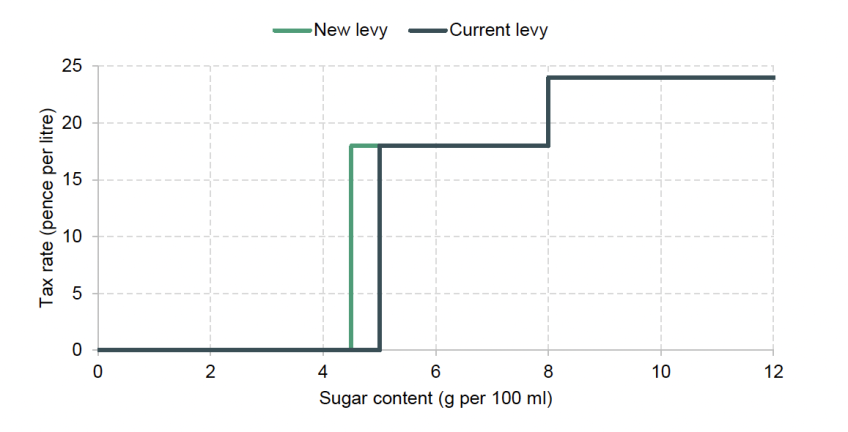
Note: Uprating to the SDIL (discussed in Section 4) is not shown on this chart.
Figure 3. Volume-weighted distribution of take-home drink sales by grams of sugar per 100 ml before and after original implementation of the SDIL (excluding diet drinks)

Note: The 4.5–5 g per 100 ml band being brought into scope is highlighted in red, and the higher threshold (8 g per 100 ml) is shown as a blue dotted line. Sugar content is winsorised at 15 g per 100 ml. Drinks containing no sugar are not plotted but comprise 49% of the take-home market for soft drinks over the period. We plot the tax-liable sugar content of products, which will differ from total sugar content for milk-based drinks, due to the lactose allowance, and for fruit squash, due to allowances for dilution. Analysis and interpretation were conducted independently of Worldpanel by Numerator.
Source: Authors’ calculations using Worldpanel by Numerator’s GB Take Home Panel, 1 January 2014 to 31 December 2024.
Table 1. Average sugar from soft drinks, and the composition of soft drinks purchases, by household group (pre-SDIL → post SDIL)

Note: Average sugar per day is per adult equivalent (equivalised using the OECD equivalence scale). Figures to the left of the arrow reflect pre-SDIL values (January 2014-April 2018), and values to the right reflect post-SDIL values (April 2018 - March 2024). Volume is measured in litres purchased. Shares are constructed using Worldpanel weights designed to match aggregate market shares. Total shares may not equal 100 due to rounding. Analysis and interpretation were conducted independently of Worldpanel by Numerator.
Source: Authors’ calculations using Worldpanel by Numerator’s GB Take Home Panel, 1st January 2014 to 31st December 2024.
The recent changes are likely to provide similar incentives for firms with products in the 4.5–5 g sugar band to reformulate their products, and this is one mechanism by which the policy may reduce sugar consumption. For drinks that become liable and are not reformulated, sugar intake may still fall if higher prices lead consumers to switch to lower-sugar alternatives such as diet drinks (which now make up 74% of soft drink litres purchased, up from 62% prior to the introduction of the SDIL).
Looking across rows of Table 1 reveals that the increase in the market share of the 4.5–5 g band seems to have been driven by households who consume a lot of sugar. Households with a high share of calories from free sugars purchase around 5 percentage points more of their soft drinks from this band than households with a low free-sugar calorie share. This provides indicative evidence that the reduction in thresholds may be well targeted at the high-sugar households most at risk of overconsumption.
However, such households also continue to purchase a notably large share of their soft drinks from the most sugary band (18% versus 6% for the lowest-sugar group). For the most recent year of data, 16% of soft drink litres come from the most sugary band for these households, compared to 5% for the households purchasing the least sugar. To the extent that these products are not milk-based, the recent changes act to reduce the relative price of these products and, as such, could in principle serve to increase sugar consumption for this group. The disproportionate share of these products in the consumption basket of high-sugar households suggests that an increase in the higher rate of the SDIL may be more effective in reducing sugar consumption among this group than the actual reforms. We return to this in Section 3.
Both the level and composition of sugar from soft drinks do not appear to vary substantially across households with and without children, with both getting 10% of their sugars from soft drinks from the 4.5–5 g band. This does not necessarily mean that the threshold changes are not effective in targeting the excess consumption of children. It may be that children are more likely to purchase drinks in the 4.5–5 g band for consumption outside of the home. Equally, our data measure purchases (rather than consumption) at the household level – within the household, children may consume a greater share of these drinks.
Extension to milk-based drinks
Drinks with added sugar containing at least 75 ml of milk per 100 ml were initially exempt from the SDIL, due to concerns over low calcium levels among children (HMRC, HM Treasury and Department of Health & Social Care, 2025a, 2025b). These drinks will be brought into scope of the levy from January 2028. They will, however, receive a ‘lactose allowance’ (which will vary across products), and only the sugar over this allowance will count towards the levy.2
These drinks make up approximately 5% of the soft drinks market. Figure 4 shows the share of calories from free sugars obtained from different food categories, for households who consume more or less sugar (as a proportion of their total calories). For all groups, milk-based drinks constitute a very small share of total free sugars consumed. This suggests the impact of these changes on overall sugar consumption is unlikely to be large.
Figure 4. Share of free sugars from food/drink category, by total free-sugar quartile
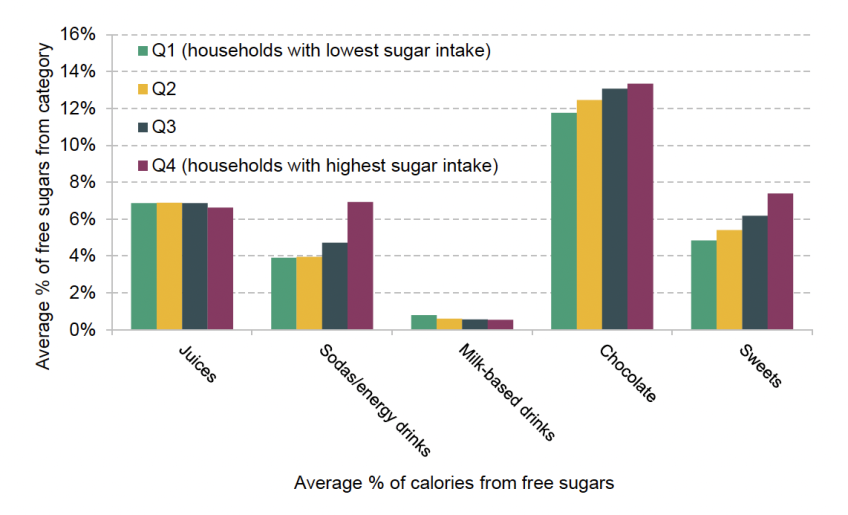
Note: Shares are taken from the post-SDIL period (April 2018 to March 2024). Analysis and interpretation were conducted independently of Worldpanel by Numerator.
Source: Authors’ calculations using Worldpanel by Numerator’s GB Take Home Panel, 1 January 2014 to 31 December 2024.
When looking only at purchases into the home of soft drinks (e.g. from supermarkets), it appears that, if anything, households with a high sugar intake appear to consume a smaller share of their free sugars from milk-based products (as shown in Figure 5). This is also the case for households with children compared with those without children. However, individual-level data for out-of-home purchases (e.g. purchases in cafes and restaurants) paint a somewhat different picture to the household data, suggesting that children allocate a greater share of their out-of-home expenditure to these drinks than adults. This would imply the reforms may have a larger effect on children’s overall sugar intake than the household data alone would indicate. Figure 6 shows the average expenditure share across broad categories for under-18s and adults and indicates that children tend to spend a higher proportion on both soft drinks and milk-based drinks.
Figure 5. Share of free sugars from food/drink category, by children in household status
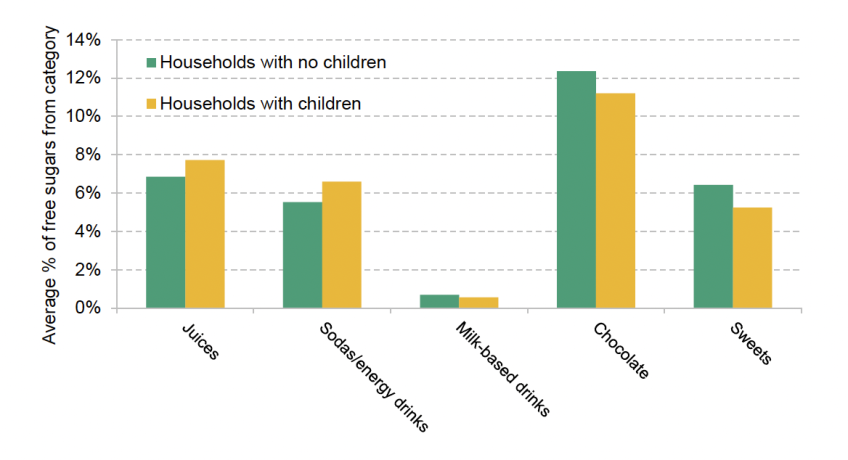
Note: Shares are taken from the post-SDIL period (April 2018-March 2024). Analysis and interpretation were conducted independently of Worldpanel by Numerator.
Source: Authors’ calculations using Worldpanel by Numerator’s GB Out of Home Panel, 1 January 2014 to 31 December 2024.
Figure 6. Proportion of out-of-home expenditure for food/drinks category by age group
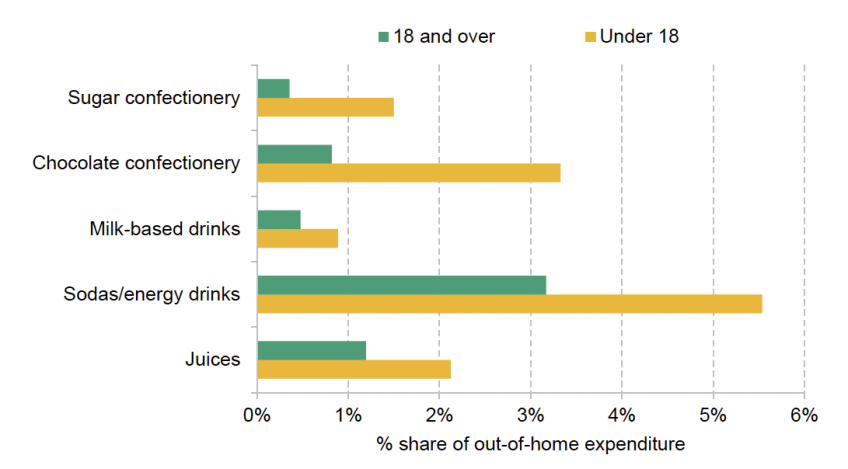
Note: Shares are taken from the post-SDIL period (April 2018-March 2024). Analysis and interpretation were conducted independently of Worldpanel by Numerator.
Source: Authors’ calculations using Worldpanel by Numerator’s GB Out of Home Panel, 1 January 2014 to 31 December 2024.
The milk-based drinks that are purchased appear to be quite sugary on average. The sales-weighted mean sugar content of these drinks is 8.49 g per 100 ml, suggesting that a large share of sales will be affected by the reforms. However, only a proportion of the sugar in these drinks will be liable for the levy due to the lactose allowance. Figure 7 plots the sales-weighted distribution of these products following the implementation of the SDIL, under the assumption that the allowance is 4 g per 100 ml (assumed in the government’s Health Assessment).
Figure 7. Volume-weighted distribution of milk-based drink sales by grams of sugar per 100 ml after original implementation of the SDIL (including lactose allowance)
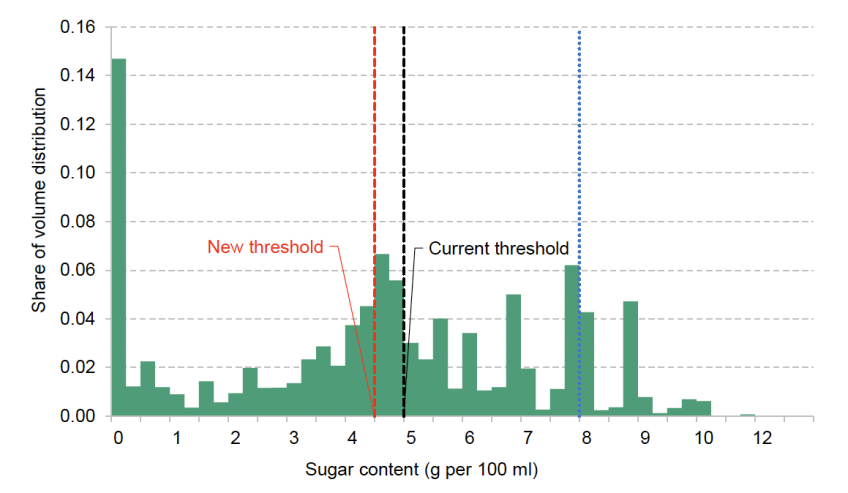
Note: The 4.5–5 g per 100 ml band being brought into scope is highlighted in red, and the higher threshold (8 g per 100 ml) is shown as a blue dotted line. Sugar content is winsorised at 15 g per 100 ml. We subtract 4 g per 100 ml from the sugar content of each product to account for the lactose allowance on milk-based drinks. Analysis and interpretation were conducted independently of Worldpanel by Numerator.
Source: Authors’ calculations using Worldpanel by Numerator’s GB Take Home Panel, 1 January 2014 to 31 December 2024.
3. How will the changes affect overall sugar consumption?
In this section, we extend the descriptive analysis presented in Section 2 by carrying out a numerical exercise to assess the likely effects of the SDIL changes on sugar consumption. To do so, we combine data on product-level purchase quantities, prices and sugar content in a simple economic model of demand for drinks, which we use to simulate the impact of the policy.
Our aim in carrying out this exercise is not to provide a definitive and precise estimate of the policy’s impact on sugar consumption. There are several uncertainties that make such a calculation difficult. On the demand side, the impact will depend on how consumers substitute between beverages as relative prices change, and on how responsive demand is to price changes across products. On the supply side, the policy is expected to induce some reformulation as firms seek to avoid the tax, but there is substantial uncertainty about how widespread this will be. The extent of reformulation will depend on how consumers are expected to respond to higher prices, the costs of changing product recipes, and the degree of competition in the market. For products that do not reformulate, it is also unclear how much of the tax will be passed through to consumers rather than absorbed in firms’ margins.
Any attempt at predicting the policy’s effects will need to take a stand on the quantitative importance of these factors. The advantage of our approach is that it makes our assumptions about these forces explicit and allows us to assess how sensitive our estimates are to changes in those assumptions. It also ensures internal consistency: a demand model requires that substitution patterns, price responses and expenditure shares all cohere with one another, rather than being specified independently. These restrictions provide useful discipline in thinking through how the SDIL changes will affect sugar consumption. Accordingly, the primary value of our results is to illustrate the mechanisms through which the SDIL changes are likely to affect consumption, rather than to place undue weight on any single set of point estimates.
We specify an economic model of drinks demand that translates changes in drink prices into predicted changes in quantities bought. The model assumes that households allocate a fixed overall budget across broad drink categories (e.g. soft drinks versus flavoured milk), then choose between specific products within each category. The key inputs of the model are assumptions about how readily consumers switch between close substitutes (e.g. between different cola products) versus switching across broader drink types (soft drinks versus flavoured milk). Estimating these parameters from data is beyond the scope of this report; instead, we calibrate these values using existing evidence on price sensitivities from the literature, and study how the results change depending on the degree of consumer substitution. We always assume that consumers are (weakly) more willing to substitute to products within a category than those in a different category.
Another key input is the set of post-policy prices. In line with evidence from the introduction of the SDIL (Dickson, Gehrsitz and Kemp, 2025), we assume the tax is fully passed through to consumers. However, we allow for the possibility that some products are reformulated in response to the policy change, allowing firms to avoid the levy. We compute predicted changes in sugar consumption under the extreme assumptions that no products and all products brought into scope by the policy changes are reformulated. We also simulate the case where 65% of products brought into scope are reformulated; this is the government’s central estimate of reformulation, assumed in the policy costing (HM Treasury, 2025). In this case, we assume that the products closest to the relevant thresholds reformulate to just below the threshold (with full details provided in Appendix A).
We can then infer how quantities of each product purchased will change following the SDIL measures, from pre-policy quantities and prices, post-policy prices and calibrated parameter values. From this, we can obtain the change in total sugar from soft drinks following the changes. For pre-policy quantities and prices, we use data from Worldpanel by Numerator’s GB Take Home Panel from 1 March 2023 to 31 March 2024. We study this period as it provides the most up-to-date measures of market shares (it is the most recent period in our data), and by using just over a year rather than the entire post-policy period, we minimise the amount of reformulation that occurs during our sample period. For our heterogeneity analysis, we calculate these quantities separately by group.
We provide full details of our approach in Appendix A, but highlight the key assumptions and limitations underlying our approach here. Our model assumes that the willingness of consumers to substitute across products within a category are governed by a single parameter.3 It may be, for example, that within the category of ‘non-diet carbonated soft drinks’, households perceive two cola products as closer substitutes than a cola product and a lemonade product. Our model does not allow for this – however, by defining nests relatively finely,4 we can allow for some variation in consumer switching across products. We also assume that households do not substitute away to other sugary products (e.g. chocolate) in response to the tax change, and keep their total expenditure on soft drinks constant (but reallocate across products). We feel this is reasonable given the policy change is relatively small and can thus be interpreted as changing relative prices of different drink products (rather than a large increase in the relative price of soft drinks). It is ambiguous whether consumers view sugary snacks as substitutes or complements for soft drinks (and this may vary across consumers), making it hard to take a stand on how the reforms will affect sugar consumption from elsewhere. There is also evidence from other contexts that consumers do not view sugary foods and soft drinks as substitutes (Finkelstein et al., 2013).
Importantly, our approach implicitly assumes that reformulation does not affect demand for the product via changes in the attractiveness of the product, which will be violated if, for example, reducing the sugar content of a drink changes its taste. Finally, we do not model the price-setting or reformulation decisions of firms explicitly, but instead assume a given amount of reformulation and full tax pass-through. If the policy results in reformulation, it is possible, for example, that the market for low-sugar soft drinks will become more competitive, which could further drive down prices in that market segment and make the policy more effective.
Average effects of the SDIL changes on sugar consumption
Table 2 shows the predicted reduction in the grams of sugar from soft drinks resulting from the recent changes, under different assumptions on the degree of consumer switching and reformulation. The table makes clear the mechanisms at play in reducing sugar consumption. For a given level of reformulation, a greater willingness of consumers to substitute across products increases the magnitude of the decrease in sugar consumption, as consumers are more willing to switch away from the 4.5–5 g band and sugary milk-based drinks in response to the relative increase in their price. With full reformulation, products would avoid the levy, so relative prices barely change and the results are insensitive to substitution. The exception is milk-based drinks above 8 g, which we assume reformulate to 7.99 g and therefore enter the SDIL for the first time; this generates some substitution away from them.
Table 2. Model-based estimates of the fall in sugar consumption resulting from the SDIL changes (% decrease in total grams from soft drinks)
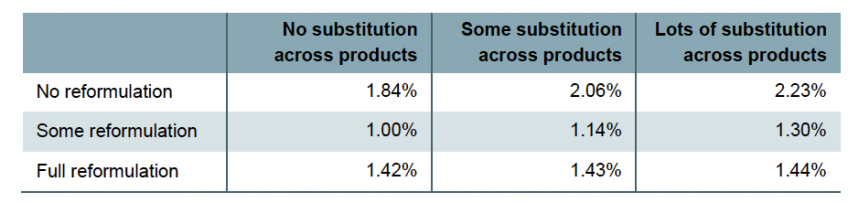
Note: All changes are decreases (so a positive value indicates a fall in sugar consumption). Full details of the model and assumptions are described in Appendix A. Analysis and interpretation were conducted independently of Worldpanel by Numerator.
Source: Authors’ calculations using Worldpanel by Numerator’s GB Take Home Panel, 13 m/e March 2024 (1 March 2023 to 31 March 2024).
The decrease in sugar resulting from the changes is non-monotonic in the amount of reformulation: moving from no reformulation to partial reformulation can actually reduce the policy’s effect on total sugar consumption. This reflects a tension between the two channels through which the policy operates. Under reformulation, products reduce their sugar content to fall below the threshold. But because we assume that the products most likely to reformulate are those nearest the threshold – with relatively low sugar to begin with – the sugar saved per reformulated product is small. At the same time, reformulation eliminates the price shock on those products, shutting off the demand substitution channel. Without a price increase, consumers have no incentive to switch away from these products towards lower-sugar alternatives. This matters because the demand channel can be powerful: the large share of diet drinks in the soft drinks market (Table 1 and Figure 3) means that much of the substitution away from taxed products is directed towards drinks with very low sugar, generating substantial sugar reductions. Partial reformulation sacrifices this substitution effect in exchange for a modest direct reduction in sugar content, and the net result can be a smaller overall reduction in sugar consumption.
Under intermediate assumptions, sugar consumption from soft drinks is expected to fall by 1.14%. Applied to our Worldpanel estimate of average sugar from soft drinks (7.5 g per day) in Table 1, this implies a reduction of 0.09 g of sugar per day, or 0.32 kcal per day. The Health Assessment by the Department of Health & Social Care estimates a similar reduction of 0.3 kcal per day, but uses the National Diet and Nutrition Survey (NDNS) as a baseline, which yields average sugar consumption from soft drinks of 5.09 g per day – slightly over half of the Worldpanel figure.5 On a like-for-like basis using the NDNS baseline, our central estimate is 0.22 kcal per day, about 27% lower than the government’s estimate. Part of this difference is likely to reflect the fact that, though a lot of the substitution response is directed to low-sugar drinks, some of this demand is also directed to the highest-sugar drinks in the >8 g per 100 ml band, which are made relatively cheaper by the policy. The government preclude this possibility in their assessment, by assuming that ‘consumers will substitute to drinks with lower sugar content which are not affected by SDIL’ (HMRC, HM Treasury and Department of Health & Social Care, 2025a, 2025b). We return to the quantitative importance of this channel below. In the rest of the report, we use our Worldpanel estimates of total sugar consumption (rather than those in the NDNS) to calculate predicted changes.
Importantly, our results underline the sensitivity of these changes to the degree of substitution across products and reformulation. Depending on these, the effect on average total calories per day could be as low as 0.28 (if there is some reformulation, and no substitution across products) or as high as 0.62 (if no products reformulate and consumers are extremely responsive to price changes).
In all cases, however, the effect of the recent changes is far smaller than the estimated average 18 kcal per person per day fall resulting from the original SDIL (Dickson, Gehrsitz and Kemp, 2025). In part, this reflects the fact that sugar consumption from soft drinks has fallen since the introduction of the SDIL (from 10.5g per day to 7.5g per day, as shown in Table 1). Hence, the proportional effect of the changes is relative to a smaller baseline. In addition, the changes themselves bring a smaller share of the market into scope of the levy. Approximately 12% of litres sold are brought into scope by the reforms, compared to 33% of litres sold under the initial SDIL (Office for Health Improvement and Disparities, 2025b). Finally, a large share of the original SDIL’s effect resulted from reformulation of drinks in the higher band – whose incentives to reformulate are unaffected by this change – suggesting the fall in sugar from affected products is likely to be smaller under the recent changes.
Whilst the changes to the levy are expected to reduce sugar consumption, they are also likely to impose costs on consumers and producers. The financial cost to consumers will be greatest if there is no reformulation (as all products brought into scope will remain liable for the levy in this case). We estimate that under intermediate assumptions on substitution (and assuming no reformulation), the price index for soft drinks would increase by approximately 1.1% as a result of the recent changes. Given households spend an average of £1.69per week on soft drinks for at-home consumption, this corresponds to a 2pper week cost to households if they did not adjust their purchasing behaviour in response to the price change.
Differences in impacts across groups
In Figure 8, we consider differences in the predicted effect of the policy across different groups, under the central assumption that 65% of products brought into scope are reformulated in response to the policy. These effects are likely to vary across groups because, as discussed in Section 2, the products brought into scope make up different shares of total soft drinks expenditure for different households.
Our model predicts that there are very small differences between the proportional effect on households with low and high sugar consumption. In part, this reflects the fact that milk-based drinks make up a similar share of the group’s purchasing baskets. It is also driven by the fact that households with a high sugar intake consume a lot of very sugary drinks (from Table 1, they get 22% of their soft drink sugars from products in the top band, as compared to 9% for the households with the lowest sugar intake). This leads households with a high sugar intake to substitute more readily toward higher-sugar energy drinks and carbonated soft drinks (which are made relatively cheaper by the policy).
The effect on grams of sugar and calories is largest for the highest-sugar group, because their baseline sugar consumption from soft drinks is highest. Under intermediate assumptions on substitution, households who consume the most sugar are expected to reduce their calories from sugar in soft drinks by 0.42 kcal per day, compared with 0.19 kcal per day for the households with the lowest sugar consumption.
Figure 8 decomposes these changes into the change in calories consumed from each sugar band, for each group. The biggest fall in calories for all groups comes from the 4.5–5 g band, reflecting reformulation of products in this band and substitution away from non-reformulated products. There is also a fall in calories from the 5–8 g band (reflecting milk-based products in these bands), and a slight increase in sugar from the lowest band (reflecting a shift in demand towards drinks that are relatively more sugary in this band, and reformulation to the top of the band).
Figure 8. Change in daily calorie intake due to SDIL changes from different sugar bands, separated by household sugar intake
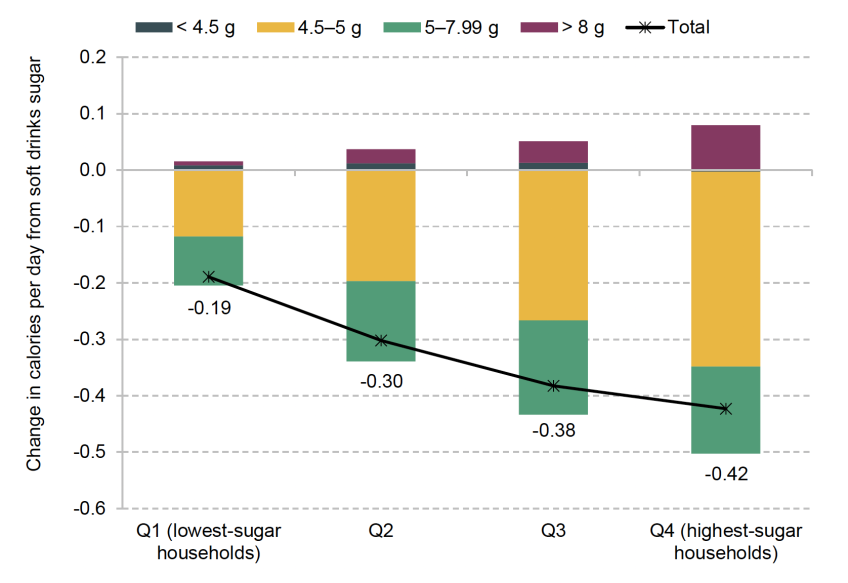
Note: The quartiles are with respect to the distribution of the share of calories from free sugars, as referred to in Section 2. We assume that 65% of products are reformulated in response to the policy changes, and that consumers engage in ‘some substitution across products’ (details of how this is parametrised are given in Appendix A).
Source: Authors’ calculations using Worldpanel by Numerator’s GB Take Home Panel, 13 m/e March 2024 (1 March 2023 to 31 March 2024).
For all groups, there is an increase in calories consumed from the most sugary products (in the >8 g per 100 ml band). This is because non-milk-based products in this band are made relatively cheaper by the policy, generating substitution towards them. This substitution is strongest for households that have a high sugar intake, which increase their calories from the most sugary drinks by 0.08 kcal per day. Across all groups, the average increase in calories per day from this band is 0.04 kcal per day. As discussed previously in this section, the possibility of substitution toward high-sugar products is ruled out by the government’s modelling assumptions. Our analysis highlights that this is a quantitatively important response to the changes, which is likely to reduce the effect on total sugar consumption.
These results imply a mixed picture about how well targeted the recent changes are. It is true that the changes appear to imply larger absolute falls in sugar consumption for households who are likely to be overconsuming sugar. However, these households are simultaneously more willing to substitute to higher-sugar alternatives that are made relatively cheaper as a result of the levy.
It thus seems plausible that an increase in the higher rate of the SDIL (on products with over 8 g of sugar per 100 ml) may be a more effective way to curb consumption among the consumers with the highest sugar intake, due to the high share of these products in their expenditure basket. We use our model to simulate the effect of an alternative policy, where the government leaves the lower threshold unchanged and continues to exclude milk-based products from the levy, but increases the higher rate. We choose the increase that matches the overall estimated fall in average sugar consumption of 0.32 kcal per day achieved by the actual reforms (assuming products do not reformulate in response to the higher rate increase) – this corresponds to an increase of around 7 p per litre (from 25.9p to 32.7p per litre).
As shown in Figure 9, our results suggest that this policy is far better targeted at households with a high sugar intake – the effect on their calories per day would be 46% higher than the actual reforms (a reduction of 0.62 kcal per day). In contrast, the effect on the households that consume the lowest amount of sugar would be 49% lower (a reduction of 0.1 kcal per day), suggesting the policy would be less distortive for households who are not overconsuming sugar from soft drinks. These results continue to hold if some firms reformulate in response to the increase in the higher rate. This provides suggestive evidence that increasing the relative price of very sugary products could be a more effective way of targeting the purchases of households most at risk of sugar overconsumption.
Figure 9. Change in daily calorie intake due to SDIL changes versus simulated increase in the higher rate, separated by household sugar intake

Source: Authors’ calculations using Worldpanel by Numerator’s GB Take Home Panel, 1 January 2014 to 31 December 2024.
Our model simulations suggest that the effects of the policy changes do not differ substantially across households with and without children. Under the central assumptions on substitution and reformulation, the policy reduces daily calories for households with children (0.33 kcal per day) by a similar amount as households without children (0.31 kcal per day). The counterfactual increase in the higher rate also has essentially symmetric impacts on these groups. This is consistent with the fact that these household types have relatively similar consumption habits, as outlined in Section 2. As discussed there, this does not imply the policy will not be effective in targeting the purchasing behaviour of children outside the home, which is not modelled here.
4. Remaining questions surrounding the SDIL
In this section, we briefly discuss remaining issues surrounding the recent changes to the SDIL and the design of the levy more broadly.
Changes in the uprating of the SDIL
Our analysis thus far focuses on the changes announced at the Autumn 2025 Budget. An additional change was announced at the Autumn 2024 Budget relating to the uprating of the SDIL. The levy was frozen in nominal terms following its introduction, meaning the real value of the tax (accounting for inflation) fell over the period 2018–24, reducing the effectiveness of the policy. Figure 10 shows how the real value of the SDIL was significantly eroded by high inflation in recent years, with the lower and higher rates falling to 14.0p and 18.7p per litre, respectively, by Q1 2025.
In an attempt to restore its real-terms value, the government announced that both rates of the SDIL would be increased by 27% between 2025 and 2029 – to reflect the increase in the Consumer Price Index (CPI) between 2018 and 2024. This increase would be spread equally across the five-year period with a 10p and 13p increase per 10 litres each April to the lower and higher rates, respectively, in addition to CPI over the preceding year.
Uprating the levy with CPI makes sense, and is important to prevent arbitrary changes in the real value of the levy as inflation rises and falls. The proposed implementation of the uprating, however, implies that the real-terms value of the SDIL in 2029 will not recover to its level in 2018. Because the retrospective increase is being gradually applied, the portion of uprating reflecting current inflation will compound from a lower base than if the policy had been uprated each year in the period 2018–24. The higher the average rate of inflation over the next four years, the greater this shortfall will be. Figure 10 plots the real-terms value of the lower and higher SDIL rates using projections from the Office for Budget Responsibility’s March 2026 inflation forecast (Office for Budget Responsibility, 2026). Under these projections, the real value of the lower and higher rates of the SDIL will undershoot their April 2018 values by approximately 0.3p and 0.5p per litre, respectively, leaving the rates in 2018 prices at 17.7p and 23.5p per litre. Should inflation over the period exceed the Office for Budget Responsibility’s forecast, the real-terms erosion of the levy rates would be correspondingly larger.
Figure 10. Actual and projected real-terms values of the higher (yellow) and lower (green) SDIL rates (Q2 2018 prices)
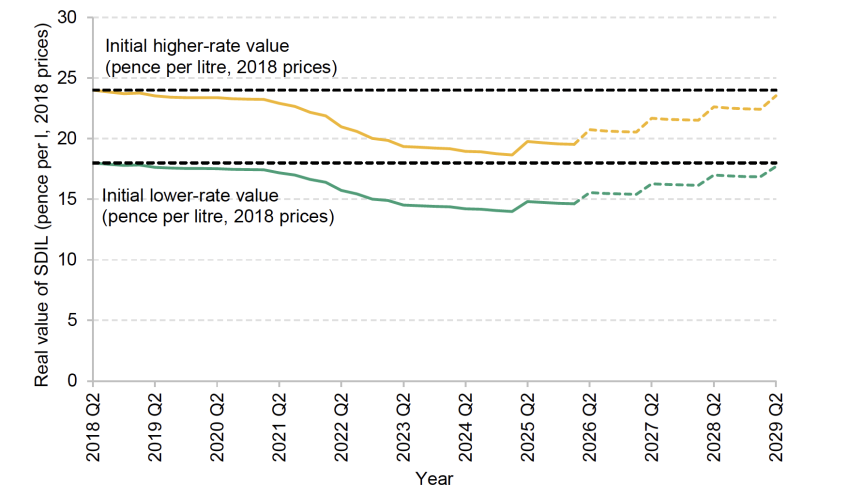
Note: We assume that the SDIL lower and higher rates are uprated each April between 2026 and 2029 inclusive, by 10p and 13p, respectively, plus inflation in the year to April. We use the Office for Budget Responsibility’s inflation forecast to calculate projected changes in nominal and real rates.
Source: Author’s calculations using Office for Budget Responsibility (2026).
Leaving the real value of the SDIL below its value in 2018 may be justifiable, but only if the government has revised its view of the social costs associated with the consumption of soft drinks. However, even if this is the case, the current implementation still ties the precise value in 2029 as a function of how prices change over the next few years, leaving the real value of the tax to be determined by inflation, rather than intention. An alternative option without this undesirable feature, for example, would be to uprate the SDIL rates in line with the CPI plus a fixed percentage, until the desired real-terms values are achieved.
Credibility issues and costs to producers
As discussed in Section 2, a large proportion of products reduced their sugar content in response to the SDIL. Many of these products were reformulated to lie just under the 5 g per 100 ml threshold, perhaps reflecting a trade-off between firms seeking to preserve the taste of their products versus reducing their tax liability. The recent changes to the lower threshold explicitly seek to target these products. However, revising the thresholds forces these firms to reinvest in reformulation. If there are fixed costs associated with reducing the sugar content of drinks, firms who initially reformulated into this band will have to pay these twice. The policy choice to set and then revise thresholds will cause firms to incur higher total adjustment costs, potentially resulting in less reformulation than would have been achieved by originally setting the lower rate at 4.5 g per 100 ml.
More generally, changing thresholds introduces uncertainty into the decision-making of firms, who may not view the new threshold as the credible long-term target on which to base reformulation choices. This is particularly relevant given that the government initially consulted on reducing the threshold to 4 g per 100 ml but relented due to concerns from industry. If firms do not believe the government is committing to this threshold over the longer term, they may choose not to reformulate following the policy.
The structure of the SDIL
Broader questions surrounding the structure of the SDIL remain following the recent policy changes. As discussed previously, the economic rationale for a tax on soft drinks stems from the possibility that individuals do not internalise all the costs of consumption when choosing how many (and which) drinks to consume. In such circumstances, corrective taxes can raise welfare by aligning private incentives with social costs through higher prices. Standard theory implies that the tax should be set to equal the additional uninternalised harm from an extra unit of consumption; see, for example, Pigou (1920). For soft drinks, a natural first approximation is that marginal damage is proportional to a drink’s sugar content, implying a tax that varies continuously with sugar content. The marginal tax per additional gram of sugar could be constant (if each extra gram is equally costly) or increasing (if very high sugar drinks are disproportionately harmful – or if an increasing schedule improves targeting, as suggested in Section 3).
The SDIL did not adopt this structure when it was implemented in 2018, and recent changes have done nothing to change the underlying structure of the tax. The levy deviates from the recommendation of theory in two key ways. First, it is levied per 100 ml of drink rather than by sugar content of the drink (i.e. it is a ‘volumetric’ tax). Second, it has a banded structure, where the magnitude of the levy depends discontinuously on the sugar content of a drink.
Figure 11 shows the structure of the SDIL as a function of the sugar content of the drink. Within bands, the tax per gram of sugar is decreasing in sugar content (because a drink with 7.9 g of sugar per 100 ml will be liable for the same amount of tax as a drink with 4.5 g per 100 ml). The schedule also features discontinuities at the thresholds. This structure is hard to justify on economic grounds – it is unclear why the marginal uninternalised harm from soft drink sugars would take this complicated form.
Figure 11. Structure of the SDIL as a function of sugar content of drink (g per 100 ml)
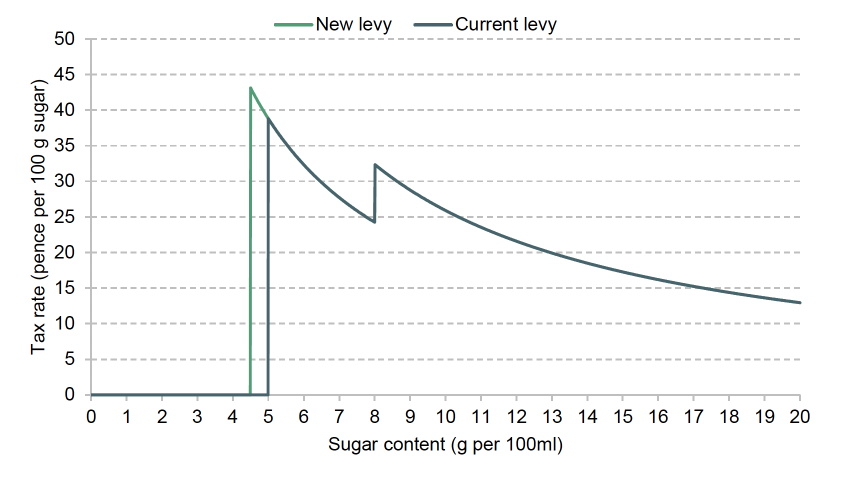
Note: Uprating to the SDIL (discussed in Section 4) is not shown on this chart.
The SDIL thresholds were chosen after extensive discussions with industry on the technological feasibility of reformulation. One argument is that the design creates strong incentives for firms close to a threshold to reformulate in order to avoid the levy. At the same time, it weakens reformulation incentives for firms that are further from the cut-offs. More broadly, even if one wanted to design a levy with thresholds, it is possible to design a schedule such that the marginal rate is not falling within a band (by allowing the volumetric tax rate to increase within a band).
It is worth noting that despite their weak economic basis, volumetric soft drink taxes are the norm internationally, with very few countries adopting taxes that are continuously increasing in sugar content.6 Indeed, levies in other countries are often applied at a flat volumetric rate for drinks containing any sugar. In this context, the design of the SDIL compares more favourably. Nonetheless, in a review of the evidence on soft drink taxes, Allcott, Lockwood and Taubinsky (2019) note that ‘[t]he United Kingdom and several other countries approximate sugar taxes through tiered systems that impose a higher volumetric tax for drinks with higher sugar content, but this still falls short of the ideal of setting taxes proportional to uninternalised harms.’
A broader-based sugar tax?
The government’s stated aims for the SDIL ultimately revolve around overconsumption of sugar and its impacts on obesity, rather than consumption of soft drinks specifically. The analysis in Section 2 suggests that households consume a greater share of their sugars from confectionery (chocolate and sweets). Furthermore, households and children who have a high intake of sugar appear to consume more of that sugar from these categories. This raises the question of the rationale for restricting this tax to soft drinks. A government that wishes to reduce sugar consumption overall may want to introduce a broader-based sugar levy on all products containing added sugar (or extend the scope to cover other categories where overconsumption is likely to be an issue).
The government faces a relatively standard economic trade-off in determining the scope of a sugar tax. A broader tax base limits consumers’ ability to substitute towards untaxed sugary products but is likely to impose costs on consumers who are not overconsuming sugar. A narrower base reduces these costs but leaves more room for substitution to undermine the policy’s effectiveness.7
A further challenge relating to implementation arises if the government were to broaden the tax base while retaining the SDIL’s tiered structure. Choosing the threshold levels for a sugar tax requires knowledge of how sugary the sales of the in-scope products are, and how easy it is for firms to reformulate. This will vary across food categories, implying that separate thresholds would be required for different types of products. Even if the government attempted to design multiple thresholds, firms would likely have an incentive to attempt to reclassify their products to reduce their tax burden (as they do with the zero-rating of VAT). This suggests that a broader-based tiered sugar tax may be challenging to implement in practice.
5. Conclusion
In this report, we evaluate the economic rationale behind the recent changes to the SDIL. The reforms announced at the 2025 Autumn Budget are small changes and are likely to have very small effects on sugar consumption. Such effects as there are will likely be larger for households who consume a lot of sugar, both because they consume more soft drinks, and because a greater share of their purchases are affected by the change in the lower threshold.
However, these households appear to consume a disproportionate amount of very sugary drinks, which are made relatively cheaper by the policy. Our analysis suggests that an increase in the higher rate or the introduction of a third higher-rate threshold for drinks with over 10 g per 100 ml of sugar (which the government initially consulted on but did not pursue) may have greater effects on the sugar consumption of households that have a high sugar intake. The effects of the policy are relatively similar across households with and without children, but the measures may be better targeted at children’s out-of-home consumption.
The recent changes do little to address issues relating to the structure of the levy. Whilst attempts to restore the real value of the levy are welcome, the implementation of the uprating means it is unlikely to be restored to its initial real value. There may be concerns about the credibility of the new thresholds remaining for a long period, which may cause hesitation by firms in reformulating. And, more broadly, the economic case for the current structure of the tax (with tiers for sugary drinks, and no tax for other sugary products) may not be the most effective way to reduce heavy sugar consumption among the households the government most wants to target.
We use data from Worldpanel by Numerator’s GB Take Home Panel. This dataset comprises GB food and drink purchases taken into the home. The data, referred to as ‘the Worldpanel dataset’ in this report, contain product-level unweighted data on purchases by a sample of rounded 30,000 households in Great Britain. All purchases from supermarkets and grocery stores, convenience stores and corner shops, and smaller-scale merchants (e.g. greengrocers) are recorded by households in the data.
For each household transaction, the Worldpanel dataset records the total expenditure and quantity purchased of each product purchased. We also observe detailed product-level nutritional information – in particular, total calories and grams of sugar per 100 ml of drink product. We do not observe the grams of free sugars but use conversion ratios provided by the Department of Health & Social Care at the broad category level to convert sugars to free sugars. The Worldpanel dataset also contains demographic information on sampled households, which we use to construct a dummy for whether there is a child in the household.
The Worldpanel dataset provides access to product-level information, which allows us to identify the specific products that are brought into scope by the extension to milk-based drinks and the reduction in the lower threshold. However, there are some important considerations to note. First, the data measure purchases, rather than consumption. Second, the GB Take Home Panel captures food and drink brought back into the home and does not include out-of-home purchases, data that are available separately from Worldpanel by Numerator’s GB Out of Home panel.
Whilst we have access to the Out of Home data, there are some considerations to be made when interpreting overall expenditure at the household level by summing expenditure across these datasets. This is because in both datasets we observe expenditures by shoppers, with the take-home purchase data using the main shopper to record all purchases for the household and the out-of-home data using individuals to record their individual purchasing. Whilst it is a reasonable approximation to assume that this main shopper does all the grocery shopping for a household, this is less justifiable for out-of-home purchases, which are based on the purchasing of the individual and then grossed up to reflect the population.
This report therefore focuses on purchases of soft drinks recorded via the GB Take Home panel (i.e. soft drinks brought back into the home). To the extent that purchasing patterns of soft drinks differ substantially between take-home and out-of-home purchasing, these results may not reflect the true effects of the policy. As a sense check, in Figure B1 we plot the volume-weighted distribution of total out-of-home soft drink sales in the out-of-home data (before and after the SDIL). We also report out-of-home expenditure shares in each sugar band before and after the introduction of the SDIL, in Table B1. It does appear that, on average, a greater share of purchases are on very sugary products outside of the home, with fewer on very low sugar drinks. Broadly speaking, however, the changes following the SDIL’s introduction appear to be relatively consistent with those in the Take Homedata.
Figure B1. Expenditure-weighted distribution of drink sales by g/sugar per 100 ml before and after original implementation of the SDIL – out-of-home purchases (excluding diet drinks)

Note: Drinks containing no added sugar are not plotted but make up 33% of the out-of-home market for soft drinks over the period. Analysis and interpretation were conducted independently of Worldpanel by Numerator.
Source: Authors’ calculations using Worldpanel by Numerator, GB Out-of-Home Panel, 1st January 2014 to 31st December 2024.
Table B1. The composition of soft drink sales, by household group – out-of-home drinks
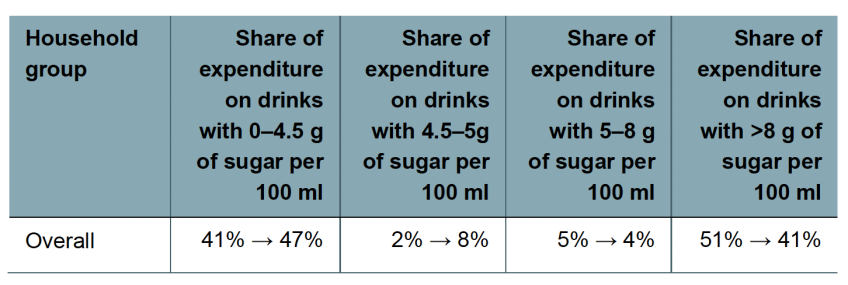
Note: Figures to the left of the arrow reflect pre-SDIL values (January 2014 to April 2018) and figures to the right reflect post-SDIL values (April 2018 to March 2024). Total shares may not equal 100 due to rounding. Analysis and interpretation were conducted independently of Worldpanel by Numerator.
Source: Authors’ calculations using Worldpanel by Numerator, GB Out of Home Panel, 1 January 2014 to 31 December 2024.
Endnotes
Authors

Martin Brogaard
Martin joined the IFS in 2025 and works in the IOD sector, researching consumer behaviour and nutrition. He also works on devolved government policy.

Gautam Vyas
Gautam joined the IFS in 2023 and works in the IOD sector. His work focuses on the consumption behaviour of individuals in the UK.
More from IFS
Understand this issue


Policy analysis


Academic research


