
Downloads

Download the report as a PDF
PDF | 265.5 KB
Key Findings
- Evidence from previous recessions tells us that young people who enter the labour market during downturns tend to experience worse career outcomes that take several years to recover from. In 2020–21, the total number of hours worked by those aged 16–24 dropped by a fifth year-on-year. The loss in working experience and the reduced ability to move up the career ladder during the pandemic, coupled with shocks to mental health, could be expected to leave long-lasting scars on recent graduates.
- The cohort that graduated in 2020, particularly individuals with university degrees, initially saw worse outcomes on some measures. They struggled to find work three to six months after graduation, were less likely to receive on-the-job training in their first year, and those with degrees started in lower-paid occupations than previous cohorts.
- However, the employment rates of the 2020 cohort had fully recovered nine to twelve months after graduation, and one to two years after graduation there were no obvious differences from the previous cohort across a number of job quality measures. It appears that the rapid economic recovery and the boom in new job vacancies since 2021 allowed new entrants to quickly recover lost ground.
- Apart from the 2020 cohort, other cohorts who entered the labour market during or just before the pandemic did not see slower occupational progression or have worse job quality, with one exception: those from disadvantaged backgrounds were more likely to be in the same job that they held at school or university. However, there is, as yet, no indication that this has affected other measures of their job quality.
- It may be that some negative effects of the COVID-19 pandemic are yet to materialise. Gaps between the COVID-19 cohorts and earlier cohorts may emerge as the labour market becomes less tight, as the loss of experience and training they experienced puts them at a disadvantage. Working from home may have affected the quality of on-the-job training and learning, effects that are unlikely to be captured by short-term measures of job quality.
- Perhaps more concerning are the prospects for the next two cohorts of graduates. They will have suffered an incredibly unfortunate double whammy, with disruption during a key phrase of their education due to the pandemic, followed by an economy in recession upon entry into the jobs market. Despite these challenges, strained public finances mean that government support is likely to be sparse.
1. Introduction
There is substantial evidence from the UK and other countries that entering the labour market during a recession leads to persistent negative effects on employment and earnings (von Wachter, 2020). Young people graduating from school or university during an economic downturn have a harder time finding employment, and those who do find work may be forced to take jobs that are less well-suited to their skills and the development of those skills. This can keep them on poorer career trajectories for years to come. The lack of new job vacancies also hampers the ability of young people to move between jobs in search of a better match, which has been shown to be an increasingly important way for young people to advance their careers and increase their pay (Blundell et al., 2020). The disruption caused by recessions leaves persistent scars for new labour market entrants, which can take several years to recover from (Cribb, Hood and Joyce, 2017).
The COVID-19 pandemic was an unprecedented labour market shock. Entire sectors were shut down and, across the economy, firms responded to the huge uncertainty by pausing hiring. This led to a sharp rise in numbers not employed or working zero hours, which was particularly concentrated among younger age groups. The pandemic and lockdowns led to a deterioration in mental health, which again was largest for young people (Banks and Xu, 2020). As a result, in the initial stages of the pandemic, many predicted that young people entering the labour market during the pandemic would see long-lasting scars on their career prospects (see, for example, Del Bono and Holford, 2020; Johnson, 2020). However, the scale of the support package implemented by the UK government and the rapid rebound of the economy as the pandemic subsided may have gone some way toward mitigating – and perhaps reversing – these effects. The unusual nature of the pandemic and subsequent recovery means that it is not obvious what to expect.
In this report, we present the first evidence on how the cohorts of young people who entered the labour market during the pandemic have fared up to now. In Section 2, we discuss why we might expect the pandemic to lead to scarring effects, documenting how labour market outcomes evolved over the pandemic and comparing trends with the 2008 recession to demonstrate the magnitude of the COVID-19 shock for young people. In Section 3, we focus on the cohorts of young people who entered the labour market during the COVID-19 years, or just before, comparing their employment rates and multiple measures of job quality with those of earlier cohorts to assess the extent to which they are likely to experience long-term scarring as result of the pandemic. In Section 4, we discuss the prospects for future cohorts due to enter the labour market in the coming years. We conclude in Section 5.
2. Why might (or might not) the pandemic lead to scarring?
2.1 Loss of work experience
The onset of the pandemic led to a sharp fall in employment and hours worked across the population. As seen in Figure 1, this was particularly the case for young people. Between Q4 2019 and Q2 2020, the share of those aged 16–24 who were unemployed or inactive rose by 3 percentage points (from 45% to 48%), and the share who were employed but working zero hours rose by 13 percentage points, reflecting high take-up of the furlough scheme. The overall increase in the share of young adults working zero hours between Q4 2019 and Q2 2020, including both non-employment and furlough, was nearly double the increase for older adults aged 25–64 over this period (9 percentage points).
This decline in work experience includes a collapse of apprenticeships. Data from the Sutton Trust show that only 40% of the apprenticeships that were operating when the pandemic first hit continued as normal (Doherty and Cullinane, 2020). In the first four months of lockdown, the number of people starting new apprenticeships fell by 45% year-on-year (House of Commons Library, 2021). Given that apprenticeships provide a key pathway to well-paid jobs for those with lower academic qualifications, especially for boys from disadvantaged backgrounds (Cavaglia, McNally and Ventura, 2020), the disruption at the start of the pandemic could be expected to reduce opportunities for those who need them most.
Young people were also disproportionately affected by the second and third lockdowns. In Q4 2020, the share of those aged 16–24 who were not working was 9 percentage points higher than in Q4 2019, compared to 5 percentage points for older adults. For young people, ‘excess’ non-employment in the second and third lockdowns largely reflected an increase in full-time study. This is in contrast to the early stages of the pandemic, when excess non-employment largely reflected unemployment and other forms of inactivity.
Taken together, the pandemic led to a huge fall in hours worked among young people. Across the 2020–21 financial year, those aged 16–24 worked over one billion fewer hours compared with 2019–20, a decline of more than one-fifth. The decline was concentrated among those without university degrees, for whom total hours fell by 25%, compared to 8% for those with university degrees.
Figure 1. Changes in Worklessness over the pandemic, by age group

Note: The figure shows three-month forward-looking averages (e.g. Jan 2020 refers to January–March 2020).
Source: Quarterly Labour Force Survey 2019Q4-2022Q2.
Figure 2 compares the magnitude of the employment shock during the pandemic with that following the 2008 global financial crisis (GFC). It shows that the rise in the share of young people with no job (that is, unemployed and inactive) was slightly smaller over the pandemic than over the course of the global financial crisis (2008–11). However, the rise in the overall share working zero hours was much higher, a result of the huge numbers of young people being furloughed. Whilst furloughed individuals were shielded from unemployment and the related income shocks, they nonetheless missed out on important work experience, training and on-the-job learning. This suggests that the pandemic might lead to ‘scarring’ effects that are comparable to, or perhaps even greater than, those experienced following the global financial crisis.
Figure 2. Share of jobless or those working zero hours, by age group

Note: The figure shows three-month forward-looking averages (e.g. Jan 2020 refers to January–March 2020). Seasonally adjusted using quarter fixed effects. Non-standard quarters in the post-pandemic data are assigned the closest quarter fixed effect (e.g. February–April data are adjusted using the Q1 fixed effect). ‘Has no job’ includes inactive and unemployed. ‘Working zero hours’ includes inactive, unemployed and those in employment but working zero hours in reference week.
Source: Quarterly Labour Force Survey 2004Q1–2022Q2.
2.2 Decline in mental health
On top of time out of work, the detrimental effects of the pandemic on mental health could further amplify scarring effects on young people. Figure 3 shows the dramatic fluctuations in mental health that occurred over the pandemic, following successive lockdowns and isolation from friends and family. The deterioration in mental health over the first and subsequent lockdowns was much more pronounced for young adults than for older adults (though by September 2021, average mental health was in line with the pre-pandemic trend for both younger and older adults). Given that poor mental health is associated with lower productivity, the shocks to young people’s mental health over the pandemic might further affect their subsequent labour market outcomes.
Figure 3. Average mental health (GHQ Likeness; higher score = worse mental health)

Note: Pre-2020 data are two-year averages (e.g. 2009 refers to 2009–10). Post-2020 data are single-month averages.
Source: Understanding Society, Main survey (waves 1–10) and COVID-19 survey (waves 1–9).
2.3 Rapid recovery and boom in job vacancies
One reason for optimism, however, is the speed of the economic recovery that has taken place since the initial shock. Figure 4 shows that whilst the total number of vacancies in the UK dropped by nearly 60% between January–March 2020 and April–June 2020, vacancies recovered to pre-pandemic levels in just one year. This stands in marked contrast to the period following the global financial crisis, when vacancies ran well below pre-2008 levels for many years, and did not fully recover until 2014. Since 2021, the number of job openings has grown to record levels, partly owing to lower net migration from the European Union and older people leaving the workforce over the pandemic (Bank of England, 2022). The boom in job vacancies is likely to have strongly benefited young people in finding better jobs more quickly.
Figure 4. Total vacancies (in thousands)

Note: Single-month estimates.
Source: Office for National Statistics, Vacancy Survey.
Figure 5 indicates that the record growth in vacancies has indeed translated into greater job mobility, especially for young workers who tend to change jobs more frequently than their older counterparts. Whilst job-to-job moves among young people were depressed for years following the global financial crisis, the share of young workers changing employers recovered quickly in late 2020, and exceeded pre-pandemic levels in 2021. The boom in job vacancies may have enabled young people to find better jobs quickly as the economy reopened, thus recovering some of the experience and skills they missed out on in the initial phases of the pandemic and finding a better match. This would contrast with the global financial crisis, when young people were exposed to successive years of low vacancies and job mobility.
Figure 5. Share of workers changing employer each quarter

Note: The figure shows the proportion of individuals employed in two consecutive quarters who change employers. Seasonally adjusted.
Source: Quarterly Labour Force Survey Two-quarter Longitudinal Dataset 2004Q1–2022Q2.
Given the unique set of circumstances surrounding the pandemic, the extent to which we should expect to see scarring of those entering the labour market around 2020 is not obvious. They have suffered from more time out of work than any other cohort in recent history, coupled with periods of particularly poor mental health. Despite this, the labour market recovery has been exceptionally strong, with vacancies at record highs and elevated job-to-job mobility. Brand new policy measures, such as the furlough scheme, offer an added level of complexity, shielding young people from unemployment but not lost work experience or training. In the next section, we focus on the cohorts of young people who entered the labour market around the pandemic, to shed light on what the initial effects on their careers have been and what this could mean for their future.
3. How have new labour market entrants fared so far?
This section documents labour market outcomes across different cohorts of young people, defined by the summer in which they left full-time education. We consider outcomes in the years immediately after their entry into the labour market, asking whether cohorts whose early careers overlapped with the pandemic experienced worse outcomes than the cohorts that came before them. Then we compare how any adverse effects on the COVID-19 cohorts differed from the effects on the cohorts who entered the labour market around the time of the global financial crisis.1
The pandemic hit different cohorts at different stages of their education or labour market careers. For example, the outcomes of the 2018 cohort up to one year after graduation were unaffected by the COVID-19 pandemic, but their outcomes one to two years after graduation fall within the pandemic period. As such, exactly which cohorts we consider, and the ‘pre-pandemic’ cohorts we compare their outcomes to, will depend on the time frame: when looking at outcomes up to one year after graduation, we compare the post-2019 cohorts to the 2018 and earlier cohorts; whereas for outcomes one to two years after graduation, we compare the post-2018 cohorts to the 2017 and earlier cohorts, and so on.
3.1 Education
Before turning to labour market outcomes, it is worth noting that the COVID-19 pandemic has also affected trends in education for young people. This is important in and of itself, and also because it changes the composition of young people entering the labour market over these years, which in turn affects their labour market outcomes. In Figure 6, we see that the share of those aged 18 in full-time education rose noticeably over the pandemic, and to some extent the share of those aged 17, consistent with more students staying in school or enrolling in undergraduate degrees. There does not seem to be a big effect on postgraduate education, with the shares in full-time education roughly unchanged for individuals aged 21 or older. A similar increase in young people staying in further or higher education was seen during the period of the global financial crisis, as shown in the right panel of Figure 6.
Figure 6. Share in full-time education at different ages, during the COVID-19 pandemic (left panel) and the global financial crisis (right panel)

Note: Year refers to school year ending in that year. School year runs from Q3 of the previous year to Q2 of the year given (e.g. 2019 is the 2018 Q3–2019 Q2 school year).
Source: Quarterly Labour Force Survey 2006Q3–2022Q2.
It is not obvious how the composition of graduates should change during recessions – that is, whether it is the more able, or less able, students who choose to stay on in education and delay graduation in hope of a healthier labour market in a few years’ time. However, it is likely that the direction of the effect is similar across recessions. So, the cohorts entering the labour market following the global financial crisis are likely to be a useful comparison for the 2020 and 2021 cohorts when trying to understand how the COVID-19 pandemic has differed from previous recessions. For additional robustness, in the Appendix, we plot each chart on labour market outcomes separately for individuals with and without university degrees. As implied by Figure 6, the composition of those with degrees is unlikely to be affected by the pandemic (we see little effect on those remaining in postgraduate education – and those who remained in education at ages 17 and 18 as result of the pandemic will not yet have entered the labour market).
3.2 Employment
We begin by looking at whether cohorts that entered the labour market in and around the pandemic were able to find jobs soon after graduating. Being employed allows young workers to develop their skills, as well as sending a positive signal to future employers. Long spells of unemployment may have the opposite effect, as workers’ skills depreciate and employers worry about the individual’s productivity.
Figure 7 plots the share of young adults in each cohort who were in paid work three to six months, nine to twelve months and one to two years after graduating. For the cohort who entered the labour market in 2020, we find that only 58% were employed three to six months after graduating, which is 9 percentage points lower than for the 2019 cohort, whose first six months preceded the pandemic. This is the biggest fall for consecutive cohorts in recent history, larger than any seen following the global financial crisis. Figure A.2 in the Appendix, which plots employment rates separately by degree status, shows that the drop is driven predominantly by lower employment rates among graduates with university degrees (as discussed earlier, the composition of this group is unlikely to be affected by changes in education trends over the pandemic).
But remarkably, just half a year later, there seems to have been a complete recovery. The share of the 2020 cohort employed nine to twelve months after graduating was 68%, an increase of 10 percentage points on the 3–6 month rate and about the same as the 9–12 month rate for the 2018 cohort, whose one-year outcomes were unaffected by the pandemic. The same is true when looking at outcomes after one to two years, where the 2020 cohort does not look much different to the cohorts that preceded it.
2021 graduates have fared even better, with employment rates surpassing those of earlier cohorts. In their first three to six months after graduating, 67% were in paid work, which is similar to pre-pandemic cohorts. After nine to twelve months, 74% of the 2021 cohort were in employment, surpassing the 9–12 month employment rates of the 2018 and earlier cohorts. Therefore, it appears that the initial shock to employment rates was quickly reversed as the economy reopened and job vacancies surged.
The quick recovery is in stark contrast with the experience of cohorts graduating just before and following the global financial crisis. Figure 7 shows that employment rates three to six months after graduating were significantly depressed for the 2009, 2010 and 2011 cohorts. These cohorts, as well as the 2007 and 2008 cohorts whose early careers overlapped with the recession, saw lower employment rates up to one to two years after graduating, compared with the pre-2007 cohorts.
Figure 7. Employment rates by graduation cohort

Note: Cohort is estimated using individual’s age and the age at which they completed education. Graduation refers to leaving school or university. Not shown on the chart: the 9–12 month employment rate for the 2008 cohort was 1 percentage point lower than the 3–6 month employment rate.
Source: Quarterly Labour Force Survey 2004Q1–2022Q2.
3.3 Job quality and progression
Whilst negative effects on overall employment rates were limited to the 2020 cohort and short-lived, this does not preclude changes in job quality or early career progression as a result of the pandemic. Evidence from previous recessions suggests that cohorts entering the labour market when the economy is weak tend to find lower-quality jobs or jobs that are poorly suited to their skills, which hinders their subsequent career development (see von Wachter, 2020, for a summary). In this subsection, we explore whether the pandemic changed the quality of jobs that new graduates get, measured in a number of ways.
As a first proxy for job quality, we consider the worker’s occupation. To compare and rank occupations on a continuous scale, we use the median hourly wage associated with that occupation in 20152 (note that actual wages during the pandemic were affected by the furlough scheme, and therefore not particularly informative of job quality). Figure 8 shows how occupational quality, proxied by the median pay level of that occupation, evolved for each cohort in each of the first four years since leaving education. The lightest-coloured dots, which show outcomes over the first year, offer a measure of initial job quality by graduation cohort. The dispersion in the dots for a given cohort – the distance between the lighter and darker dots – offers a measure of career progression over the first four years. For each cohort, we circle in yellow the years that are affected by either the global financial crisis or the COVID-19 pandemic (for example, the 3–4 year outcomes of the cohort graduating in 2004 fall within the period of the global financial crisis, as do the 2–3 and 3–4 year outcomes of the 2005 cohort, and so on).
Starting with outcomes less than one year after graduating – the lightest dots – we do not see an obvious drop in median occupation pay for the 2019, 2020 and 2021 cohorts, suggesting that the initial occupations found by these graduates were not of poorer quality (on this measure) than those found by pre-pandemic cohorts. Figure A.4 in the Appendix shows that there was a small decline in initial occupation-level pay among those with university degrees – as discussed in more detail below, this had recovered by one to two years after graduation. This is a very different story to the global financial crisis, where we see a noticeable decline in initial occupation-level pay for successive cohorts from 2008. Indeed, initial occupation-level pay does not return to the pre-global financial crisis level until 2013.
Figure 8. Median occupation-level pay by cohort, up to four years after graduation

Note: Median occupation wage based on 2015 median wage for four-digit occupation code and expressed in 2015 prices. Yellow border indicates recession year (2007–11 and 2019–22).
Source: Quarterly Labour Force Survey 2004Q1–2022Q2; Annual Survey of Hours and Earnings (ASHE), 2015.
Figure 8 also shows that young people who entered the labour market during the global financial crisis experienced slower occupational progression. This is most clearly seen when comparing the increase in occupation-level pay in the first four years for the 2007 cohort, who spent their early careers in recession, with that of the 2004 cohort, whose first four years largely preceded the recession. Outcomes for the 2007 cohort are much more compressed: the occupations that this cohort were in three to four years after graduating paid just £0.90 more on average than their initial occupations, compared to £1.80 for the 2004 cohort. Figure 8 also shows that despite starting in successively higher-paid occupations, the occupations of the 2005 and 2006 cohorts three to four years after graduation were no better paid than those of the 2004 cohort – again indicating a lack of occupational progression over the global financial crisis.
Although we have fewer years of observations for the cohorts entering the labour market around the pandemic, there is no evidence that their occupational progression has been affected in the same way. The increase in occupation-level pay in the first year after graduating (that is, the difference between the 0–1 year and 1–2 year outcomes) for the 2018, 2019 and 2020 cohorts is similar to many other pre-pandemic cohorts since 2013. Figure A.4 in the Appendix shows results separately for those with and without university degrees. There is no evidence of slower progression between 0–1 and 1–2 years after graduation for any group, and those with university degrees in the 2020 cohort – who had poorer outcomes 0–1 years after graduation – had made up for lost ground 1–2 years after graduation. Occupation-level pay 2–3 years and 3–4 years after graduating for the cohorts who entered the labour market just before the pandemic were high by historical standards.
We expand our analysis to other measures of job quality, beyond this simple measure of occupation-level pay. Figure 9 considers a number of proxies for job quality up to one year after graduating and plots how these have changed across cohorts. The measures include the share of young people: who work in a professional job; who work for large firms (which tend to offer better career prospects; see Arellano-Bover (2022)); who receive on-the-job training; who have a full-time, permanent job; and who work in a different job than the job they held during school or university. In Figure A.5 in the Appendix, we plot the same series one to two years after leaving education, which shows very similar trends.
Figure 9 shows that during the global financial crisis, there was a sharp fall in the share of new labour market entrants working in a full-time and permanent job, as well as those working in a different job than the one they held at school or university. 62% of the 2006 cohort had a full-time, permanent job and 75% had a different job from school or university; for the 2009 cohort, the figures were 52% and 65%, respectively. There was also a fall in the share receiving on-the-job training immediately, from 39% in the 2006 cohort (and earlier cohorts) to 36% in the 2009 cohort. Figure A.6 in the Appendix shows that these declines in job quality occurred for both young workers with university degrees and those without. It also shows that the share of labour market entrants with university degrees who were in professional jobs fell over the period of the global financial crisis, though this was compensated for, in aggregate statistics, by a rising share of labour market entrants with degrees.
Figure 9. Job quality measures by graduation cohort, up to one year after leaving full-time education

Note: An individual is considered to be in a different job if their current tenure is less than the amount of time since graduation (calculated at three-month intervals). Professional jobs include those in major occupation groups 1 and 2. A large firm is defined as one with at least 250 employees.
Source: Quarterly Labour Force Survey 2004Q1–2022Q2.
In comparison, the cohorts entering the labour market during the COVID-19 pandemic did not generally see a corresponding decline in job quality. The 2019 and 2020 cohorts were less likely than previous cohorts to have changed jobs since school or university both 0–1 and 1–2 years (Figure A.5) after graduating. But aside from this one measure, there were no other obvious differences in job quality. The share of the 2020 cohort receiving on-the-job training was slightly lower than previous cohorts, though the difference is small, and Figure A.5 in the Appendix shows that the share of this cohort receiving on-the-job training one to two years after graduation was no lower than pre-pandemic cohorts.3 The 2021 cohort did not fare worse than pre-pandemic cohorts on any of the job quality measures considered.
Although changes in job quality seem muted at the aggregate level, this could be masking varying effects on individuals, depending on their socio-economic status. Previous research suggests that young workers’ parents are an important determinant of their first job after graduation (Kramarz and Skans, 2014). Over the pandemic, the role of social networks may have grown as traditional hiring processes were paused and work placements were cancelled,4 which could have widened the pre-existing gap between those from high and low socio-economic backgrounds.
We examine whether changes in job quality vary by parental background in Figure 10, which plots each of the job quality measures discussed above, for up to one year after graduating, calculated separately by whether an individual’s parents worked in a high-skilled occupation during their childhood. Because data on parental background are only available in the third quarter of each year, we pool the 2017–18 cohorts (pre-pandemic) and 2019–20 cohorts (post-pandemic) and compare the change in average job quality between the two periods.
Figure 10. Change in job quality measures, 2019–20 cohorts versus 2017–18 cohorts, by parents’ occupation skill level

Note: The figure shows the percentage point change for the first five measures, comparing 2017–18 and 2019–20 cohorts. Change in median occupation pay (in £) is shown on the right-hand axis. Error bars indicate 95% confidence intervals. High-skilled parents based on main wage earner’s occupation at age 14.
Source: Quarterly Labour Force Survey.
For the most part, we do not find statistically significant changes in job quality for either group, implying little difference by socio-economic background. The exception is the share working in a different job to that held prior to graduation, where we see a large and significant decline for those from low socio-economic backgrounds, but not for those from high socio-economic backgrounds. In Figure A.7 in the Appendix, we show that for both degree holders and those without university degrees, the share with different jobs fell only for graduates from low socio-economic backgrounds – that is, the difference does not simply reflect larger falls among low-skilled young people, who are more likely to have low-skilled parents. This is consistent with social ties being more important for finding jobs at the height of the pandemic – however, it does not appear that this difference has led to gaps in any other measures of job quality.
In short, despite the huge shock to labour markets in 2020 and early 2021, the cohorts of young people entering the labour market during the pandemic do not seem to have experienced persistent negative effects – at least, no obvious effects that we can detect in the data thus far. Effects on employment rates were limited to the 2020 cohort, and even there they were very short-lived, recovering to pre-pandemic levels nine to twelve months after graduation. In contrast to cohorts graduating into the global financial crisis, the COVID-19 cohorts do not appear to have started out in lower-quality occupations, as proxied by occupation-level pay, and do not seem to have experienced slower occupational progression on this measure. Nor do we see any changes in job quality across a host of measures, with one exception: new entrants from lower socio-economic backgrounds were less likely to be in a different job from the one they held at school or university. This difference does not seem to have led to gaps in any other measures of job quality, and so it is not clear that we should expect this to lead to slower career progression down the line.
4. Prospects for future cohorts of labour market entrants
The cohorts of young people who entered the labour market over the pandemic do not appear to bear scars in terms of overall employment rates, job quality or career progression so far. However, this does not mean that the outlook is rosy for young people. Of more significant concern might be those young adults leaving education in the next few years, who are about to enter into one of the deepest downturns on record. Real household disposable incomes are set to fall by 4.3% this fiscal year (2022–23), the largest fall since records began in 1948, followed by the second largest fall on record in the next fiscal year (Office for Budget Responsibility, 2022). High levels of vacancies – which boosted career prospects for the COVID-19 cohorts – are already starting to cool, especially in the private sector (Thwaites, 2022). Given forecasts of a prolonged recession, it seems as though the labour market that the next few cohorts of graduates will enter will look more like the one faced by post-2008 cohorts than that faced by the COVID-19 cohorts.
The next cohorts of labour market entrants must also contend with huge disruption to the final years of their education. Assessment data from the first half of the 2021–22 autumn term showed that secondary school pupils were, on average, 2.4 months behind where they would have been expected to be in reading (Renaissance Learning and Education Policy Institute, 2022), with larger losses among disadvantaged pupils. The pandemic also led to disruptions for university students, with courses moved online, internships cancelled and students moving back home with their parents for long periods of time.
This double whammy of disrupted education and recession is likely to disadvantage the next few cohorts entering the labour market. For example, someone born in 2005 would have spent the last three years of secondary school in the pandemic, accumulating learning losses, and could leave education in 2023 in the middle of a recession. Someone who started a three-year university course in 2020 would have done the first half of their degree online, with few internship opportunities, and will enter a labour market in recession with less academic and work experience than neighbouring cohorts.
In spite of all this, government support is likely to be sparse. Strained public finances, partly a result of huge spending to protect individuals over the pandemic, mean that, in the near term, growth in spending will be slow and taxes will rise. This combination of factors suggests that the challenge for these cohorts could be very great indeed.
5. Conclusions
We now have at least a year’s data for the cohorts who graduated in and around the pandemic, which we can use to assess the impact of the pandemic on the outcomes of labour market entrants. Despite the unprecedented shock to young people’s employment, hours worked and mental health in 2020 and early 2021, we find no compelling evidence of persistent negative effects at this stage. This is striking in light of evidence from previous recessions, which shows that cohorts graduating into recessions experience depressed employment rates and lower job quality for years to come. However, it seems that the rapid economic recovery and the boom in job vacancies as the economy reopened have so far shielded the COVID-19 cohorts from persistently poorer outcomes.
The optimism of our finding is in accordance with studies carried out in other countries (see, for example, Forsythe (2022) on the US and Bussink, Vervliet and ter Weel (2022) on the Netherlands). Still, the fact that we do not observe significant harm for the COVID-19 cohorts does not mean that they will be unaffected throughout their careers. It is possible that gaps in outcomes between these cohorts and earlier cohorts will emerge over the next few years as the labour market becomes less tight, if the relative lack of work experience and training of the COVID-19 cohorts puts them at a disadvantage relative to other cohorts. A significant unknown is the impact of working from home on productivity, on-the-job learning and social networks, effects that are unlikely to be captured by our short-term job quality measures but could affect longer-term career progression. It is also worth noting that young people’s earnings were stagnating even before the pandemic (Cribb, 2019) – it is to this low baseline that the COVID-19 cohorts are compared.
Perhaps more concerning still are the prospects for the next few cohorts of graduates, who are set to enter the labour market in a prolonged recession – one that looks more like the global financial crisis than the pandemic boomerang. High levels of vacancies, which shielded the COVID-19 cohorts from negative impacts, are already beginning to fall. There are people who will have suffered an incredibly unfortunate double whammy, with severe disruption during a key phrase of their education due to the pandemic, followed by an economy in recession upon completion of their education and entry into the labour market. Despite these challenges, strained public finances mean that government support is likely to be sparse. The combination of these factors suggests that the outlook for future cohorts may be very challenging indeed.
Appendix
Figure A.1. Share in full-time education by age

Note: Plotted for each school year (Q3–Q2, labelled with end year).
Source: Quarterly Labour Force Survey 2004Q1–2022Q2.
Figure A.2. Employment rates by graduation year and degree status
Has a degree

Does not have a degree

Note: Cohort is estimated using individual’s age and the age at which they completed education.
Source: Quarterly Labour Force Survey 2004Q1–2022Q2.
Figure A.3. Wage relative to median for each four-digit occupation code, 2019 versus 2004
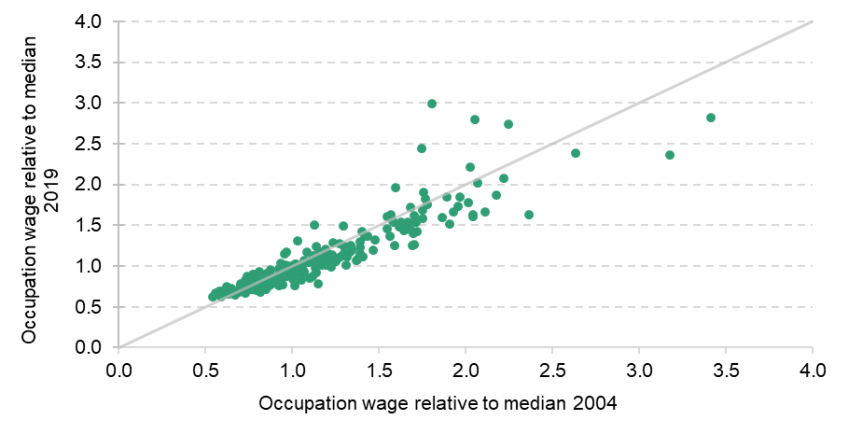
Note: Only includes those codes that feature in the 2000 and 2010 occupation codes.
Source: ASHE, 2004, 2019.
Figure A.4. Median occupation-level pay by cohort, up to four years after graduation
(a) Has a degree
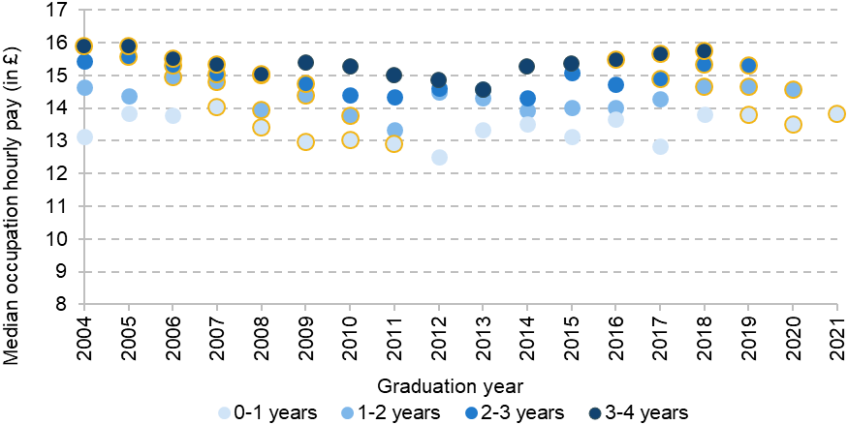
(b) Does not have a degree

Note: Median occupation wage based on 2015 median wage for four-digit occupation code. Yellow border indicates recession year (2008–11 and 2020–22).
Source: Quarterly Labour Force Survey 2004Q1–2022Q2; ASHE, 2015.
Figure A.5. Job quality measures by graduation cohort, one to two years after leaving full-time education

Note: Individuals are considered to be in a different job if their current tenure is less than the amount of time since graduation (calculated at three-month intervals). Skilled job based on Registrar General’s social class. A large firm is defined as one with at least 250 employees.
Source: Quarterly Labour Force Survey 2004Q1–2022Q2.
Figure A.6. Job quality measures by graduation cohort, up to one year after leaving full-time education
(a) Has a degree

(b) Does not have a degree

Note: Individuals are considered to be in a different job if their current tenure is less than the amount of time since graduation (calculated at three-month intervals). Skilled job based on Registrar General’s social class. A large firm is defined as one with at least 250 employees.
Source: Quarterly Labour Force Survey 2004Q1–2022Q2.
Figure A.7. Percentage point change in share that have a different job since graduating, 2019–20 cohorts versus 2017–18 cohorts, by parents’ occupation skill level

Note: The figure shows the percentage point change, comparing 2017–18 and 2019–20 cohorts. Error bars indicate 95% confidence intervals. High-skilled parents based on main wage earner’s occupation at age 14.
Source: Quarterly Labour Force Survey, Quarter 3.
References
Arellano-Bover, J., 2022. Career consequences of firm heterogeneity for young workers: first job and firm size, Journal of Labor Economics, forthcoming, https://doi.org/10.1086/723500.
Bank of England, 2022. Monetary Policy Report – August 2022, https://www.bankofengland.co.uk/monetary-policy-report/2022/august-2022.
Banks, J. and Xu, X., 2020. The mental health effects of the first two months of lockdown during the COVID-19 pandemic in the UK, Fiscal Studies, 41, 685–708, https://doi.org/10.1111/1475-5890.12239.
Blundell, R., Costa Dias, M., Joyce, R. and Norris Keiller, A., 2020. What has been happening to career progression?, Institute for Fiscal Studies, Briefing Note BN301, https://doi.org/10.1920/BN.IFS.2020.BN0301.
Bussink, H., Vervliet, T. and ter Weel, B., 2022. The short-term effect of the COVID-19 crisis on employment probabilities of labour-market entrants in the Netherlands, De Economist, 170, 279–303, https://doi.org/10.1007/s10645-022-09406-8.
Cavaglia, C., McNally, S. and Ventura, G., 2020. Do apprenticeships pay? Evidence for England, Oxford Bulletin of Economics and Statistics, 82, 1094–134, https://doi.org/10.1111/obes.12363.
Cribb, J., 2019. Intergenerational differences in income and wealth: evidence from Britain, Fiscal Studies, 40, 275–99, https://doi.org/10.1111/1475-5890.12202.
Cribb, J., Hood, A. and Joyce, R., 2017. Entering the labour market in a weak economy: scarring and insurance, Institute for Fiscal Studies, Working Paper W17/27, https://doi.org/10.1920/wp.ifs.2017.W1727.
Del Bono, E. and Holford, A., 2020. What are the prospects for young people joining the labour market now?, Economics Observatory, https://www.economicsobservatory.com/what-are-prospects-young-people-joining-labour-market-now.
Doherty, K. and Cullinane, C., 2020. COVID-19 and social mobility impact brief #3: apprenticeships, Sutton Trust Research Brief, Sutton Trust, London, https://www.suttontrust.com/wp-content/uploads/2020/05/Covid-19-Impacts-Apprenticeships.pdf.
Forsythe, E., 2022. Youth hiring and labour market tightness, http://publish.illinois.edu/elizaforsythe/files/2022/01/hiring_tightness_covid_forsythe2022.pdf.
House of Commons Library, 2021. Apprenticeship statistics, Briefing Paper 06113, House of Commons Library, UK Parliament, London, https://researchbriefings.files.parliament.uk/documents/SN06113/SN06113.pdf.
Johnson, P., 2020. A bad time to graduate, Institute for Fiscal Studies, Comment, https://ifs.org.uk/articles/bad-time-graduate.
Kramarz, F. and Skans, O., 2014. When strong ties are strong: networks and youth labour market entry, Review of Economic Studies, 81, 1164–200, https://doi.org/10.1093/restud/rdt049.
Office for Budget Responsibility, 2022. Economic and fiscal outlook – November 2022, https://obr.uk/efo/economic-and-fiscal-outlook-november-2022/.
Renaissance Learning and Education Policy Institute, 2022. Understanding progress in the 2020 to 2021 academic year: extension report covering the first half of the autumn term 2021 to 2022, https://www.gov.uk/government/publications/pupils-progress-in-the-2020-to-2022-academic-years.
Thwaites, G., 2022. Pay growth gap adds to staffing crisis in the public sector, Resolution Foundation, https://www.resolutionfoundation.org/comment/pay-growth-gap-adds-to-staffing-crisis-in-the-public-sector/.
von Wachter, T., 2020. The persistent effects of initial labor market conditions for young adults and their sources, Journal of Economic Perspectives, 34 (4), 168–94, https://doi.org/10.1257/jep.34.4.168.
Endnotes
Authors

Sam Ray-Chaudhuri
Sam joined the IFS in 2022 and works as a research economist in the Income, Work and Welfare sector.

Xiaowei Xu
Xiaowei joined the IFS in 2018 and works in the Income, Work and Welfare sector.
More from IFS
Understand this issue


Policy analysis


Academic research


