This morning the Office for National Statistics announced that inflation in the year to September was 3.0%. Normally the September inflation figure is used to uprate benefit levels and tax thresholds the following April. However, current government policy is to freeze most working-age benefits in cash terms until March 2020. Combined with the latest inflation forecasts, today’s number means that the 4-year freeze is now expected to reduce entitlements in 2019–20 by an average of £450 per year for the 10.5 million households affected (saving the Exchequer £4.6bn). When the policy was first announced, the expected average loss among the losing households was £320 per year (saving the Exchequer £3.4bn). The £130 difference is because inflation over the 4 years is now expected to come in higher than was anticipated at the time. For the same reason the Conservative commitment to a £12,500 personal allowance is less of a giveaway than expected when it was announced: £12,500 of income tax-free cash will not go as far given higher prices. This illustrates a problem with setting benefit rates and tax thresholds in cash terms several years in advance – unexpected movements in inflation will cause the generosity of the tax and benefit system to differ from what the government intended.
Usual practice is for tax thresholds and benefit rates to be uprated each April in line with the previous September’s inflation rate. However, the government’s benefits freeze means that most working-age benefit rates will be unchanged in cash terms between April 2015 and March 2020. The Conservative Party manifesto committed to a £12,500 income tax personal allowance and a £50,000 higher rate threshold by 2020, regardless of what happens to inflation. In other words, when inflation proves higher or lower than expected, the real value of benefits and income tax thresholds also changes. This observation discusses the consequences.
The government announced the benefits freeze – which affects most working-age benefits other than disability benefits – in Summer Budget 2015. The first two years of the freeze have only reduced the real value of affected benefits by 1.0% in total, as inflation has been low. However, inflation has since risen as the depreciation of sterling in the wake of the EU referendum result feeds through into higher consumer prices. Today’s inflation number, together with the Bank of England’s latest forecast for what inflation will be next September, indicate that the next two years of the freeze will represent a further 5.7% real reduction. Hence, taking the 4-years as a whole, the freeze is now expected to reduce the real value of benefits by 6.7%.
By the end of this 4-year benefits freeze in 2019–20, it will have reduced benefit entitlements by £4.6 billion per year, resulting in entitlements being on average £450 lower than they would otherwise have been for around 10.5 million households. Figure 1 shows how these losses are spread across the income distribution (which includes households unaffected by the freeze). Not surprisingly, the largest impact is toward the bottom of the distribution, where households are more dependent upon benefits for their income. Some small losses are seen even in the highest income deciles, largely because the freeze includes child benefit, which is available to many higher income households. Excluding households who only lose out from the cut to child benefit, 7.5 million households are affected, losing an average of £590 per year.
Figure 1. Distributional impact of the benefits freezebetween 2015-16 and 2019-20
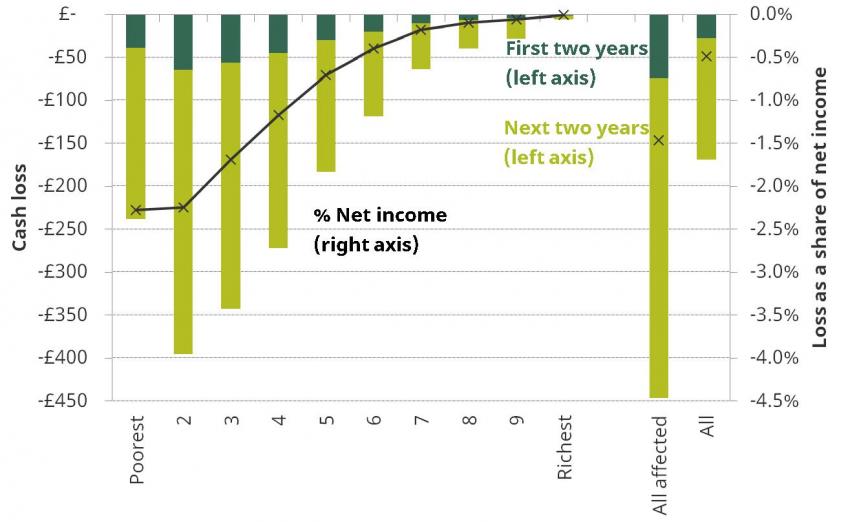
Notes: Assumes full take-up of means-tested benefits and tax credits, and that all claimants are unaffected by the changes made in April 2017 for new benefit claimants. The figure shows the average effect of the policy across all households in each decile, including those unaffected by the reform.
Source: Authors’ calculations and the IFS tax and benefit model, TAXBEN, using data from Family Resources Survey, 2015–16.
The 2015 and 2017 Conservative manifestos included commitments to increase the income tax personal allowance and higher rate threshold (HRT) – both normally uprated with inflation – to £12,500 and £50,000 respectively by 2020–21 at the latest. Because these are cash terms targets, this is a less generous (and less expensive) commitment the higher inflation turns out to be – that £12,500 of income-tax free cash will not go as far if prices have risen faster in the meantime. Had the personal allowance simply been uprated as usual in line with inflation since 2016, it would, on current inflation forecasts, have reached £11,580 by 2020–21. Relative to that, the increase to £12,500 would save a basic rate taxpayer £184 per year. However, much of the progress towards £12,500 has already been made: in 2017–18, the personal allowance stands at £11,500, and the higher-than-expected inflation that we have seen over the past year, combined with higher expected future inflation, means that continuing to increase the personal allowance in line with inflation from now on would be expected to leave it at £12,430 in 2020–21. In other words, the commitment to £12,500 in 2020–21 would represent a further giveaway of only £14 per year for most basic rate taxpayers. (That said, because 29 million individuals would gain, even this small giveaway would still cost the government £0.5 billion a year.)
The commitment to a £50,000 higher-rate threshold (HRT) would cost the government a similar amount to the personal allowance rise, but with larger gains going to far fewer individuals. Increasing the HRT in line with inflation from now on would leave it at £48,610 in 2020–21, meaning an increase to £50,000 would save over 4 million higher rate taxpayers £139 per year. Individuals who benefit from the increase in the HRT are in the highest income 8% of adults, and 85% of the gains would go to households in the top fifth of the income distribution.
The benefits freeze and income tax policies are both examples of the practice of setting tax thresholds and benefit rates in cash terms many years in advance, regardless of what inflation in the intervening years turns out to be. The same habit can be seen in the (disintegrating) public sector pay cap, which was to limit increases in public sector pay scales to 1% for four years. This approach to policymaking means that, when what actually happens to inflation differs from what was forecast, the real changes in taxes and benefits also differ – sometimes substantially – from what the government initially intended. It is worth remembering that there are also income tax thresholds for which the policy is to freeze them permanently, implying that their real value will typically fall every year, such as the £100,000 point at which the personal allowance begins to be withdrawn and the £150,000 point at which the 45% rate becomes payable. The £50,000 point at which child benefit starts to be withdrawn is another example of this unwelcome practice.
Figure 2A plots the total fall in the real value of affected benefit rates over the four years of the benefits freeze, on the basis of the outturns and forecasts for inflation at each fiscal event since the policy was first announced. Figure 2B shows the gain for a basic rate taxpayer that the increase in the personal allowance to £12,500 in 2020–21 represents, relative to simply uprating the 2015 personal allowance in line with inflation. As the figures make clear, the expected sizes of the benefit takeaway and personal allowance giveaway have changed over time. When announced, the benefit freeze was expected to reduce the real value of affected benefits by 4.8% in total over the 4 years. At the same time, the raising of the personal allowance to £12,500 was expected to deliver a saving to basic rate taxpayers of £232 per year in 2020–21. Since sterling’s devaluation in the latter half of 2016, inflation and inflation expectations have sharply increased. This means that the benefits freeze is now expected to entail a 6.7% total cut in the real value of affected benefits, and the gain to basic rate taxpayers from a £12,500 personal allowance – relative to a 2015 allowance uprated with inflation – has been reduced to £184 in 2020–21.
While reasonable arguments can always be made about how high benefits or tax thresholds should be – and what path should be taken to get them there – it is difficult to see why their real values should be buffeted around by unexpected moves in inflation. But this is the inevitable result of setting policies in cash terms several years into the future: the government is allowing the future generosity of the tax and benefits system to different groups to be impacted not only by its deliberate choices, but also on the roll of the dice that is how inflation outturns differ from forecast. It would be a good habit to kick.
Figure 2A. Real change in the value of benefits from the 4-year benefit freeze implied by successive inflation forecasts
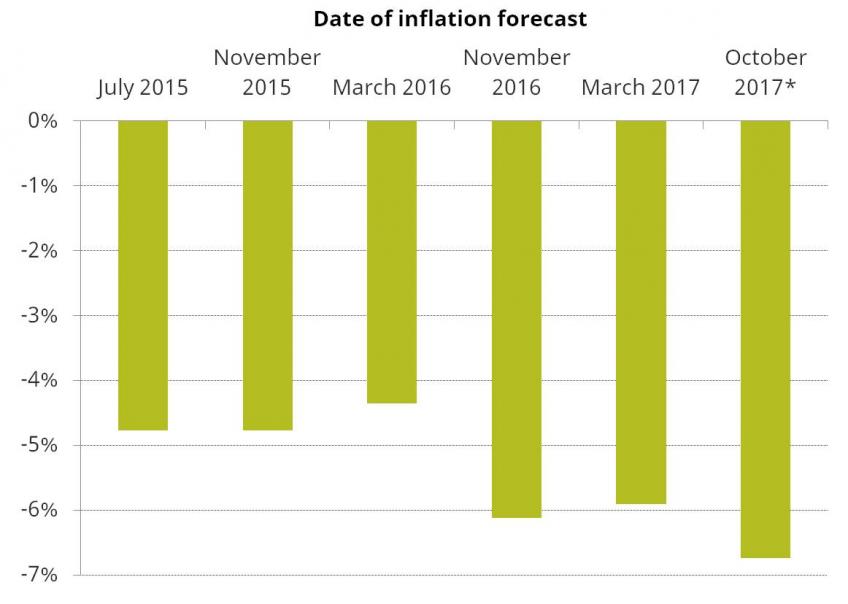
Figure 2B. Gain for a basic rate taxpayer from raising the personal allowance from £10,600 in 2015 to £12,500 in 2020 implied by successive inflation forecasts
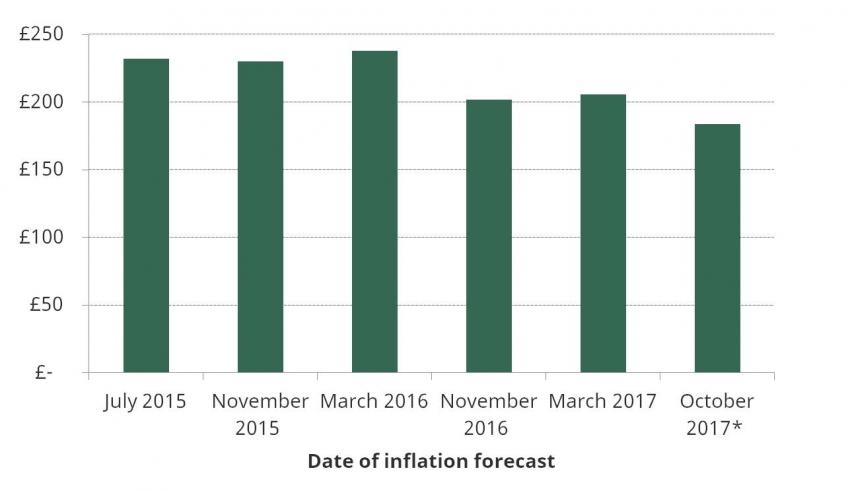
*The October 2017 values are based upon the Bank of England’s latest forecast for inflation.
Notes: With the exception of October 2017, values are based upon the OBR’s inflation forecast at the fiscal event in question.
Sources: Office for Budget Responsibility, Economic and Fiscal Outlook, various editions.
Bank of England, Inflation Report, August 2017
Tom Waters, IFS research economist and one of the authors of the report, said:
“This morning’s inflation figure, taken together with the latest inflation forecasts, means that the 4-year freeze on most working-age benefits is now expected to cut the benefits of 10 million families by £450 a year in real terms – up from £320 back when the freeze was first announced. The extra £130 loss is not the result of any deliberate decision by the government – it is the consequence of inflation being higher than was expected when the policy was set. This illustrates a problem of setting benefit rates far in advance in cash terms – it leaves the actual generosity of future benefits sensitive not only to the government’s active decisions but also to unexpected moves in inflation. It means that the risk of higher inflation – a risk that has now materialised – is being borne by working age benefit recipients.”


