
Downloads
This briefing note provides background material for the 2017 general election.
Under current plans, the share of national income raised in taxes is set to reach its highest level since the early 1980s by 2019–20. Almost two-thirds of revenues come from the three workhorse taxes: income tax, National Insurance contributions (NICs) and VAT. This was true in 2010 and is forecast to be true in five years’ time. But this relative stability masks important changes in the composition of revenues. For example, income tax is due to raise a lower share of total taxes and come more from the top 1% of income tax payers. The taxman is set to raise less from fuel duties. Revenues are now more reliant on smaller taxes. This, in part, results from the Conservatives’ 2015 manifesto pledge to introduce a ‘tax lock’ prohibiting any increase in the rates of income tax or NICs or the rates or scope of VAT. Regardless of whether one wants taxes overall to be cut, this is a bad policy and should not be repeated in any of the upcoming manifestos.
1. Tax revenues: where does the money come from?
Tax receipts to reach highest share of national income since 1980s
Total tax receipts in 2017–18 are forecast to be £690 billion. Receipts have recovered their pre-recession share of national income and, on current policy, are set to rise slightly as a share of national income between now and 2019–20 and then remain relatively flat until the end of the forecast horizon (Figure 1). By 2019–20, tax receipts are forecast to be at their highest share of national income (34.4%) since 1981–82. Total government receipts, which include interest, dividends and gross operating surplus, are forecast in 2019–20 to be at their highest level (37.2%) since 1986–87.
Figure 1: Tax receipts set to rise under current plans [download data]
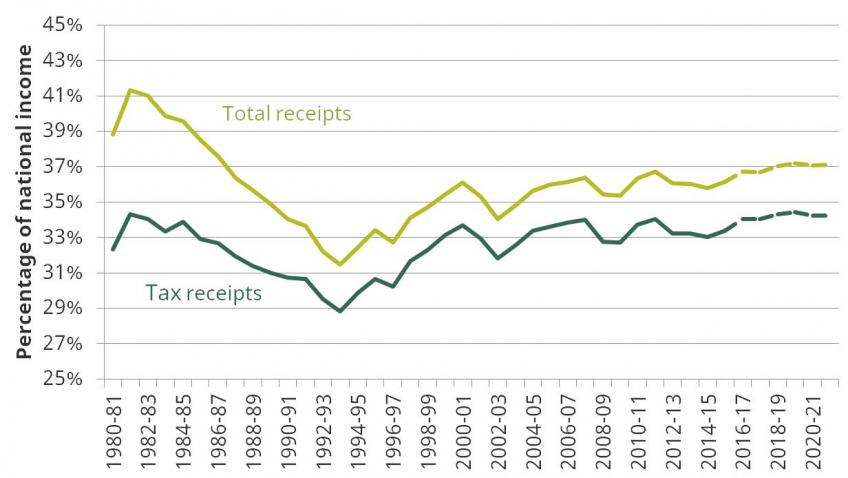
Note: Dashed lines indicate forecasts.
Source: Authors’ calculations using Office for Budget Responsibility, ‘Public finances databank’, March 2017, http://budgetresponsibility.org.uk/data/. Series adjusted to remove revenues forecast to be raised from the proposed, but now scrapped, increase in Class 4 NICs.
The next government, whatever its colour, will face pressure to maintain this increase in tax revenues, and possibly to raise further revenues. Previous IFS research shows that it is also common practice to raise taxes after an election. In the 12 months following the five general elections of 1992, 1997, 2001, 2005 and 2010, significant tax-raising measures were announced (despite these measures typically not featuring in the winning party’s general election manifesto). Across these elections, the average net tax rise in the 12 months following the election was £7.5 billion.[1] The 2015 general election followed this trend: the net impact of announcements made in the 12 months following the election boosted revenues by an estimated £3.5 billion. This is true despite a £5 billion giveaway from increasing the personal allowance and the higher-rate threshold. The main offsetting takeaways came from increases in dividend taxes (£1.8 billion), reductions in pension tax relief for those with incomes above £150,000 (£1.3 billion) and increases to insurance premium tax (£1.6 billion).
Income tax, NICs and VAT raise almost two thirds of revenues
Income tax, National Insurance contributions (NICs) and VAT are the three largest sources of revenues. They are forecast to contribute almost two-thirds (62%) of tax receipts in 2017–18 (Figure 2).
Figure 2: Composition of tax receipts, 2017–18 [download data]
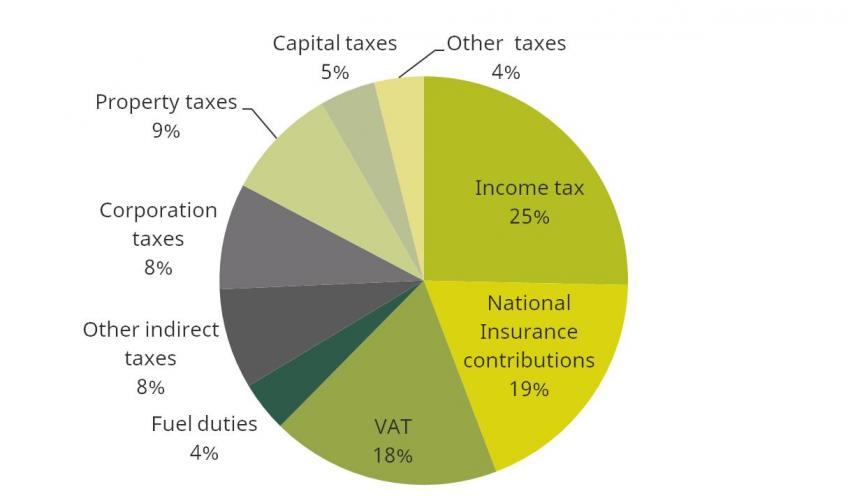
Note: ‘Other indirect taxes’ includes alcohol duties, tobacco duties, betting and gaming duties, air passenger duty, insurance premium tax, landfill tax, climate change levy, vehicle excise duties and soft drinks industry levy. ‘Corporation taxes’ includes corporation tax, petroleum revenue tax, oil royalties, bank surcharge, bank levy and diverted profits tax. ‘Property taxes’ includes council tax and business rates. ‘Capital taxes’ includes stamp duties, capital gains tax and inheritance tax. ‘Other taxes’ is a residual measure, including devolved taxes and environmental levies, which are generally part of government schemes that translate higher revenues directly into higher spending.
Source: Authors’ calculations using Office for Budget Responsibility, Economic and Fiscal Outlook, March 2017, http://budgetresponsibility.org.uk/efo/economic-fiscal-outlook-march-2017/.
Income tax payments are highly concentrated
In 2016–17 (the most recent year for which data are available), the top 1% of income tax payers (those with gross incomes over about £164,000) earned 12% of the pre-tax income of income tax payers and contributed 27% of income tax receipts (Figure 3). The top 10% of income tax payers (those with incomes over about £54,000) paid 59% of income tax, while the bottom half of income tax payers accounted for less than 10% of income tax receipts.
Figure 3: Income tax very top heavy: top 1% pay 27%, top 50% pay 90%, 2016–17 [download data]
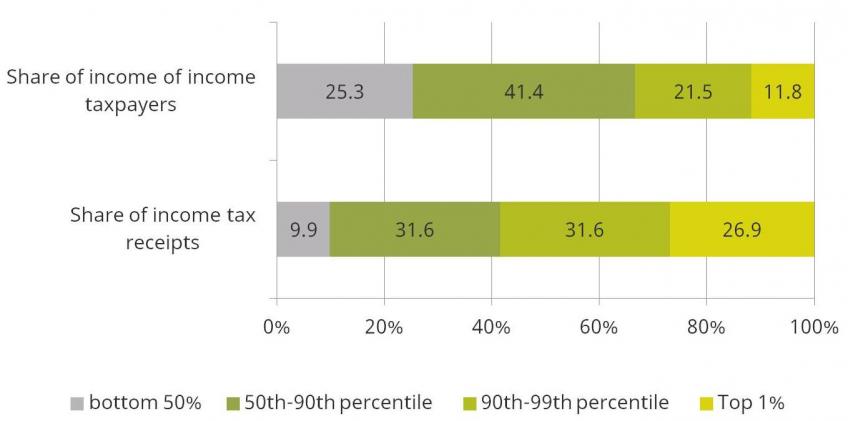
Note: Both bars show shares for the population of income tax payers.
Source: HMRC table 2.4, https://www.gov.uk/government/statistics/shares-of-total-income-before-and-after-tax-and-income-tax-for-percentile-groups.
This extreme concentration of income tax payments among a small number of people is partly a reflection of the progressivity[2] of the income tax system and partly a reflection of the fact that private income is very unequally distributed.
Share of income tax paid by the top 1% has been growing
The share of income tax paid by the top 1% has increased from 25% in 2010–11. The change since the early 1990s (Figure 4) is a continuation of a much longer-term trend; in 1978–79, only 11% of income tax receipts were paid by the top 1% of taxpayers. There are two important sources of this change: growing income inequality and policy change.
The trend pre-2007 was overwhelmingly driven by the distribution of pre-tax income: that is, the growing burden on richer taxpayers mostly reflected their higher share of total income.[3] Post-2007, the trend has resulted from policy choices. The share of tax coming from those on higher incomes has been increased by: a cut to the higher-rate threshold (in 2011); withdrawal of the personal allowance for those with taxable incomes over £100,000 (in 2010); and cuts in income tax relief on pension contributions and the increase in the tax rate for those with an income of over £150,000 (in April 2010). Increases in the personal allowance have taken many of those on relatively low incomes out of income tax altogether. Between 2010–11 and 2015–16, the share of the adult population who pay income tax fell from 61% to 57%. This means that the top 1% of income tax payers represent a falling share of the total adult population.
Figure 4: Fewer adults paying any income tax and top 1% paying growing share [download data]
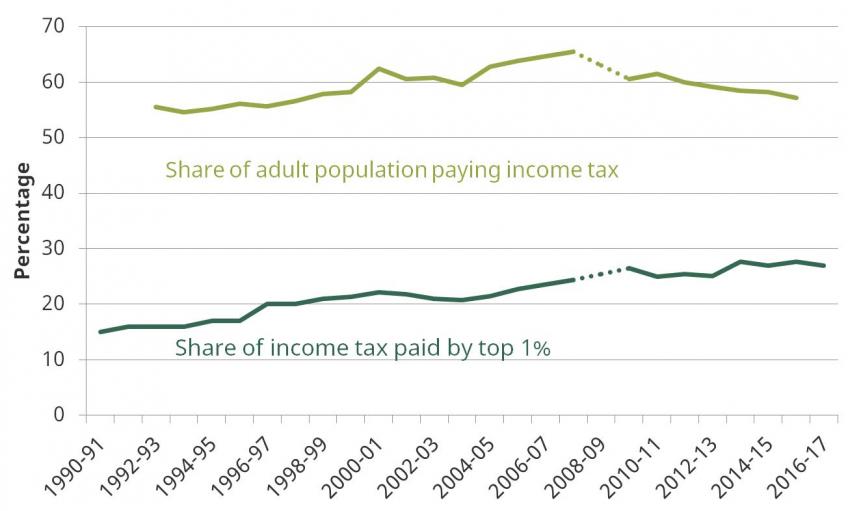
Note: Data not available for 2008–09; linear extrapolation used (dashed line).
Source: Authors’ calculations using ONS population estimates and HMRC tables 2.4 (see source to Figure 3) and 2.1 (https://www.gov.uk/government/statistics/number-of-individual-income-taxpayers-by-marginal-rate-gender-and-age).
Official statistics reveal less about who pays other taxes
Income tax is the government’s single biggest revenue-raiser, but focusing on this alone can give a misleading picture of the whole tax system because income tax is a particularly progressive tax and is certainly more progressive than the other two big taxes – NICs and VAT. Official statistics do not provide as much information for other taxes as for income tax (e.g. there is not a breakdown of how much of NICs is paid by the top 1%). It is also difficult to compare across taxes because an individual with a high income is not necessarily the same person who has high capital gains, or property values or fuel use etc. We do know that some sources of tax revenues are, like income tax, highly concentrated. For example, only 4% of individuals leave an inheritance tax liability when they die and, based on the most recent data (2013–14), over 70% of tax is paid by estates worth over £1 million.[4] Other taxes, such as VAT, are less concentrated.[5]
Overall, tax payments are highly concentrated, but to a lesser extent than income tax
We can use survey data, combined with the IFS model of the tax system, to consider how a broader set of tax payments are distributed across households, rather than individuals. This is shown in Figure 5 by plotting the cumulative shares of income tax, NICs, VAT and ‘total taxes’ paid by households ranked from richest to poorest in terms of income adjusted for household size.
Figure 5: Top half of households based on income contribute 78% of receipts [download data]
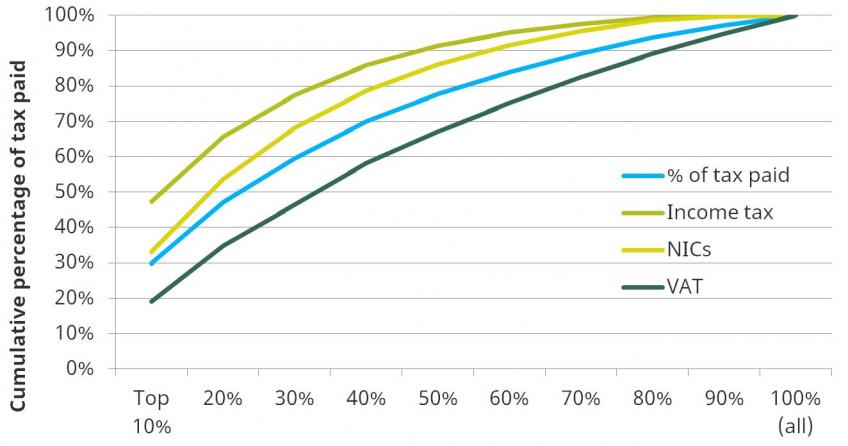
Note: Figure shows cumulative shares of tax liability. Blue line includes income tax, employer and employee NICs, VAT, excise duties and council tax; corporation tax, business rates, capital gains tax, inheritance tax and stamp duties are excluded.
Source: Authors’ calculations using the IFS tax and benefit microsimulation model, TAXBEN, applying 2017–18 tax system to uprated data from the 2013 Living Costs and Food Survey.
The figure shows that, like income tax, NICs are concentrated among better-off households, although to a lesser extent because of the structure of NICs. VAT payments, by contrast, are more broadly distributed across households. The blue line shows an estimate of the concentration of payments for a set of taxes that, together, account for over three-quarters of total tax revenue (including income tax, NICs, VAT, excise duties and council tax). It shows that the top half of households contribute around 78% of these taxes, suggesting that, overall, these tax payments are concentrated but less so than income tax payments.
Because household surveys under-report the income of the highest earners, this analysis will in fact understate their tax contributions. This can be seen from our estimate of the proportion of income tax receipts paid by the top 10% of households: 47%, likely a significant underestimate as we know from the official data above (based on tax returns) that the top 10% of individual income tax payers (who represent 6% of the adult population) contribute 59% of these receipts. In addition, this analysis does not include all taxes. Some of the smaller taxes omitted, including inheritance tax and capital gains tax, are also highly concentrated on the better off. There is a set of larger taxes for which the burden cannot be easily assigned to individual households. Most notably these include corporation tax, business rates and stamp duty on shares. One difficulty is that there is no good data on which UK households hold shares in companies subject to UK corporation tax (many shares are held indirectly through private pension funds).[6]
An assessment of the distributional impact of government policy as a whole would also include the effect of benefits and of spending on public services (both of which do a very large amount of redistribution).
2. Change in composition of tax revenues
Since 2010, smaller taxes have become more important
Figure 6 shows the changing composition of tax revenues between 2010–11 and the end of the forecast horizon. Receipts are forecast to be 0.5% of national income higher in 2021–22 than in 2010–11 (34.2% versus 33.7%). The taxman looks set to raise similar shares of national income from personal income taxes and indirect taxes but this relative stability masks important changes in the composition of revenues. Most notably, we will be raising more from VAT but less from fuel duties, and more from NICs but less from income tax. About the same will be raised from onshore corporation taxes, with overall corporation tax reduced by North Sea revenues. Capital taxes and a handful of other small and new taxes are set to become more important revenue sources.[7] An appendix lists the main recent policy changes.
Figure 6: Changing composition of tax receipts since 2010 [download data]
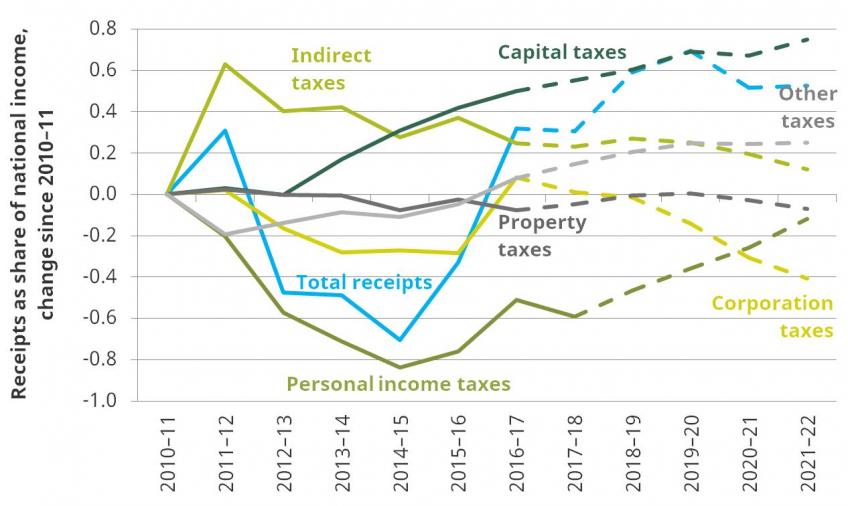
Note: Dashed lines indicate forecasts. ‘Personal income taxes’ includes income tax, NICs (employer and employee), payroll tax on bankers’ bonuses and the apprenticeship levy. This series is adjusted to remove revenues forecast to be raised from the proposed, but now scrapped, increase in Class 4 NICs. ‘Indirect taxes’ includes VAT, fuel duties, and other indirect taxes as defined in Figure 2. Other categories as defined in Figure 2.
Source: Authors’ calculations using IFS revenue composition spreadsheet, accruals measures: https://https://www.ifs.org.uk/uploads/publications/ff/revenue_composition.xlsx.
Personal income taxes were 0.8% of national income lower in 2014–15 than in 2010–11 but are forecast to increase to close to their 2010–11 level by 2021–22. At that point, the share of revenues coming from income tax would be 0.6% of national income lower and the share coming from NICs 0.4% of national income higher than in 2010–11. Policy decisions since 2010 have acted to increase revenues but with large giveaways (most notably through increases to the personal allowance and the higher-rate threshold) and takeaways (including through reduced relief on pension contributions, increases in tax on dividends and a new apprenticeship levy). NICs receipts got a boost in 2016 when the move to the single-tier pension led to the end of contracting out for those in defined benefit pensions (with much of this revenue coming from public sector workers and their employers). NICs and income tax receipts are due to increase slightly as a share of national income in the next few years due to ‘fiscal drag’ bringing more people into higher tax brackets and due to the new apprenticeship levy. Overall, personal income tax receipts are due to be lower than they would otherwise have been as a result of weak earnings growth and growth in self-employment and company owner-management (see Section 3).
Indirect tax receipts increased when the main rate of VAT was increased from 17.5% to 20% (in January 2011) but have been falling since, largely as a result of ongoing freezes to fuel duties. These falls have been partly offset by policy choices to increase smaller taxes, including insurance premium tax and the climate change levy.
Corporation taxes revenues are forecast to be 0.4% of national income lower by the end of the forecast horizon than in 2010–11. This is the result of a sharp fall in North Sea revenues. Onshore revenues will return to roughly their 2010–11 level. This is despite the corporation tax rate having been cut from 28% in 2010–11 to 19% in 2017–18 and forecast to be cut to 17% in 2020–21. Overall, onshore receipts have been buoyed by policy measures that raise revenues (including new taxes on banks and anti-avoidance measures) and bring revenues forward (including by restricting loss offsets).[8] Underlying growth in profits, including those from the financial sector, has increased receipts. Revenues are forecast to fall in cash terms in 2020–21 and 2021–22, in part as a result of the additional cut in the rate currently planned for 2020–21.
Property taxes will be contributing a similar share of revenue by the end of the forecast period. Rates of council tax in England were largely frozen between 2010 and 2015. They are expected to rise going forward as English councils use higher revenues to fund social care. Business rates receipts have been reduced by policy decisions that reduce the tax base, including the extension of relief for small businesses, and by the switch to uprating business rates in line with the Consumer Prices Index (CPI) rather than the discredited Retail Prices Index (RPI; historically, the former has increased less quickly).
Capital taxes are set to become more important; by 2021–22, the share of revenue they account for will have almost doubled relative to 2010. The increase since 2012–13 largely reflects increases in the underlying value of assets (including residential property). It also reflects an increase in stamp duty land tax as a result of a 3% surcharge on buy-to-let investments and second homes introduced in April 2016.
Changes to small taxes tended to be made in an ad hoc fashion
The Conservative government (and the coalition government that preceded it) have relied on a host of smaller and new taxes to offset revenue falls elsewhere. Examples of this include stamp duty land tax, insurance premium tax, diverted profits tax, bank surcharge, bank levy, apprenticeship levy and soft drinks levy (the last three are new taxes). These policy changes have tended to be made in an ad hoc fashion. This approach gives insufficient attention to tax design and can lead to poor policy choices. For example: insurance premium tax was increased with no discernible attempt to calculate what the appropriate level is; the apprenticeship levy is poorly designed;[9] and taxes on banks have not been underpinned by a clear strategy.
Even if one finds sensible policy reforms to small taxes, they will not provide substantial revenue increases. If the next government needs to deal with structural falls in revenues (e.g. from the move towards more efficient vehicles and self-employment) or wants to find revenues to fund giveaways, maintain the quality of public services as the population ages or cut the deficit, then there is a limit to how much it will be able to rely on small taxes.
The tax lock is bad policy and should not be in the party manifestos
Arguably, one reason why there has been a move towards smaller taxes is the 2015 Conservative party manifesto pledge not to increase the rates of income tax or NICs or the rates or scope of VAT during the current parliament. This so-called ‘tax lock’ is a serious constraint because these three taxes contribute almost two-thirds of tax revenues.
A government that wanted, or thought it might be necessary, to raise additional revenues in future would be foolish to tie its hands by ruling out increases in these workhorse taxes. Such a constraint would also prevent desirable tax reforms (as we have seen recently in relation to the taxation of the self-employed – see below), restrict the policy levers available to deal with any unexpected change in the economy and possibly lead to poor policy choices if a government is forced to rely heavily on smaller taxes (as it has done recently).
The recent NICs U-turn highlights the problems with the tax lock. In the March 2017 Budget, the Chancellor, Phillip Hammond, tried to increase the rate of self-employed (Class 4) NICs in response to new evidence that growth in the number of individuals working for their own businesses was creating a growing problem for the public finances (more on this in Section 3). Mr Hammond U-turned on the NICs increase, because it was widely – and rightly – deemed to breach the tax lock proposed in the 2015 manifesto, while clearly stating that he ‘continues to believe that’ reducing the tax difference between employees and the self-employed ‘is the right approach’.[10] The tax lock constrained the Chancellor’s ability to deal with an unexpected problem and, if the tax lock were to be renewed, the next government would be unable to meet the challenge associated with growing self-employment.
3. Challenges for tax receipts and tax policy
There is always some degree of uncertainty around tax receipts. This is driven by the fact that the economy will develop in unforeseen ways, the difficulty with forecasting the effect of some policy measures, and the fact that future Budgets will announce new policy measures that affect receipts. Recent IFS research has discussed the key risks to tax receipts, including the uncertainty that is associated with anti-avoidance measures.[11] Below are three challenges that the next government will have to meet.
Ongoing fuel duty freezes create uncertainty and a revenue shortfall
Fuel duties currently raise around £28 billion, 4.0% of tax revenues. Government policy is that rates of fuel duties should increase each April in line with inflation (measured using the RPI). As a result, this is factored into all Office for Budget Responsibility (OBR) forecasts. Yet, the uprating of rates of fuel duties has been scrapped every year since 2011 such that they remain frozen in cash terms at 2011 levels (Figure 7). The policy decisions to freeze rates of fuel duties in cash terms in successive Budgets and Autumn Statements cost around £5.4 billion a year in 2017–18 terms (relative to uprating in line with the RPI).
Figure 7: Constantly freezing fuel duties now costs £5.4bn a year [download data]
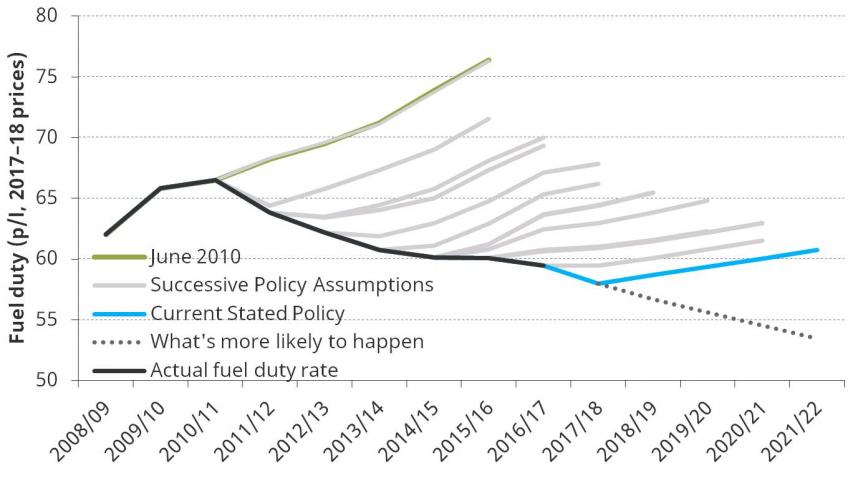
Source: Authors’ calculations using various policy costing documents.
Given the recent unwillingness to increase rates of fuel duties even in line with inflation – and even in April 2016 when the oil price had been falling and the new parliament was less than a year old – there is a high degree of uncertainty around this revenue stream. If the next government continues to freeze fuel duties, it will need to deal with this revenue loss (by raising other taxes, increasing borrowing or cutting spending). Freezing duties each year until 2021–22 would cost £2.9 billion (in 2017–18 terms). If a government plans to continue to freeze fuel duties, then it would be preferable to make that clear in advance. This would remove the ridiculous situation we currently have in which revenue forecasts are flattered by a planned tax change that presumably few believe will happen and governments have to plug the shortfall with ad hoc tax increases at each fiscal event.
Whether or not rates of fuel duties are in fact increased in line with inflation, there is also a structural decline in receipts of these duties under way as a result of the move towards more fuel-efficient vehicles. The OBR forecasts that this structural change will itself lead to a fall in fuel duties revenues of a third by 2033–34, as demand for petrol and diesel continues to fall. So even if we manage to raise fuel duties in line with inflation, revenues are still likely to fall by 0.5% of GDP within less than 20 years.[12]
A new government could usefully review fuel duties. Such a review should consider moving to automatically uprating fuel duties each month by the CPI, in order to remove discredited RPI indexation and prevent campaigning for freezes in the run-up to fiscal events. It should also review new evidence on the emissions from diesel vehicles, which suggests that diesel is undertaxed relative to petrol.
Increased working for own business reduces revenues by £4.5 billion
Two-fifths of workforce growth since 2008 has come from individuals working for their own businesses through self-employment or company owner-management. These groups are taxed substantially less heavily than employees. The self-employed are subject to a lower rate of employee NICs and attract no equivalent of employer NICs. The 2 percentage point increase in self-employed (Class 4) NICs that the Chancellor announced in Budget 2017 (and U-turned on shortly after) would have only narrowed the NICs gap slightly (Figure 8).
Figure 8: Employees face higher NICs and increase in Class 4 NICs would have done little to change that [download data]
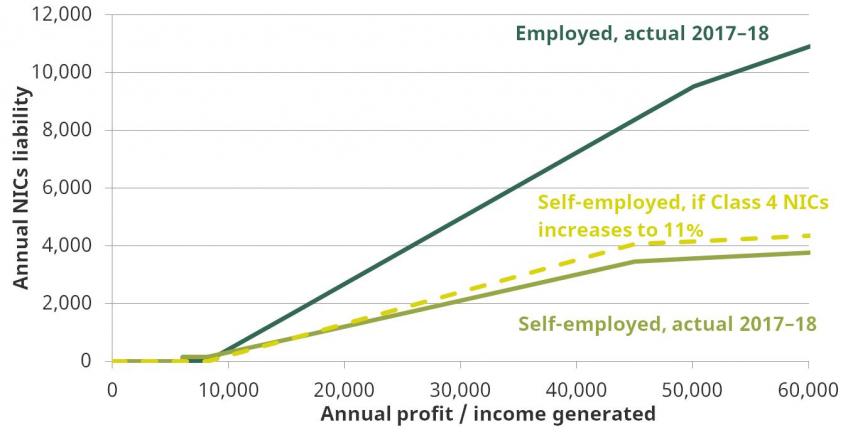
Note: Dashed line includes Class 4 NICs at 11% and abolition of Class 2 NICs. For illustration, both are shown as if introduced in the 2017–18 system. Employee schedule includes employer NICs.
Source: Authors’ calculations.
Company owner-managers can access lower tax rates than employees or the self-employed by, among other things, taking income out of their companies in the form of (more lightly taxed) dividends rather than salary. A change in the labour market away from employment towards self-employment therefore has a substantial effect on the public finances. The OBR forecasts that revenues will be £3.5 billion lower in 2021–22 as a result of growth in incorporations outstripping employment growth, and an additional £1 billion lower as a result of further growth in self-employment.
These figures are in addition to the already substantial revenue forgone through giving lower taxes to these groups. HMRC estimates that lower NICs rates for the self-employed relative to employees cost £5.1 billion each year and lower taxes for company owner managers cost £6.0 billion each year. These figures equate to £1,240 per self-employed person and £9,040 per company owner-manager on average, where the averages mask the fact that most tax savings are going to high-income individuals.
The differential tax treatment of employees, the self-employed and company owner-managers creates a tax system that is complex, unfair and inefficient. Ideally, a new government would set out a long-term vision for how to tax different ways of working. Even if the next government does not wish to take action to improve the tax system, it will have to face the public finance consequences of growing numbers of individuals choosing to work in more lightly taxed forms.[13]
Income tax receipts getting riskier as higher share comes from dividends and high earners
The increase in the number of individuals working for their own companies and taking income through dividends rather than salary makes income tax receipts more unpredictable and riskier (from the government’s point of view). This is because this group has greater opportunities to avoid tax, including by altering the timing of tax payments. We recently saw a clear example of this. In July 2015, the government announced that the tax rate on dividends would increase in April 2016. In response, individuals brought forward dividends payouts to avoid paying the higher rate later. Dividend forestalling was sufficiently large that the estimated tax saving for individuals (and therefore the loss to government revenues) was £800 million.
Income tax receipts are also riskier because they now rely more heavily on a small group of high-earning taxpayers. This makes tax revenues more sensitive to the composition of income growth and thereby more uncertain. This includes both upside and downside risk. If the earnings of the top 1% or 10% grow more/less quickly than the rest of the distribution, tax revenues may increase more/less quickly than total earnings. These taxpayers also pay a large share of other taxes (such as capital gains tax, stamp duty land tax and inheritance tax), meaning that changes in their fortunes can have a large impact on tax receipts. The OBR forecasts that earnings growth for the top 10% will be lower for the years after 2018–19 as a result of the UK’s decision to leave the EU. This will reduce tax receipts.[14] Regardless of one’s view of income inequality, or the share of total income that accrues to high-earning bankers, well-paid chief executives and the like, if top taxpayers experience weak earnings growth or decide to move elsewhere – and many of them were not born in the UK – then the rest of us will have to pick up a very big bill.
Appendix. Main policy changes since 2015
Measure | £ million, 2017–18 terms |
Income taxes |
|
Increases to personal allowance | –4,100 |
Increases in higher-rate threshold | –1,100 |
Reduction in pension tax relief for those with income above £150,000 | 1,300 |
Changes in dividend allowance and increase in effective rates | 2,500 |
Abolition of self-employed Class 2 NICs | –660 |
Primary (employee) and secondary (employer) NICs thresholds aligned | 130 |
Introduction of apprenticeship levy | 2,800 |
Indirect taxes |
|
Fuel duties freezes | –1,200 |
Increases to insurance premium tax main rate | 2,400 |
Introduction of soft drinks industry levy | 330 |
Reform to VED structure for new cars | 1,300 |
Corporation taxes |
|
Reduction in corporation tax rate from 20% to 17% | –3,100 |
8% corporation tax surcharge on banks and reduced bank levy | 100 |
Petroleum revenue tax abolished; supplementary charge reduced to 10% | –180 |
Annual investment allowance set at new permanent level of £200,000 | –720 |
Property taxes |
|
Increase in council tax to fund social care | 2,000 |
Business rates small business relief extension made permanent | –1,100 |
Business rates: switch from RPI to CPI uprating | –290 |
Capital taxes |
|
Stamp duty land tax for non-residential property from ‘slab’ to ‘slice’ | 530 |
Higher rates of stamp duty land tax on additional properties | 800 |
Capital gains tax rate reduced to 10% for basic-rate and 20% for higher-rate taxpayers (excluding residential property) | –660 |
Inheritance tax: phased introduction of residence nil rate band | –850 |
Note: Not a comprehensive list of measures. Cost shows official forecast cost of policy in 2021–22, estimated at time of announcement, expressed as equivalent value of 2017–18 GDP.
Source: Authors’ calculations using Office for Budget Responsibility, ‘Policy measures database’, March 2017, http://budgetresponsibility.org.uk/download/policy-measures-database/.
Previous IFS work discusses policy changes between 2010 and 2015. See S. Adam and B. Roantree, ‘The coalition government’s record on tax’, IFS Briefing Note BN167, 2015, https://www.ifs.org.uk/uploads/publications/bns/BN167170315.pdf
[1] See figure 5.13 in C. Emmerson, S. Keynes and G. Tetlow, ‘Public finances: outlook and risks’, in C. Emmerson, P. Johnson and H. Miller (eds), The IFS Green Budget: February 2013, https://www.ifs.org.uk/budgets/gb2013/GB2013_Ch5.pdf.
[2] Progressivity refers to a situation in which the average tax rate for a specific tax (or tax system) increases with the tax base, i.e. in which a larger share of income is taken from high income groups than from lower income groups.
[3] See figure 1 of C. Belfield, R. Blundell, J. Cribb, A. Hood, R. Joyce and A. Norris Keiller, ‘Two decades of income inequality in Britain: the role of wages, household earnings and redistribution’, IFS Report Summary, January 2017, https://www.ifs.org.uk/publications/8849.
[4] HMRC, ‘Inheritance tax statistics’, https://www.gov.uk/government/collections/inheritance-tax-statistics.
[5] For a discussion of the distributional effects of VAT, see section 6 of S. Adam and B. Roantree, ‘The coalition government’s record on tax’, IFS Briefing Note BN167, 2015, https://www.ifs.org.uk/uploads/publications/bns/BN167170315.pdf.
[6] Note that the ultimate economic burden of all taxes may fall on a different group of individuals from those who formally remit the money to the government.
[7] For a full discussion, including longer-term trends, see H. Miller and T. Pope, ‘The changing composition of UK tax revenues’, IFS Briefing Note BN182, 2016, https://www.ifs.org.uk/uploads/publications/bns/BN_182.pdf.
[8] For additional discussion, see section 3 of H. Miller and T. Pope, ‘The changing composition of UK tax revenues’, IFS Briefing Note BN182, 2016, https://www.ifs.org.uk/uploads/publications/bns/BN_182.pdf.
[9] See N. Amin-Smith, J. Cribb and L. Sibieta, ‘Reforms to apprenticeship funding in England’, in C. Emmerson, P. Johnson and R. Joyce (eds), The IFS Green Budget: February 2017, https://www.ifs.org.uk/publications/8863.
[10]http://www.bbc.co.uk/news/uk-politics-39281754.
[11] R. Crawford, C. Emmerson, T. Pope and G. Tetlow, ‘Risks to the rules: tax revenues’, in C. Emmerson, P. Johnson and R. Joyce (eds), The IFS Green Budget: February 2016, https://www.ifs.org.uk/uploads/gb/gb2016/gb2016ch5.pdf.
[12] Office for Budget Responsibility, Fiscal Sustainability Report, July 2014, http://budgetresponsibility.org.uk/fsr/fiscal-sustainability-report-july-2014/.
[13] For a full discussion, see S. Adam, H. Miller and T. Pope, ‘Tax, legal form and the gig economy’, in C. Emmerson, P. Johnson and R. Joyce (eds), The IFS Green Budget: February 2017, https://www.ifs.org.uk/publications/8872. For a summary, see H. Miller, ‘Tax in a changing world of work’, Tax Journal, 20 April 2017, https://www.taxjournal.com/articles/tax-changing-world-work-20042017.
[14] See box 4.1 of Office for Budget Responsibility, Economic and Fiscal Outlook, March 2017, http://cdn.budgetresponsibility.org.uk/March2017EFO-231.pdf.
IFS Election 2017 analysis is being produced with funding from the Nuffield Foundation as part of its work to ensure public debate in the run-up to the general election is informed by independent and rigorous evidence. For more information, go to http://www.nuffieldfoundation.org.
Authors

Helen Miller
Helen is Deputy Director of the IFS and Head of the Tax sector.

Barra Roantree
Barra is a Research Fellow at IFS and Assistant Professor of Economics at Trinity College Dublin.
More from IFS
Understand this issue


Policy analysis


Academic research


