
The existing package of support
Back in May, the government updated their one-off package of support for households, which now totals £24 billion and comprised five main strands:
- £400 to all households labelled as an “energy discount” that will be subtracted from energy bills.
- £150 for all households in council tax bands A-D (around 80% of households).
- £650 for any family on means-tested benefits.
- £300 for pensioners.
- £150 for those on a disability benefit.
None of these strands of support are mutually exclusive. For example, if you are a low-income disabled pensioner in Council Tax Band B you can get all of the above, worth £1,650.
A worsening outlook
These measures came in response to an expectation, at the time, that the cost of living would on average be 9.5% higher in 2022-23 than 2021-22, with an expected peak of inflation of 10.2% in the fourth quarter of this year, and with the energy price cap expected to reach £2,800 for a typical household in October 2022 and to remain at a similar level in January 2023.
Had everything played out as was expected in May, the net effect of all this would have been for the real incomes of low-income households being broadly maintained on average this year, though with significant variation around this. Middle- and high-earners, while benefiting from at least £400 of support and typically £550, were nevertheless still set to see significant falls in real income.
Unfortunately, the outlook has got worse once again since May. The cost of living is now expected to be 11.3% higher this financial year, 2022/23, than last, with inflation peaking in the last quarter of this year at 13.1%. The energy price cap is expected to reach £3,600 for a typical household in October and £4,300 in January.
This means both that inflation expectations overall are higher, and – because much of the recent change in the outlook is due to energy prices – that the pattern of inflation is even more unfavourable towards poorer households, who tend to spend more of their budgets on energy. Figure 1 shows how inflation is expected to vary across income quintiles in October of this year, accounting for the different budgets of different income groups. The fact that poorer households devote more of their spending to energy, means that the inflation rate the poorest quintile will experience is expected to rise to an eye-watering 18% in October, compared to 11% for the richest quintile.
Figure 1. Expected inflation by income quintile in October 2022
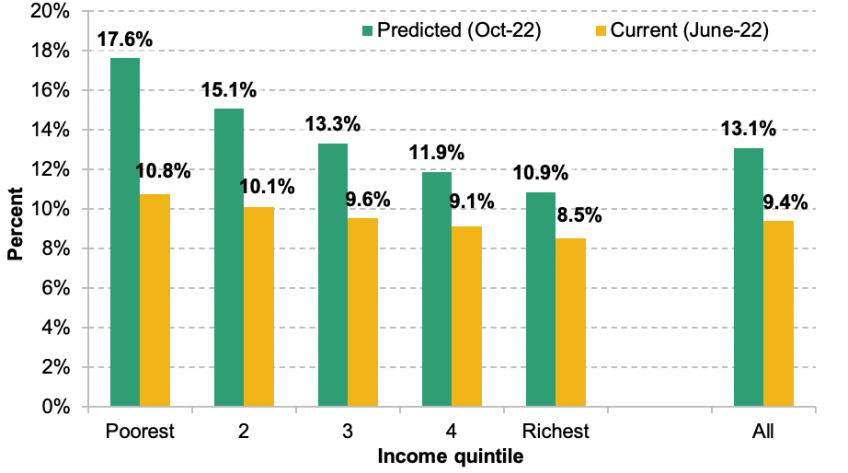
Note: Authors’ calculations from the Living Costs and Food Survey 2019, price data from the Office for National Statistics and forecasts of the energy price cap change in October from Cornwall Insights. Gas and electricity prices are assumed to rise relative to April in proportion with the change in the energy price cap, other prices are assumed to increase so as to meet the Bank of England’s forecast of 13.1% for Q4 2022. Household income equivalised using modified OECD scale. The inflation rate calculated using LCFS budget shares gives a higher weight to several items that saw rapid price increases, including gas prices, vehicle fuel and second-hand cars than the CPI. This implies an inflation rate 3.6 percentage points higher than the official CPI. We subtract this difference from the inflation rates reported here. The ‘average’ inflation rate here still differs slightly from the official CPI because it is an average of household inflation rates (while the official CPI weights implicitly give more weight to higher-spending households).
Figure 2 illustrates the change in the outlook for some example households. Back in May, the support package meant that an out-of-work single parent with two children looked set to just about see their real income maintained this year. This was despite their standard benefit increase of 3.1% (based on the September 2021 CPI inflation rate) falling far short of actual current inflation, and despite no longer having the £20 per week Universal Credit uplift that applied until October 2021. Those on the minimum wage would tend to do better still, as it has increased more than average earnings. But middle-and-higher earning households were already set for significant real income falls: the flat rate energy support package equates to only a small fraction of their earnings, which are falling in real terms, reinforced by increases to NICs and income tax.
The deterioration in the outlook means that all of these households are now set for real income falls this year. Taking Bank of England forecasts for inflation and earnings, the poorest household in the chart, the out-of-work single parent, looks set to be about £460 worse off over the year. The median-earner household will find themselves around £760 worse off than last year, and the household with one earner at the 75th percentile will find themselves around £1,440 worse off. The chart uses the average expected inflation rate for all the examples. To the extent that the lower-income household types are likely to face higher inflation rates, as shown in figure 1, the real falls in income for them would be larger still.
Figure 2. Changes in real take-home income, this year (2022/23) compared to last
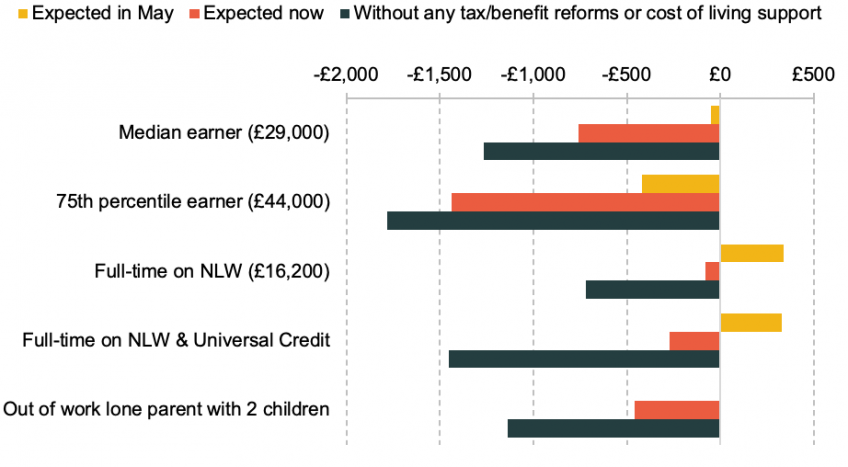
Notes: First 3 households receive no benefits and have no working partner. The last 2 households are assumed to be lone parent homeowners with 2 children. None of the households are disabled and all are in council tax band A-D properties. ‘Without any tax/benefit reforms or cost of living support’ incorporates real earnings changes and rates and thresholds by default rising more slowly than expected inflation. Measures incorporate the half-year effect of removing the temporary UC uplift (since it was in place for half of the previous financial year).
Policy options
Given this change in outlook, what increase to the support given to households in the short term would be needed in order to achieve the same level of protection that was intended back in May?
At an aggregate level, back in May the government’s £24 billion package would cover around three quarters of the £33 billion increase in energy costs that were expected then. To maintain this level of support given the latest expectations for higher energy prices would require an additional £12 billion or so on top of the £24 billion already pledged.
The government could implement such a package in a number of ways. For example, most middle- and higher- earners stand to benefit only from the £400 “energy discount” and, if in Council Tax Bands A-D, £150 delivered as a council tax rebate. Back in May, that £550 covered about half of the then expected increase in the capped cost of energy for a typical household over 2022/23. Continuing to cover 47% of the increase in energy costs, given the higher caps expected now, would mean delivering an additional £260 on top of the £550 already being offered – at a cost of around another £7bn.
The government might also choose to focus more of its support for those on the lowest incomes. The previous package meant that, on average, households without someone in paid work (including pensioners) would see their benefit income this year approximately maintain its real value. But under the latest forecasts for inflation, working-age families out-of-work and on benefits are set to see a fall in their real benefit income of about £620 from 2021-22 to 2022-23. Pensioners on means-tested benefits, however, will only see a £140 decline (around 1% of their benefits). Doubling the current £650 grant would therefore (more than) protect low income out-of-work families on average, as well as helping low income families in work, at a cost of roughly £5½ billion.
Changes in government spending of this magnitude - if funded by further borrowing rather than tax increases - would of course add to the inflationary pressures in the economy, though it is hard to say by how much. To the extent this is not immediately offset by, for instance, higher interest rates, this would exacerbate the very problems these packages are aimed to address - namely, high and accelerating rates of inflation that, in the short term, can rapidly erode the real value of some families’ incomes.
Looking beyond this winter
Up until now, our focus has been on the short term – essentially the coming winter. But another important development has been the expectation that the peak in inflation, and the moment when it returns to the sorts of levels we had become used to, will be considerably later than was previously thought. Inflation is now expected to remain in double digits until the fourth quarter of 2023.
Importantly, the huge further rise in the energy price cap now expected, mostly in October 2022 but also in January 2023, will mean that benefits would, by default, again rise by significantly less than the contemporaneous inflation rate next April. That’s because we still retain the default of uprating benefits in April in line with CPI inflation to the previous September. Hence, neither of those increases in the energy price cap will have a bearing on the increase in benefits in April 2023. Effectively, this pushes back by at least another full year, to April 2024, the likely point at which the uprating of benefits finally “catches up” with developments in the world and their real value is restored. The £650 grants to those on means tested benefits were a crude way of compensating benefit recipients for the use of a lagged (and much lower) rate of inflation than what they are actually facing.
Figure 3 below illustrates the rollercoaster that the real value of universal credit has been on, and is set to continue on, for an example household. Because of the high rate of inflation, the real value of UC for this family is due to fall over the course of the year, ending up around 12-13% below its pre-pandemic level in the coming winter. Of course, around roughly the same period such a family would typically be entitled to £1,200 in the one-off grants already discussed. But ongoing high inflation in 2023 and the lag in uprating means that even at the start of 2024 it will remain 8% below pre-pandemic levels - without, on current plans, any additional support. It is not until April 2024 that the value of UC finally recovers.
Figure 3. Real monthly universal credit entitlement for a lone parent family with two children (2022Q3 prices)
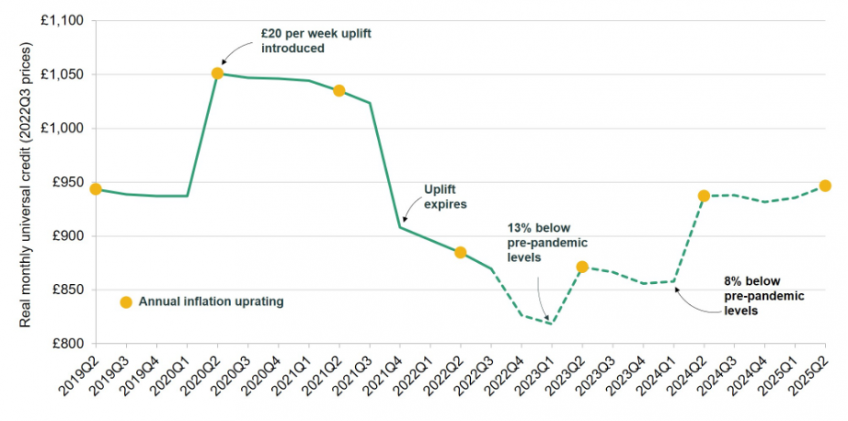
Notes: Example household is a lone parent homeowner with two children, one of whom was born before April 2017. The parent has no other source of income.
This is a deficiency in uprating policy that could have been rectified (at least) months ago when the cost of living crisis first became apparent. The failure to do so now looks certain to create a policy headache not just this year, but next year as well. The government would do well - both for the current crisis and for beyond - to shift to uprating benefits using a more recent measure of inflation, or forecast inflation. This would go some way to ensuring that benefit values more closely track the prices that claimants face, and avoiding the kind of ad-hoc policymaking and short term periods of hardship that the current system is prone to creating.
Those households who are not receiving benefits are supposed to receive protection under other aspects of the May support package (for the large majority, rebates on council tax and discounts on energy bills worth £550). This support is supposed to be temporary, but with bills expected to remain around £4,000 for a typical household over 2023, the government will almost certainly come under significant pressure to renew this support as well.
Conclusion
In the end, these price rises have made the country worse off and many or all of us will ultimately lose out as a result. The government can choose to adjust who bears the brunt of the pain and to some extent delay it. But it cannot avoid it completely. To continue to provide coverage of the (sizable) scale seen in May would represent a substantial fiscal loosening, and would almost certainly put upward pressure on the high inflation that created the demand for these policies to begin with. But making no changes to the package currently on offer will leave many households, rich and poor, seeing very significant declines in their real incomes.
Authors

Paul Johnson
Paul has been the Director of the IFS since 2011. He is also currently visiting professor in the Department of Economics at University College London.

Robert Joyce
Robert is a Deputy Director. His work focuses on primarily on the labour market, income and wealth inequality, and the design of the welfare system.

Peter Levell
Peter joined in 2009. He has published several papers on the microeconomics of household spending and labour supply decisions over the life-cycle.

Tom Waters
Tom is an Associate Director at the IFS and Head of the Income, Work and Welfare sector.
More from IFS
Understand this issue


Policy analysis


Academic research


