
Downloads
Accurate estimates of the returns to different higher education courses are vital. Information on the returns to the different options students face is essential for allowing them to make an informed decision on which subjects and at which university to study. High-quality evidence on returns is also crucial for policymakers considering the design of the higher education system and the development of skills in the economy. Recent work by Belfield et al. (2018) has provided rich evidence on the returns to different higher education options using newly linked administrative data. One common criticism of that work is that it looks at gross earnings returns, and does not take into account differences in cost of living across the country. In this report, we investigate how adjusting for cost of living affects the returns to different higher education options.
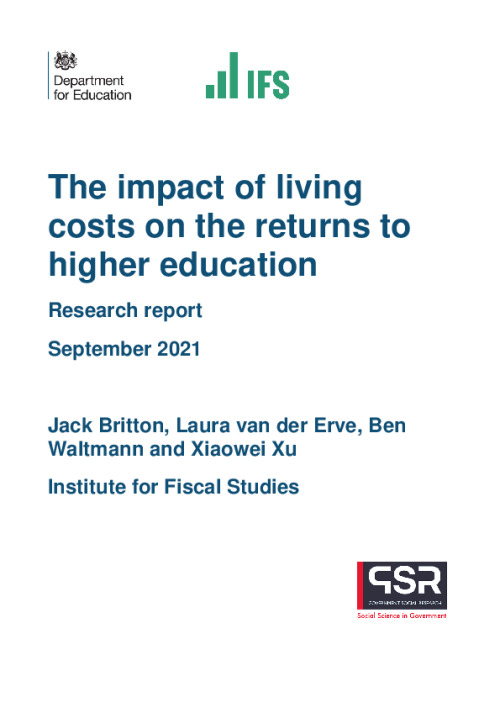
Housing costs are well known to vary widely across the country. For example, last year the average house price in Camden reached more than £1.1 million, while this was only £140,000 in County Durham. The prices of other goods and services display similar (albeit less extreme) patterns and, as a result, there is huge variation in living costs across the UK. Figure 1 highlights this variation, showing how overall living costs can be more than 10% lower than the UK average in the North of the country, but more than 30% higher than the national average in London and the South East. A salary that might allow individuals to lead a very comfortable life in County Durham might therefore leave them struggling to get by in London.
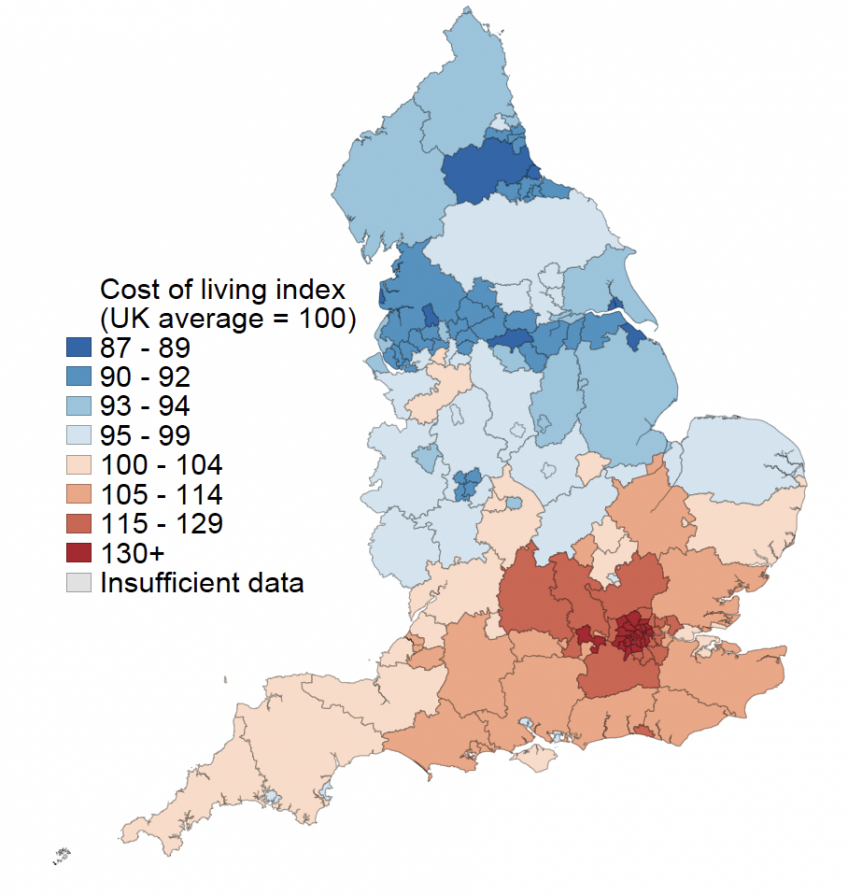
This can have important implications for how we think about the returns to attending uni-versity. We know graduates are much more geographically mobile than non-graduates and more likely to move to major cities (see Britton et al., 2021). If this means that graduates face higher living costs than non-graduates, the differences in gross incomes between these groups will over-estimate the differences in their disposable income and living standards. Moreover, not only are there differences in residential location between graduates and non-graduates, but there are also very large differences in residential location across graduates who attended different universities. Figure 2 compares the residence at age 27 of graduates from the University of Bolton and the London School of Economics (LSE). While virtually all University of Bolton graduates stay in the North West, those from the LSE remain concentrated in London and the South East. So while it is true that the earnings returns to attending the LSE are substantially higher than those of attending the University of Bolton, the differences in living costs in the areas where graduates from these respective institutions live after leaving university suggest that the average University of Bolton student will need a lower level of earnings than the average LSE graduate to obtain the same standard of living. A similar argument can be applied to different subjects – for example, medical graduates end up working in hospitals all over the country, while graduates of some other subjects are much more heavily concentrated in big cities.
Figure 1: Cost of living variation across England
Notes: See Section 3.1 for more detail on how the cost of living index has been created.
This leads us to ask the question of how adjusting for differences in living costs based on individuals’ area of residence affects estimates of the returns to different universities and subjects. To answer this question, this report uses newly linked data on area of residence in early adulthood to explore where graduates live in early adulthood and estimate how returns to higher education (HE) change once we adjust gross earnings for differences in living costs across the country.
Figure 2: Age 27 destination of graduates from University of Bolton (left) and LSE (right)
Notes: Yellow cross marks the location of the university. Colours show the proportion of the universities’ graduates who live in a given LA at age 27.
We start by showing that there are indeed large differences in where graduates from different universities live after leaving education. Around 60% of individuals who attended university in London still live there at age 27, while less than 20% of graduates from institutions outside of London live in London at age 27. For universities outside London, there is a strong negative relationship between selectivity and the shares of graduates staying in the local area, and a strong positive relationship between selectivity and moving to London. For example, around half of Oxbridge graduates live in London by age 27, while this proportion is less than 10% for the least selective universities.
As London is the place with the highest living costs in the country, this also means that uni-versities in London and the most selective institutions outside of London see the largest decreases in returns – up to 20 percentage points – once we adjust earnings for differences in living costs. On average, individuals who attended university live in more expensive areas than those who did not, and adjusting earnings for living costs decreases average institution returns by around 3 percentage points. A few universities do see some very small increases in returns, however. These are typically institutions that are located in lower-cost areas with large shares of graduates who are from, and stay in, the local area, as well as specialist agricultural colleges.
While the changes to returns can be quite large for some institutions, and London institutions in particular, adjusting for living costs does not materially change the overall ranking of univer-sities. The correlation between adjusted and unadjusted returns rank is 0.97 for men and 0.96 for women. Importantly, there are no universities going from having significantly negative returns to having significantly positive returns or vice versa, once we adjust for costs of living.
When we look by subject, perhaps unsurprisingly we see only very small changes to the re-turns estimates when we adjust earnings for living costs. The three major counterexamples to this are economics (for which returns decrease), medicine and veterinary sciences (for both of which re-turns increase). Nevertheless, we do not see the overall ordering of subject returns changing very much, with economics and medicine still at the top of the distribution, and veterinary sciences moving from being one of the lowest-returning subjects to a mid-ranking subject. Otherwise, the subject estimates are broadly unchanged.
Authors

Jack Britton
Jack's main interests lie in human capital accumulation and discrete choice dynamic modelling.

Laura van der Erve

Xiaowei Xu
Xiaowei joined the IFS in 2018 and works in the Income, Work and Welfare sector.

Ben Waltmann
Ben's main research areas are tax and social protection in developing countries, higher education, and dynamic discrete choice models.
More from IFS
Understand this issue


Policy analysis


Academic research


