
Downloads
The characteristics and incomes of the top 1%
PDF | 793.6 KB
The richest members of our society get a lot of attention. Much of the public conversation about economic inequality is concerned with, loosely, the top 1%, how different they are from the rest, how they got to where they are, and what – if anything – policy should do about it. It is also a fact that this group is extremely important for the funding of our public services and welfare system, because it pays a large portion of our tax revenues.
Figure 1. Share of national income accounted for, by top 1% of adults
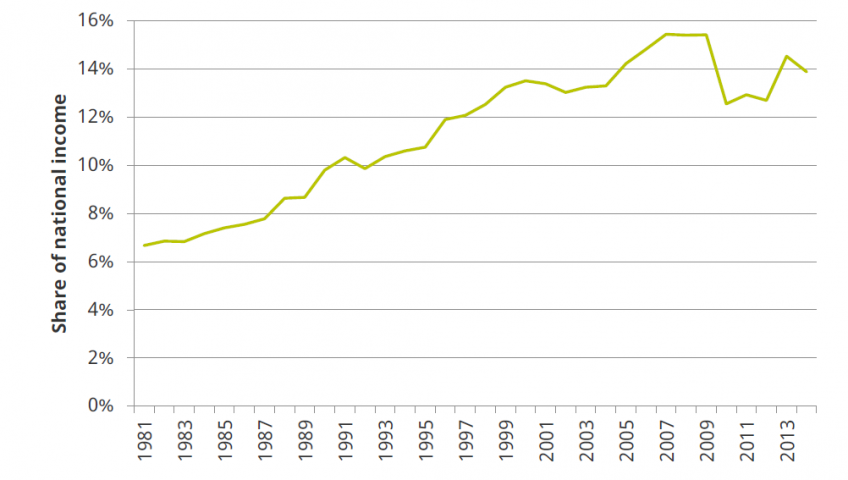
Note: From 1981 to 1989, the top 1% share refers to the share accounted for by tax units (where spouses’ incomes are jointly assessed). From 1990, the top1% share refers to the top 1% of adults.
Source: World Inequality Database.
The highest-income 1% of adults receive around 14% of national income (Figure 1). This share increased significantly in the 1980s as overall inequality increased, but the group pulled further away from the rest throughout the 1990s and most of the 2000s (until the financial crisis), even though income inequality across most of the population was actually stable or falling over that period.
But the picture we have of this group is often rather patchy or anecdotal. In part, this is because the types of household surveys on which we typically rely for data on economic inequality, while providing broadly representative samples of most population groups, are known to be unreliable when it comes to capturing data on the very richest. In this briefing note, we use data from HMRC’s income tax records to document some key facts about the highest-income people in the country.
Key findings
To be in the top 1% of income tax payers in the UK (i.e. to be among the 310,000 individuals with the highest income), a taxable income of at least £160,000 is required.£236,000 is required to be in the top 0.5% and nearly £650,000 to be in the top 0.1%. 43% of adults pay no income tax and to be in the top 1% of all adults (or the top 540,000 people), a pre-tax income of at least £120,000 is required.
The top 1% of income tax payers are disproportionately male, middle-aged and London-based. A man aged 45–54 in London could be in the top 1% nationally while still needing a further £550,000 to be in the top 1% for his gender, age and region.
These patterns become more pronounced at even higher income levels. Almost half of the top 0.1% of income tax payers are based in London, over 40% are aged 45–54 and only 11% are women.
The top 1% of income tax payers have become more geographically concentrated since the turn of the century. The 65 (out of 650) parliamentary constituencies with the highest density of people in the top 1% now contain half of all of the top 1%. This is up from 78 constituencies in 2000–01.
Partnership and dividend income account for over a quarter of the total income of the top 1%, and over a third of the total income of the top 0.1%, a much higher share than for those with lower incomes. Partnership and dividend income are taxed at lower rates than normal salaries – a policy choice to tax the incomes of business owners at lower rates than employees, which therefore benefits a significant share of the top 1%.
The top 1% of income tax payers are not a stable group – a quarter of those in the top 1% in one year will not be there the next. After five years, only half will still be in the top 1%.
As a result, someone has a much higher chance of being in the top 1% at some point in their lives than they do in any given year. 3.4% of all people (and 5.5% of men) born in 1963 were in the top 1% of income tax payers at some point between 2000–01 and 2015–16.
Authors

Robert Joyce
Robert is a Deputy Director. His work focuses on primarily on the labour market, income and wealth inequality, and the design of the welfare system.

Barra Roantree
Barra is a Research Fellow at IFS and Assistant Professor of Economics at Trinity College Dublin.

Thomas Pope
More from IFS
Understand this issue


Policy analysis


Academic research

