
Charts, graphs and data
Explore our curated graphs and charts with downloadable data for background and insight into the upcoming election.
Key charts from our manifesto analysis
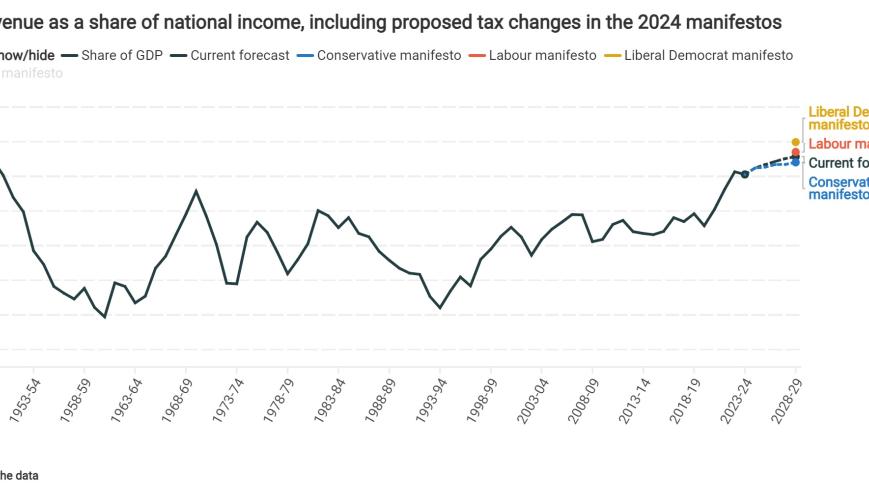
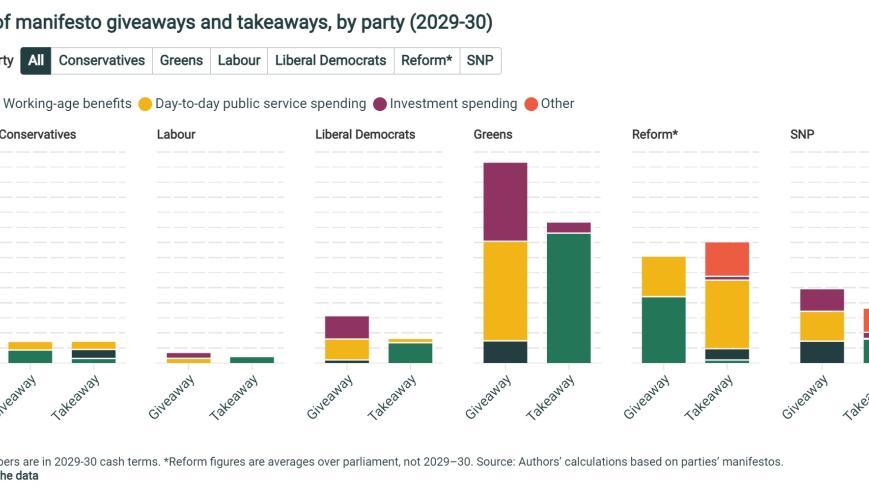
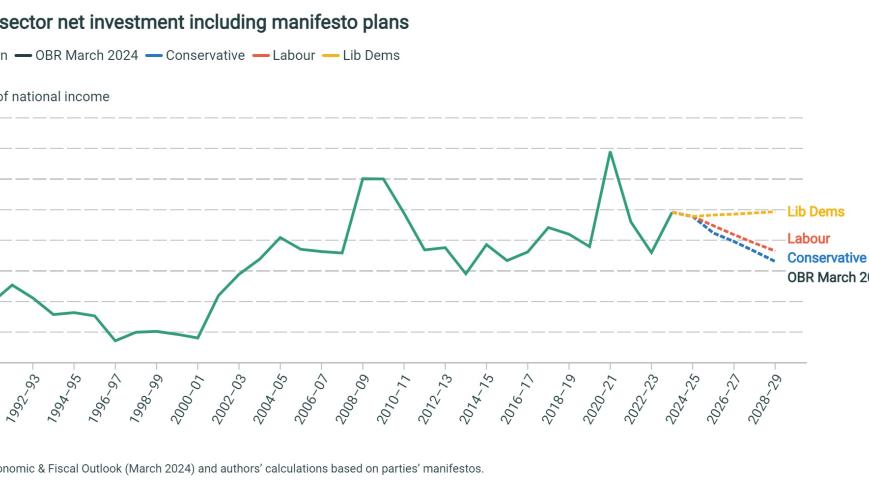
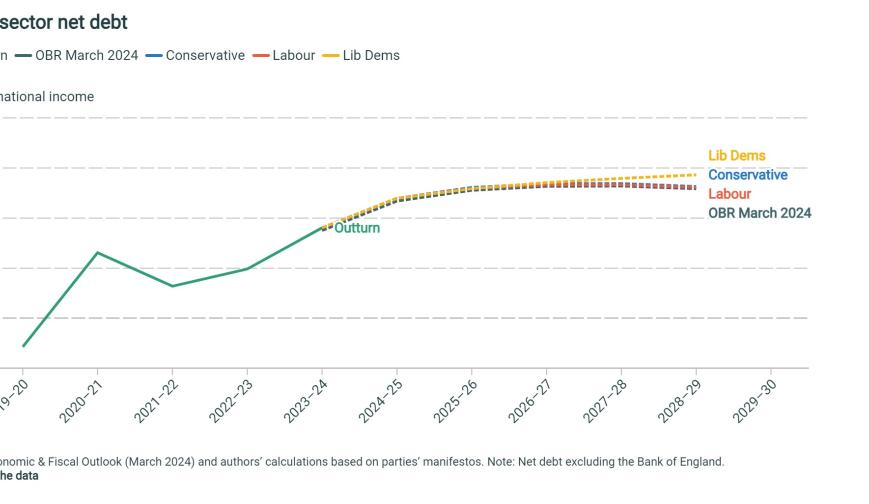
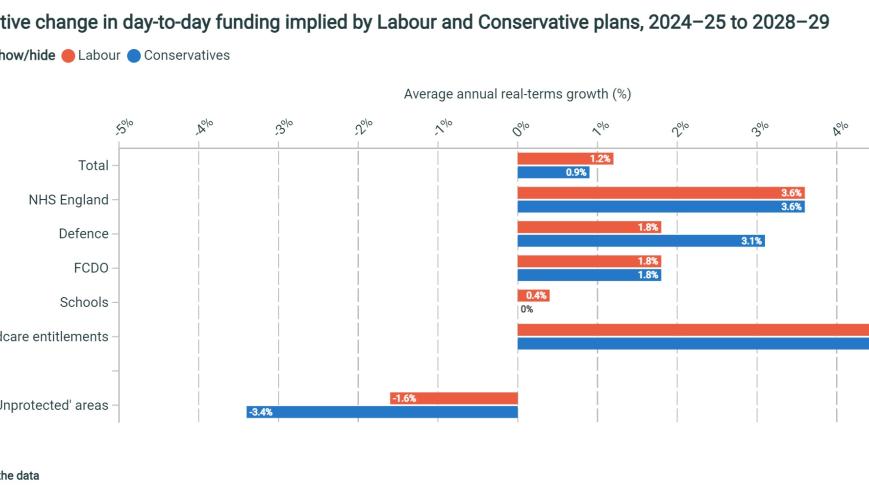
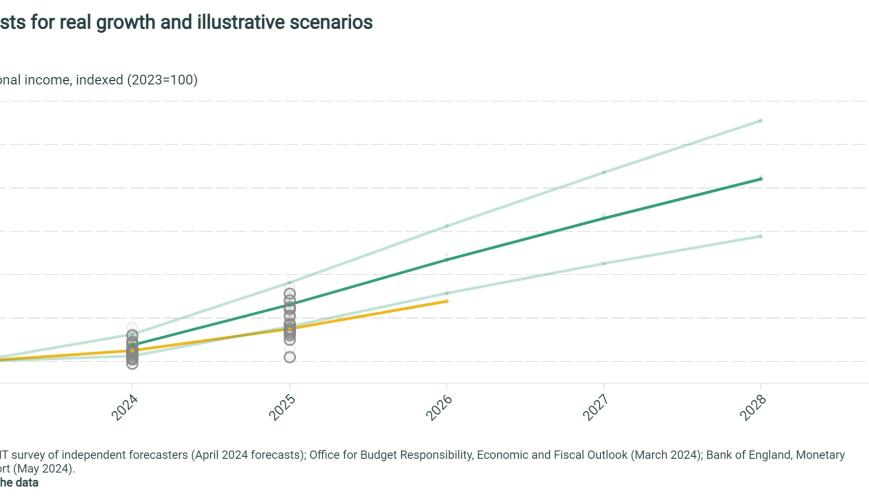
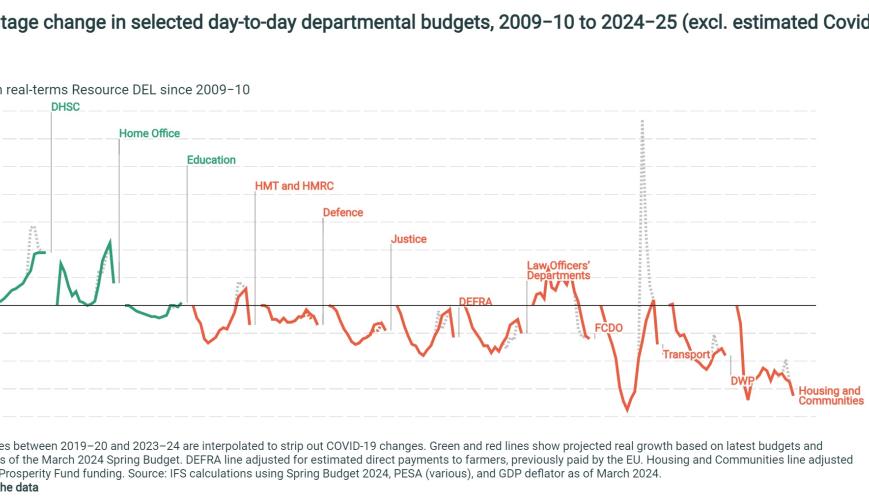
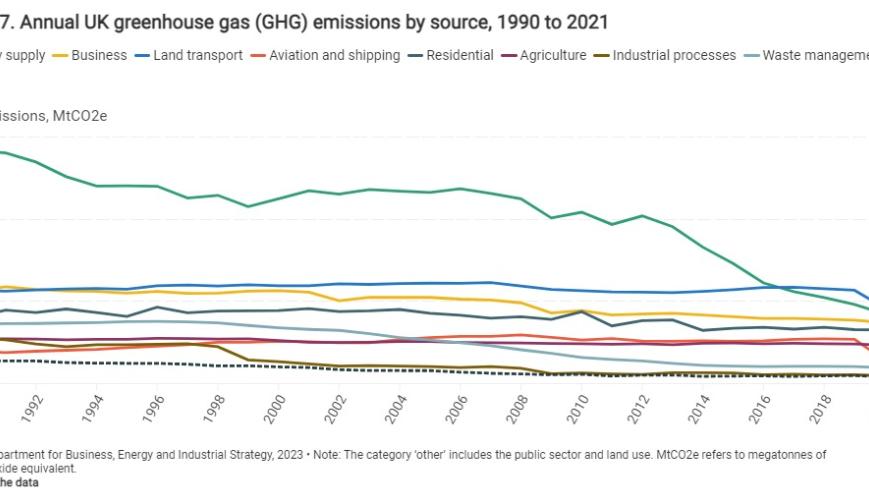
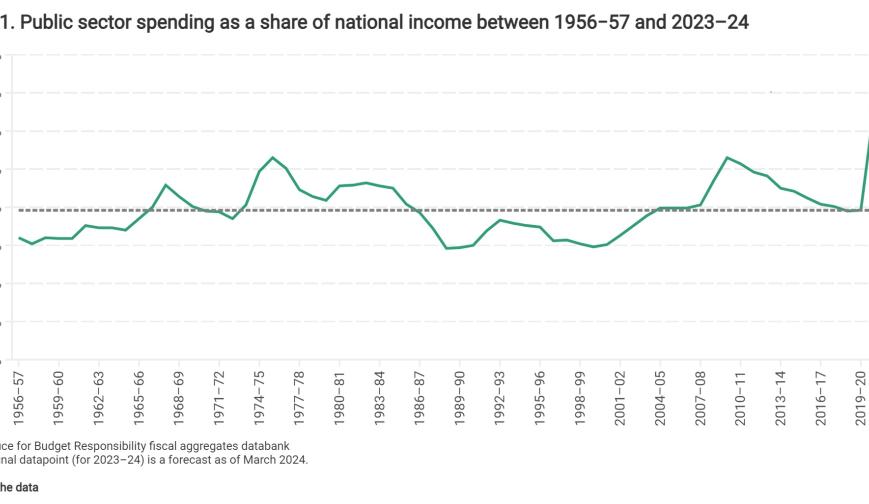
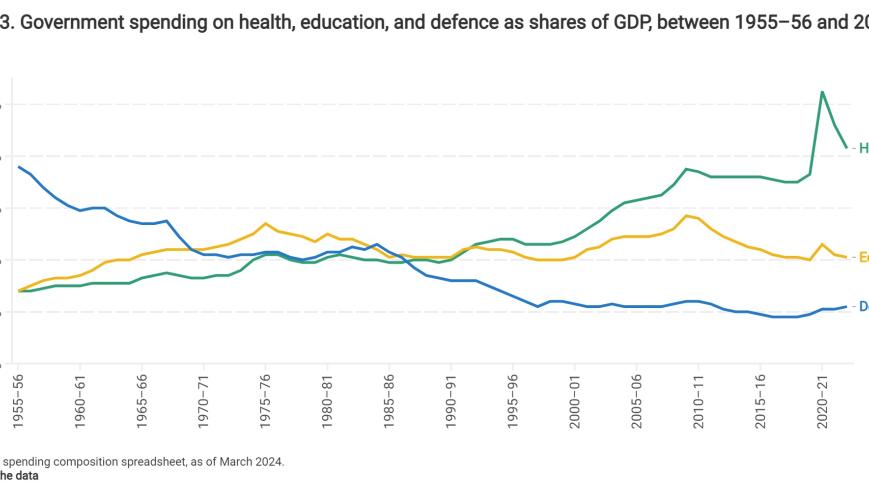
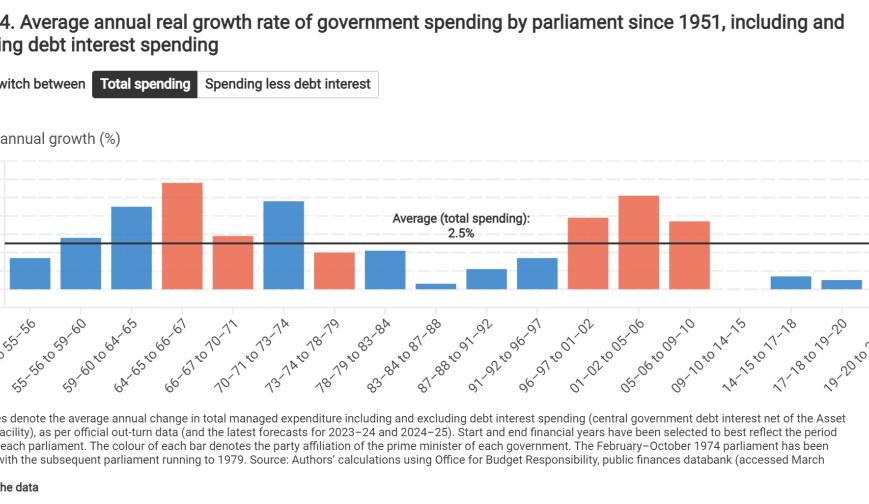
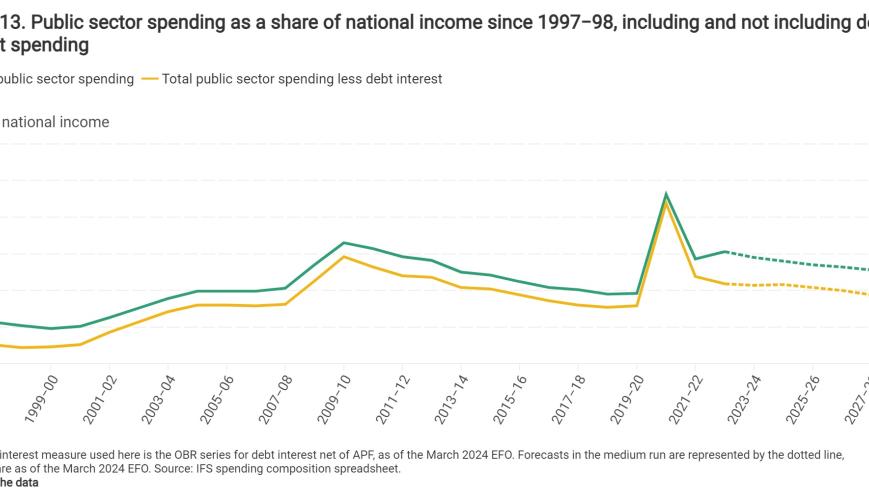
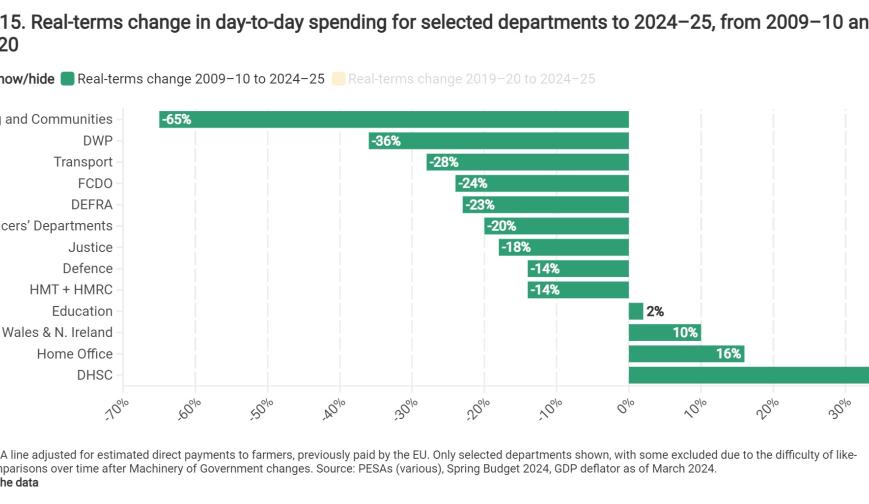
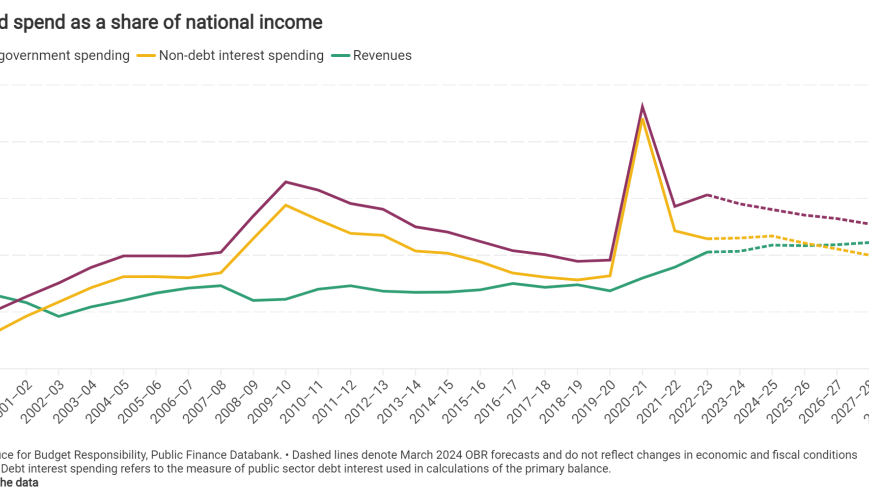
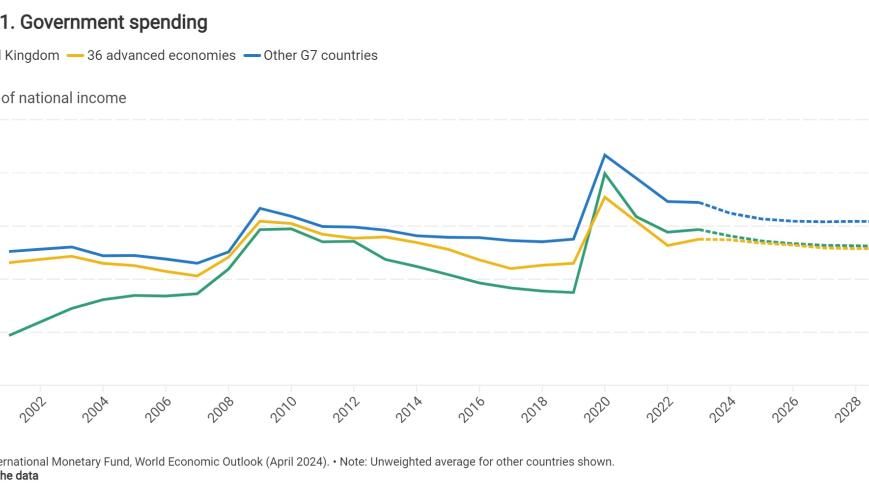
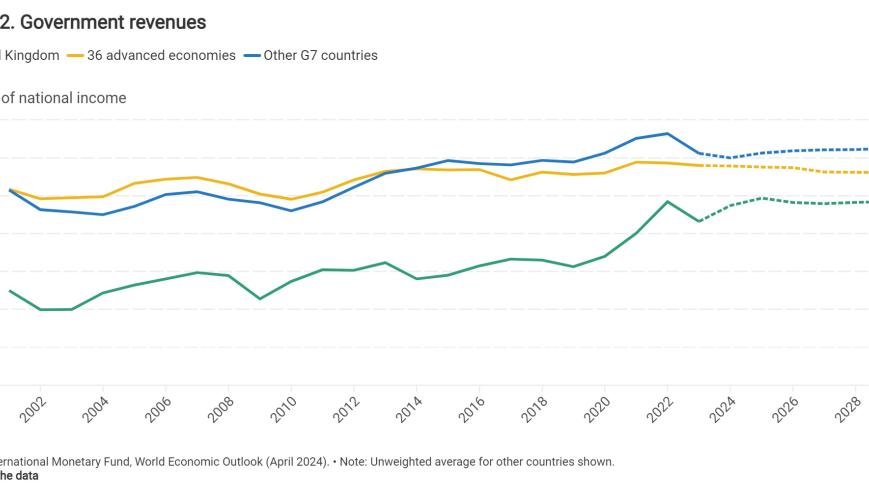
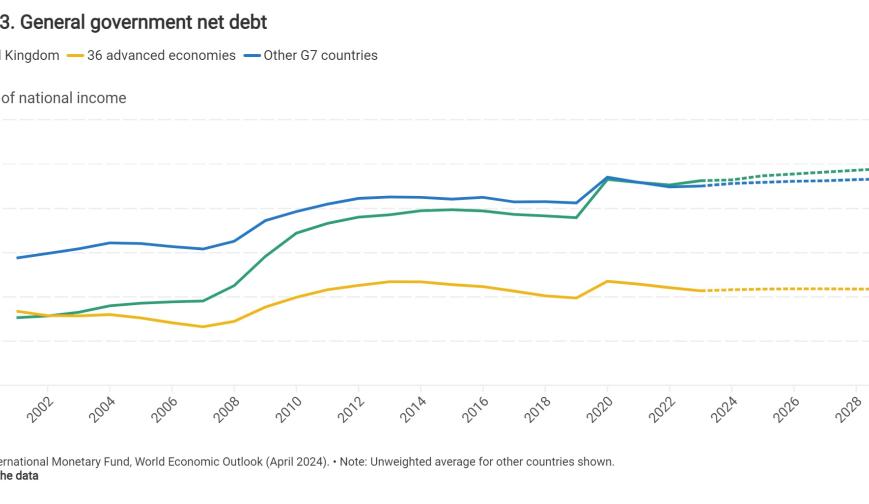
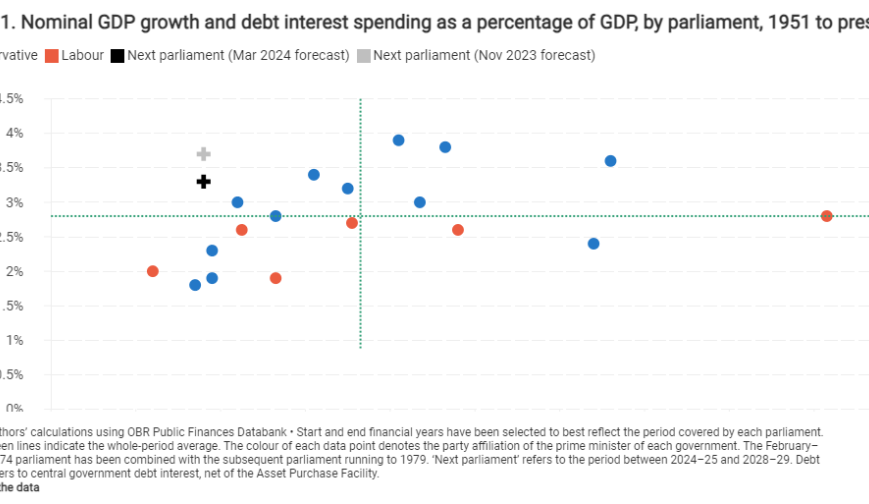
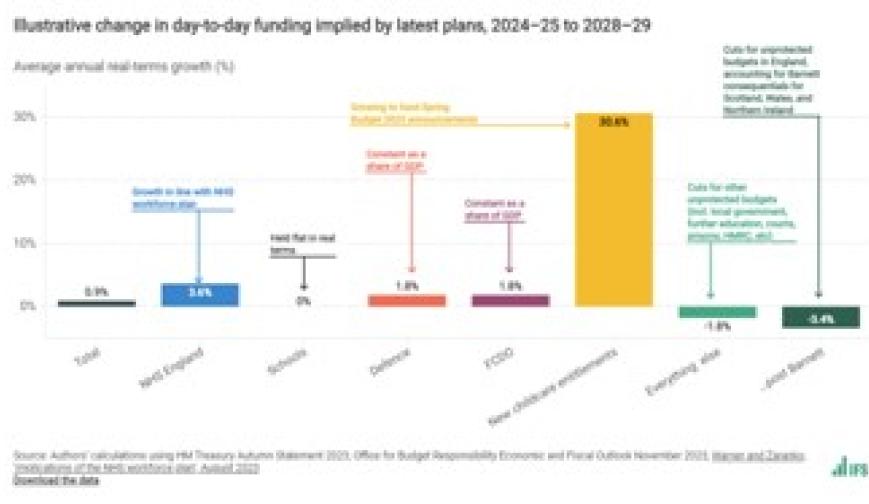
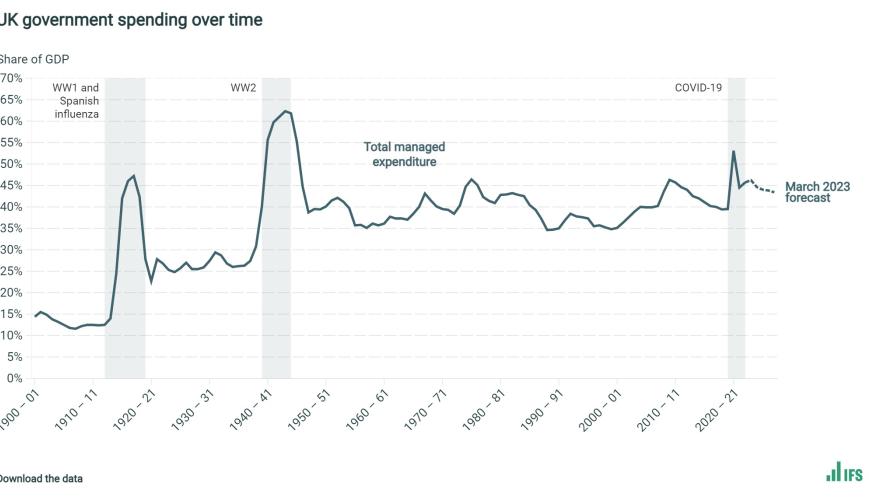
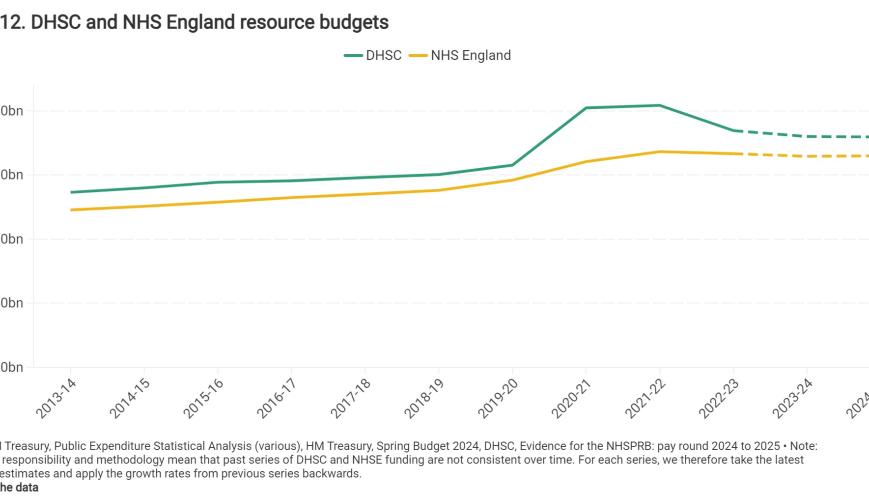
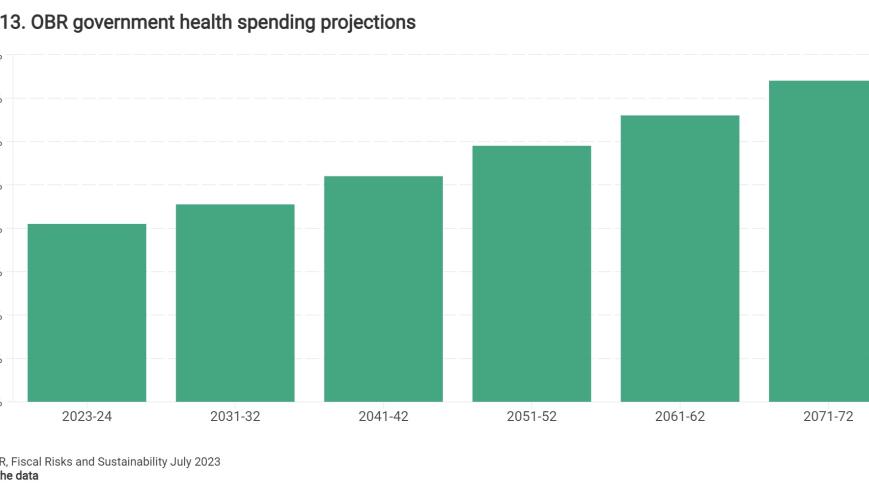
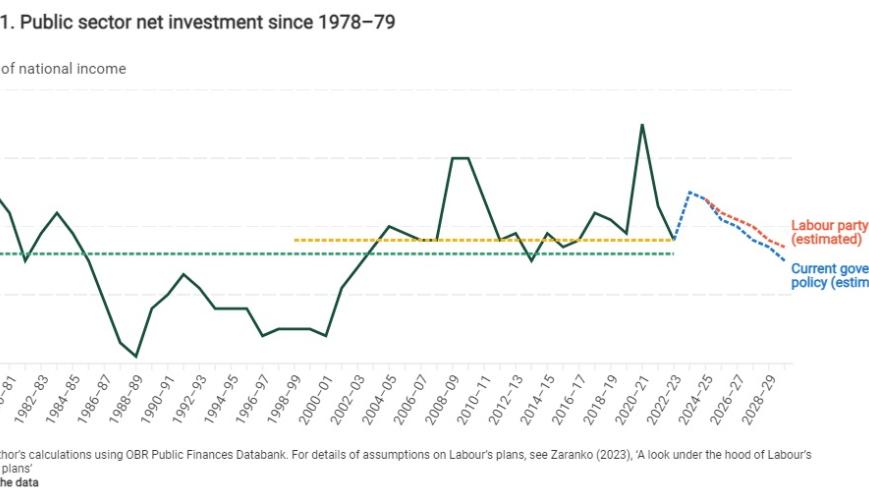
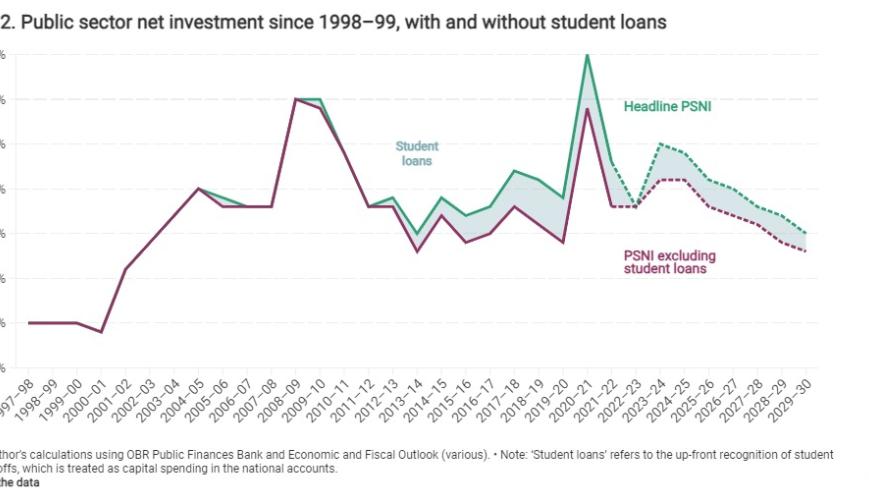
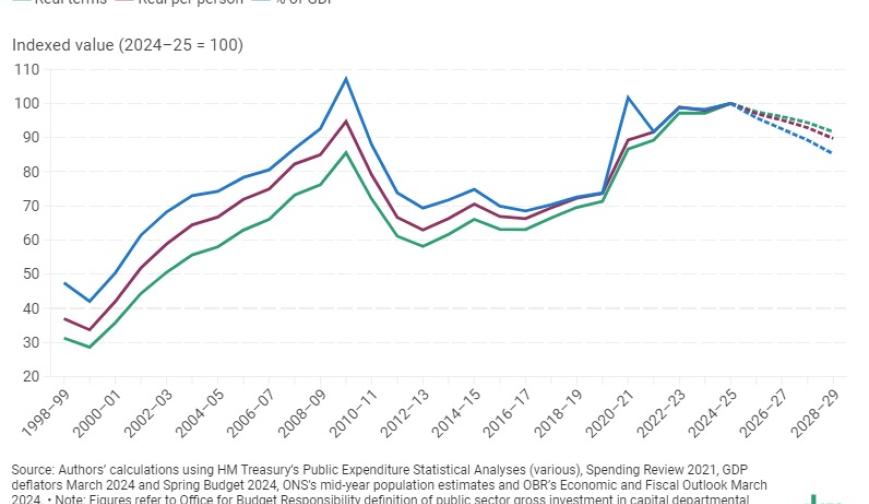
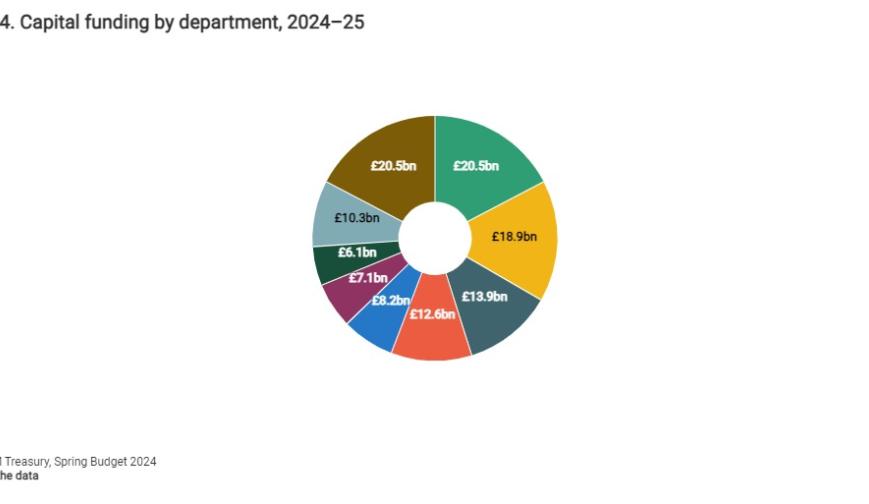
Government finances and spending


Savings, pensions and wealth
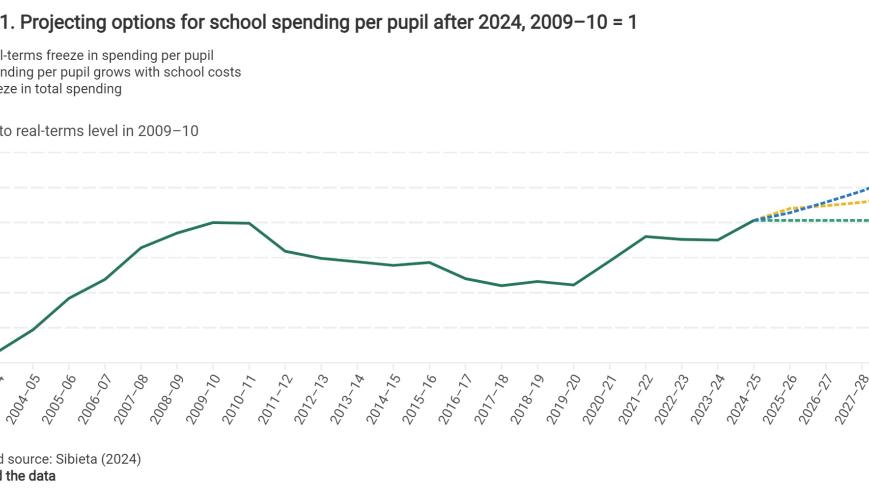
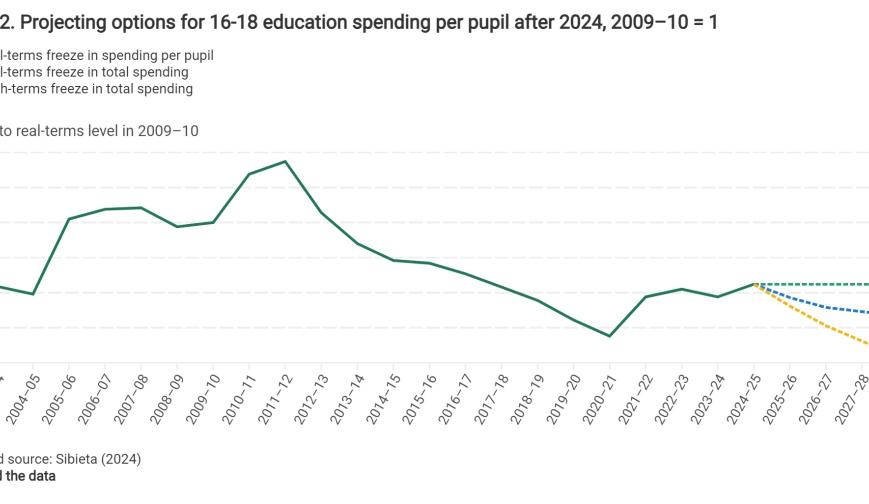
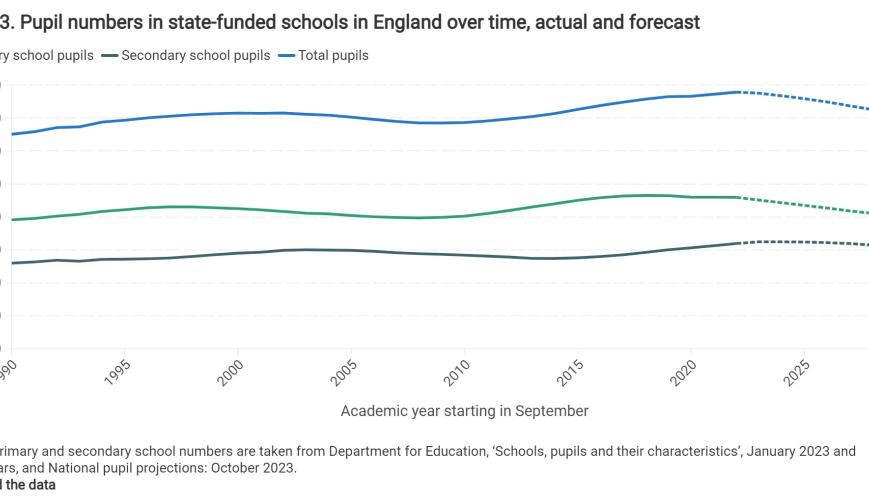
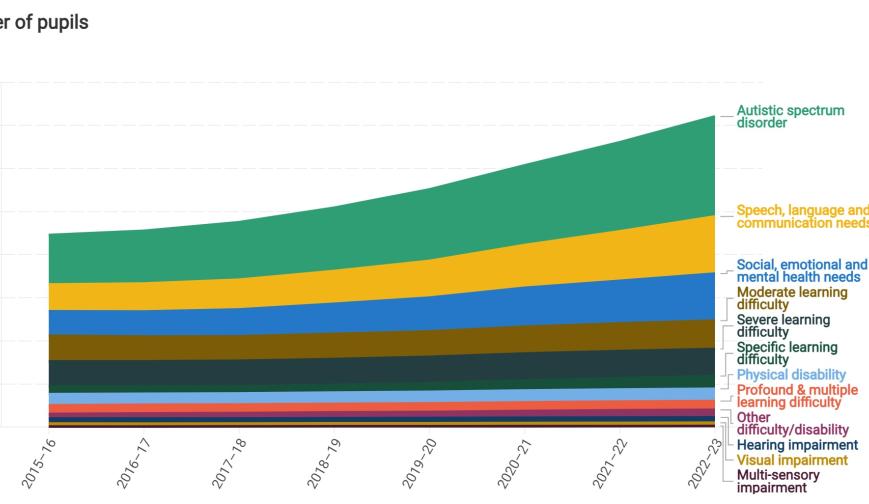
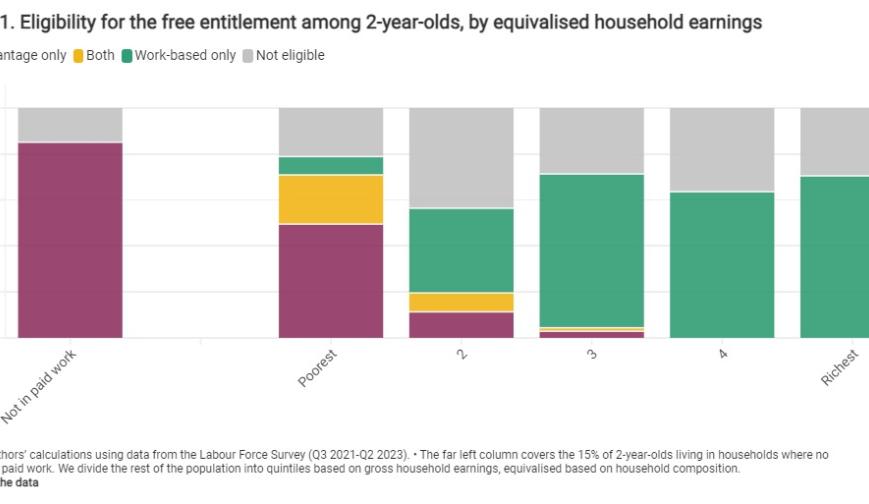
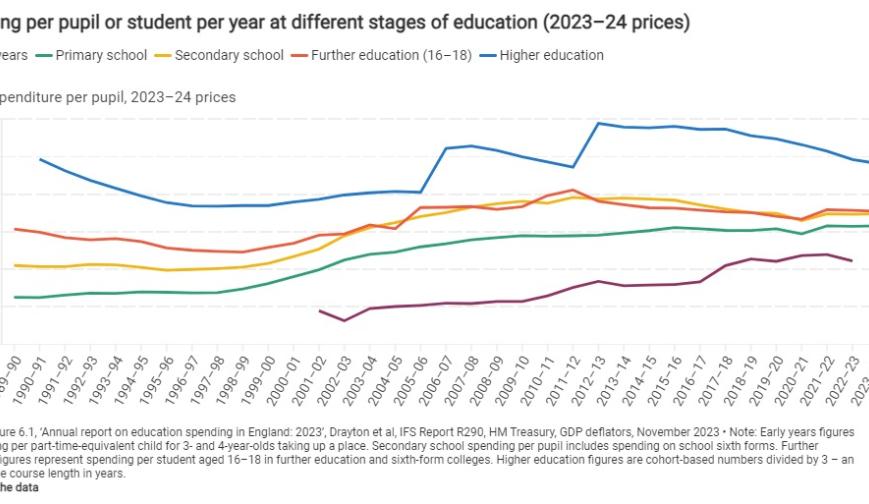
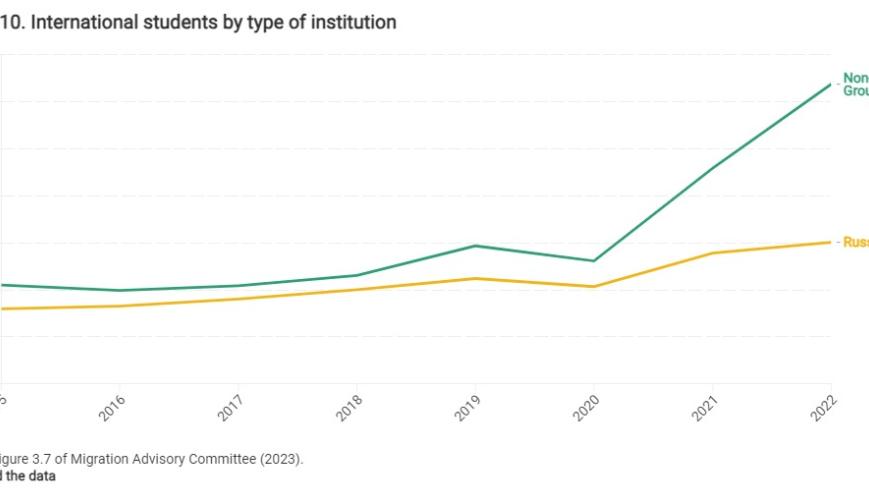
Education and skills


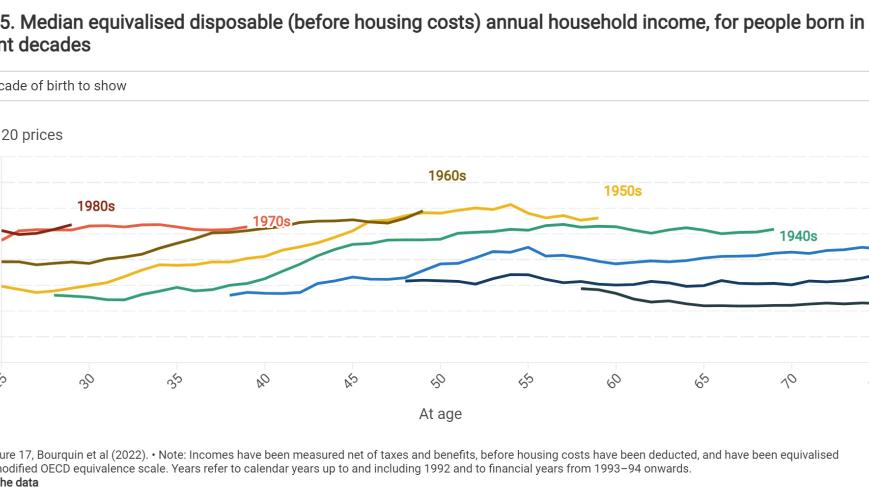
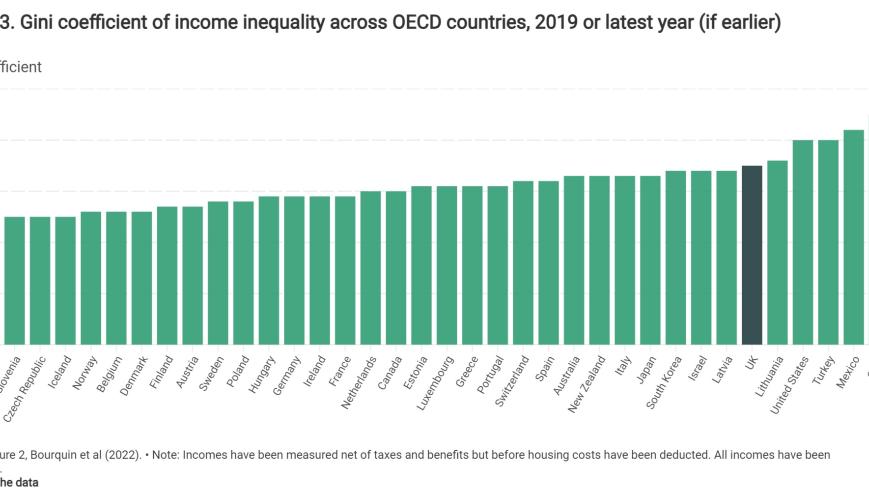
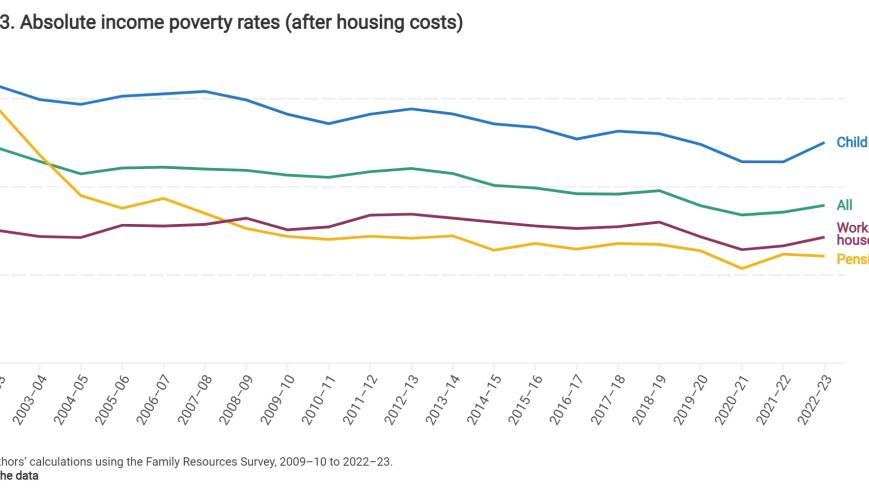
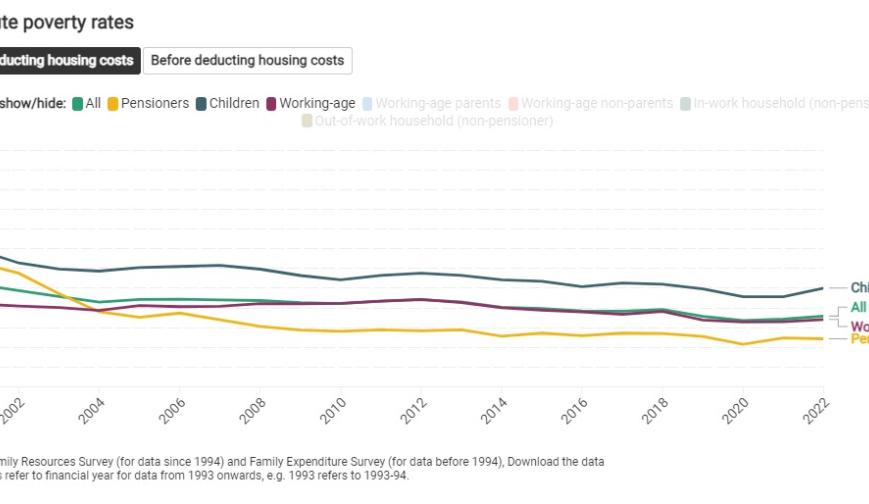
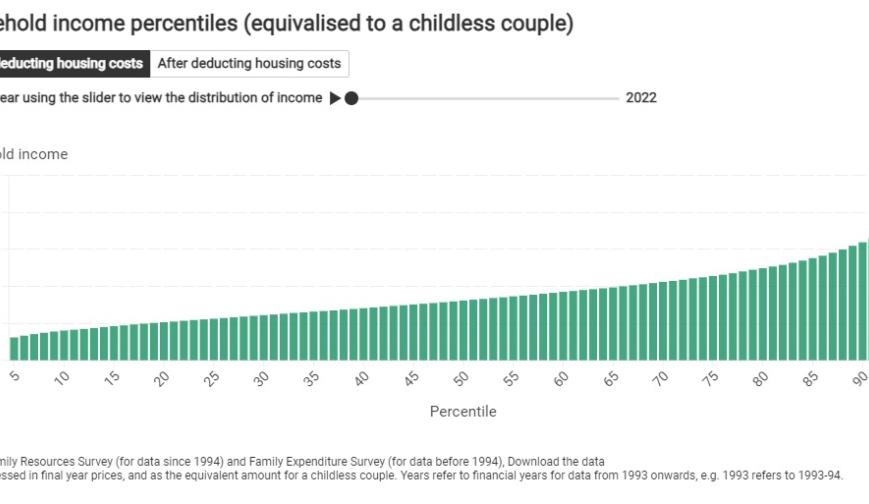
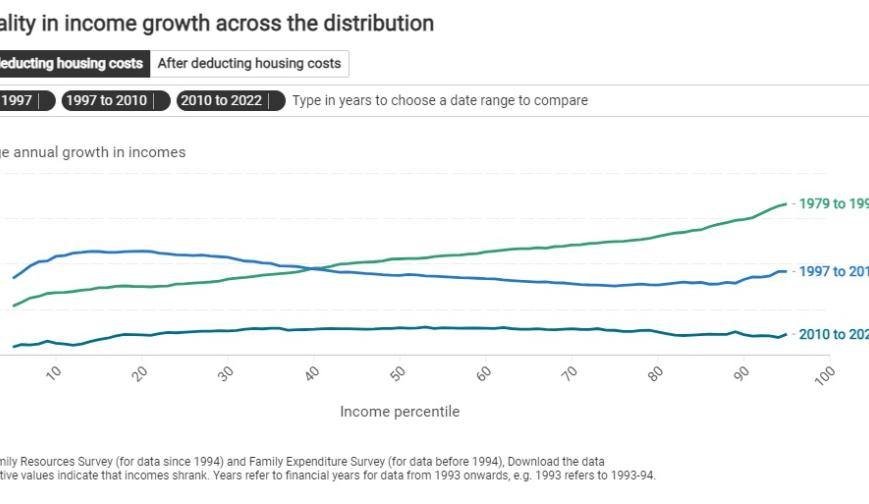
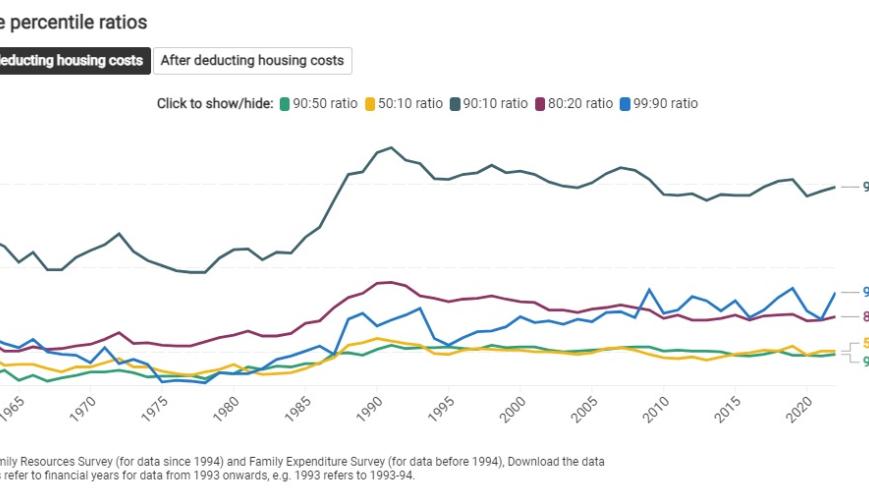
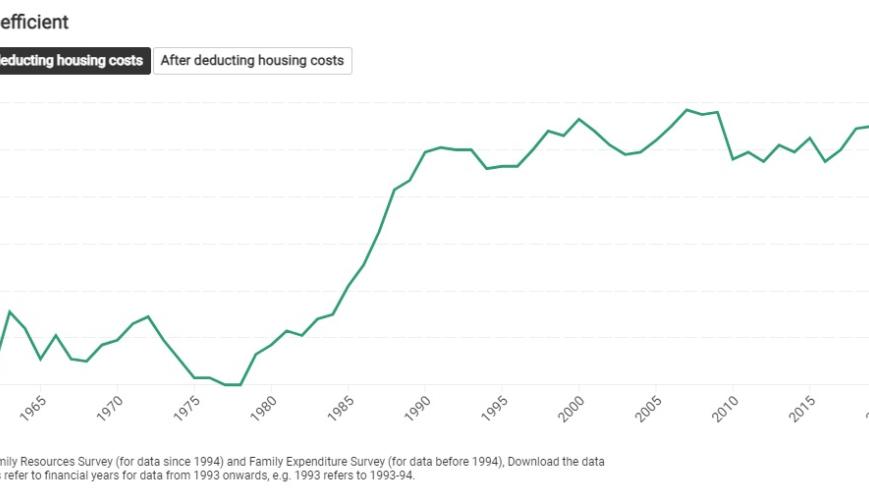
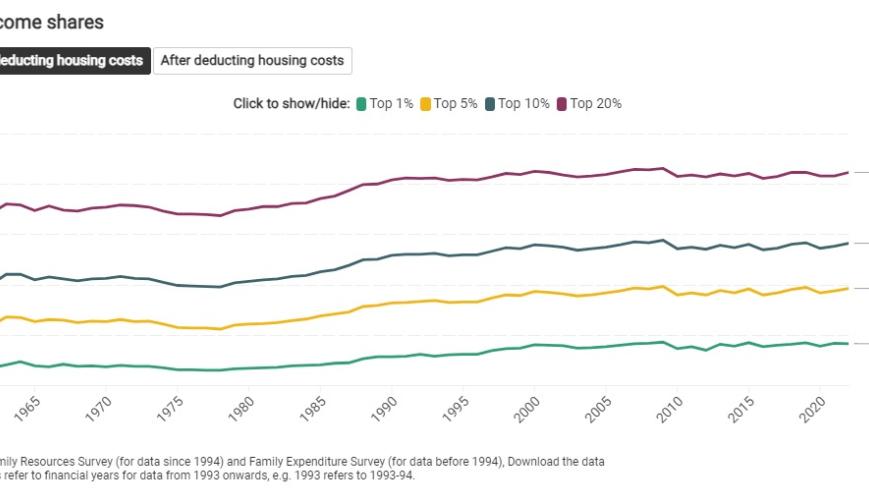
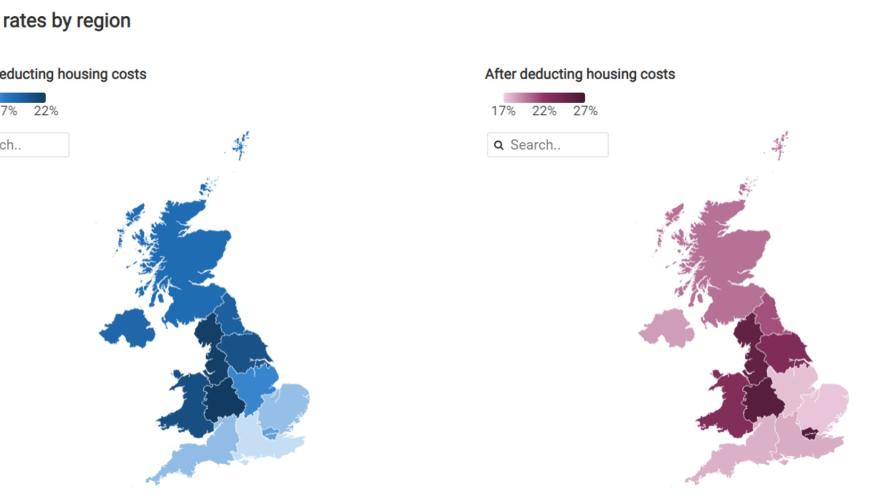
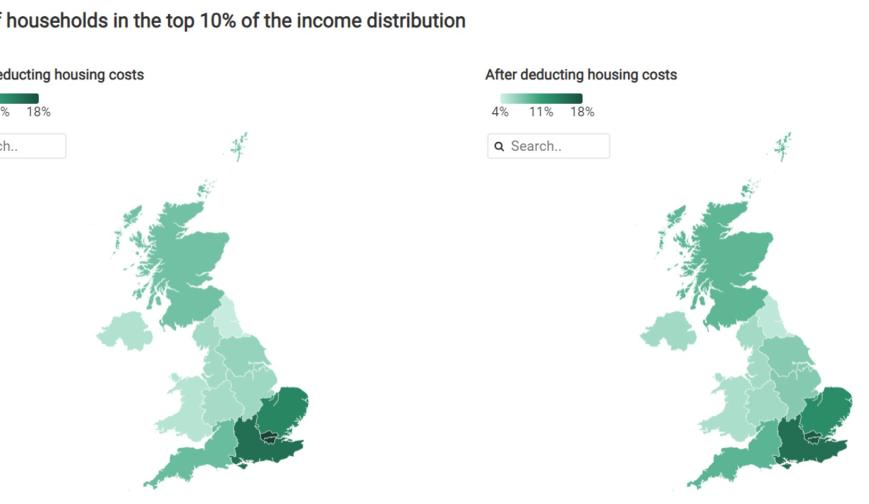
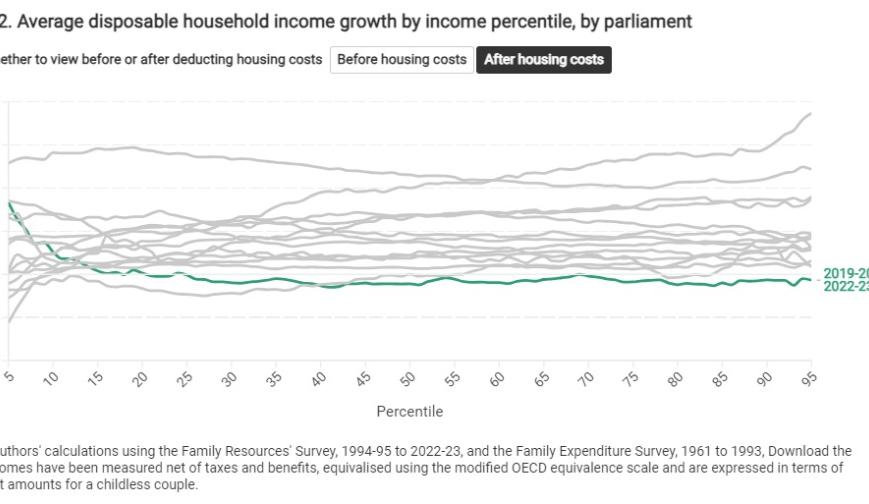
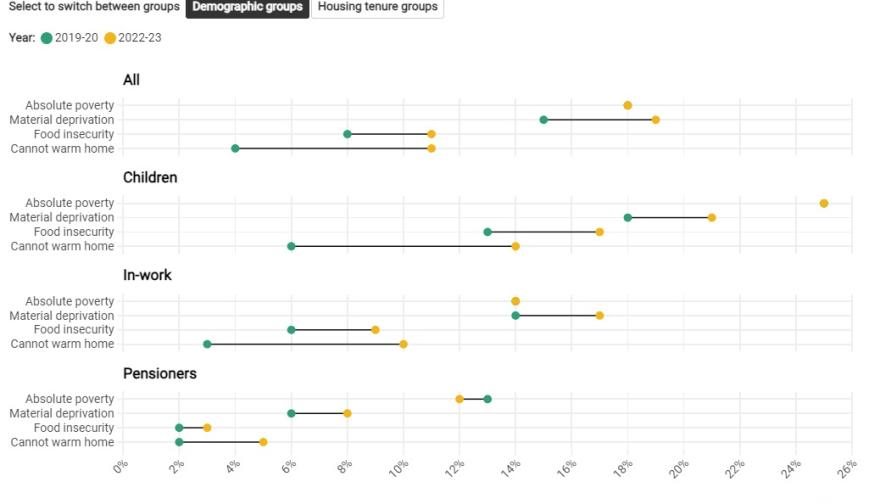
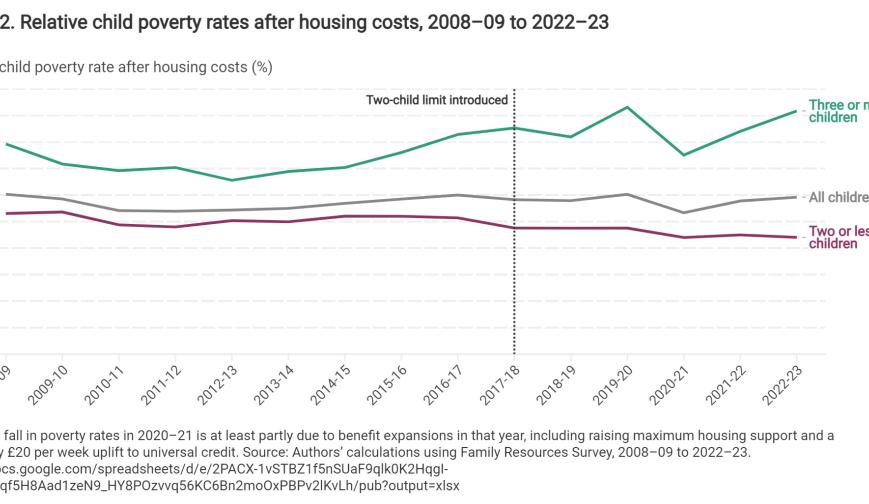
Poverty, inequality and social mobility


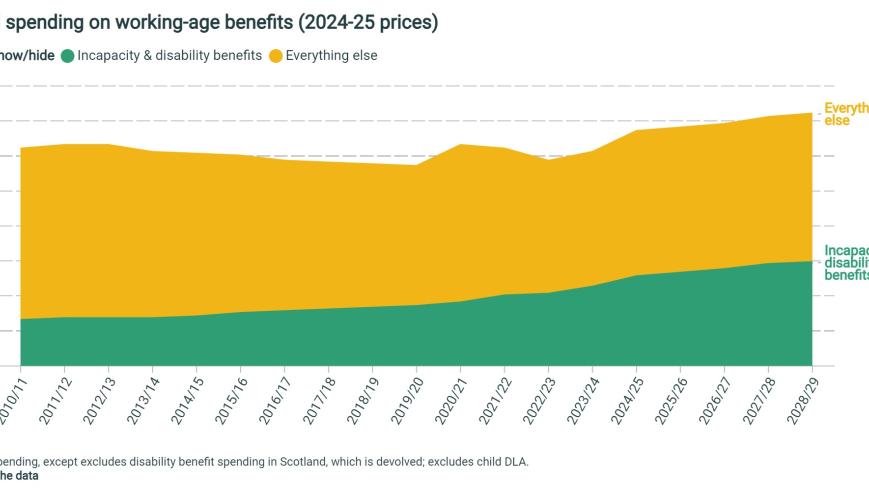
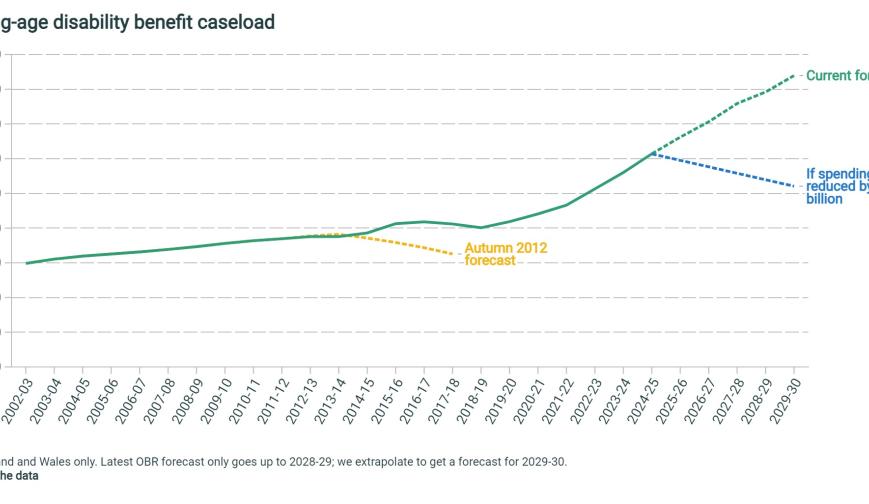
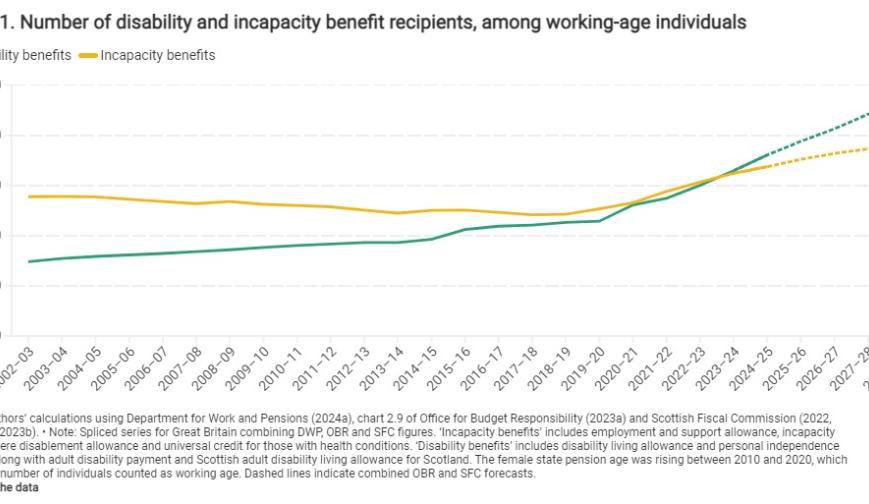
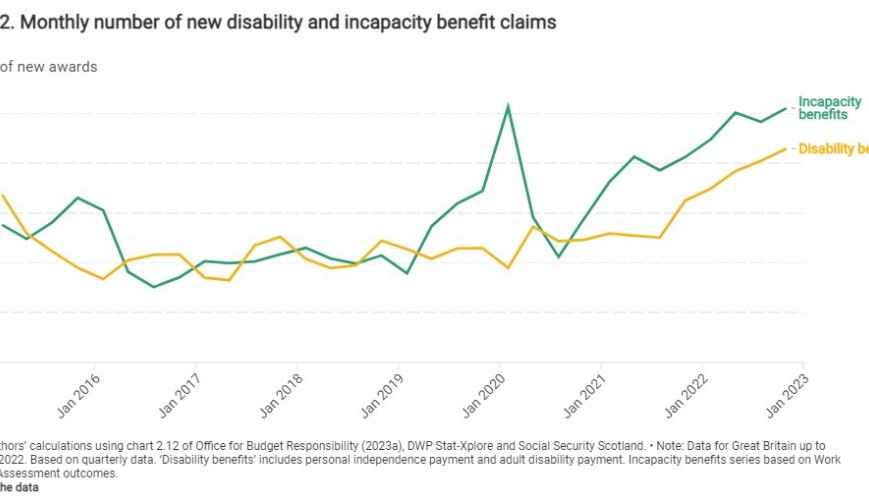
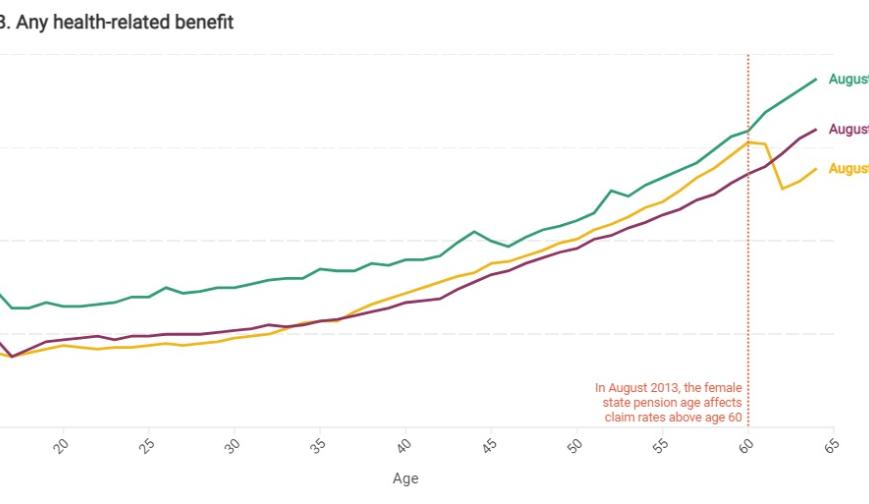
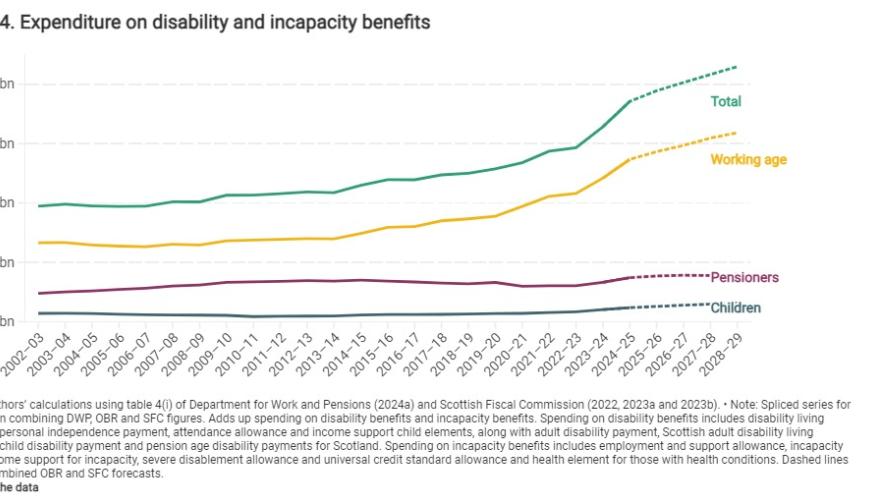
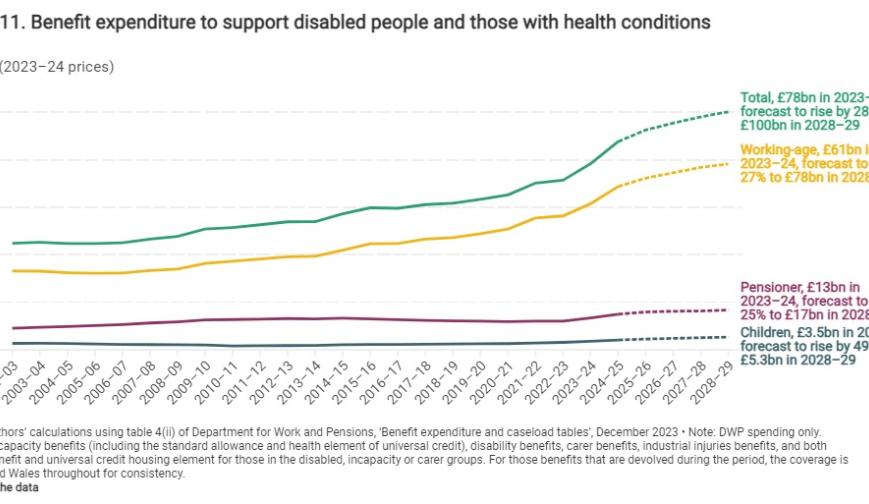
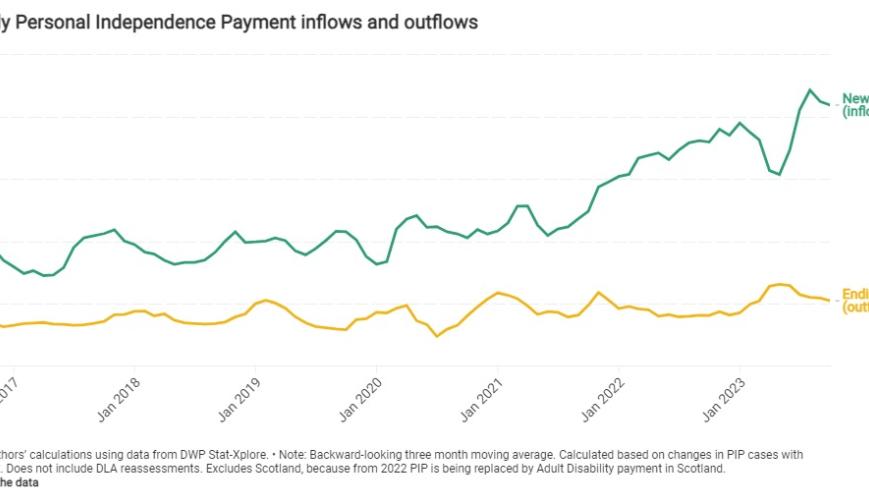
Benefits


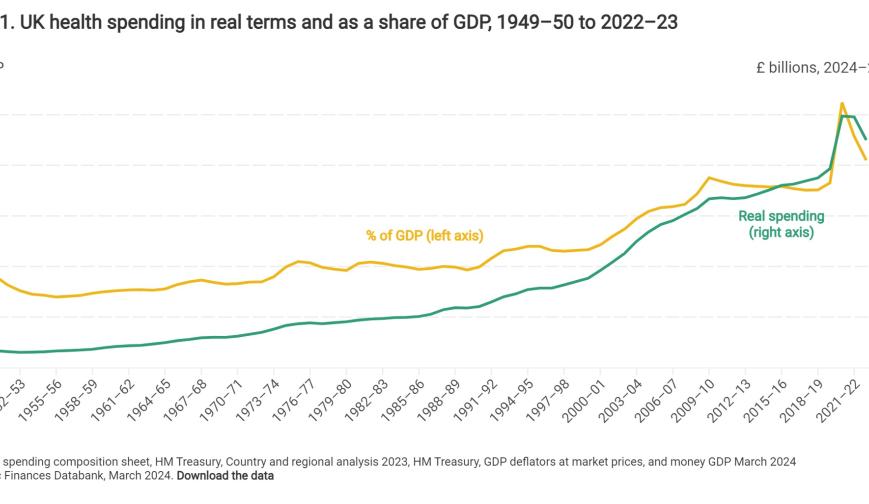
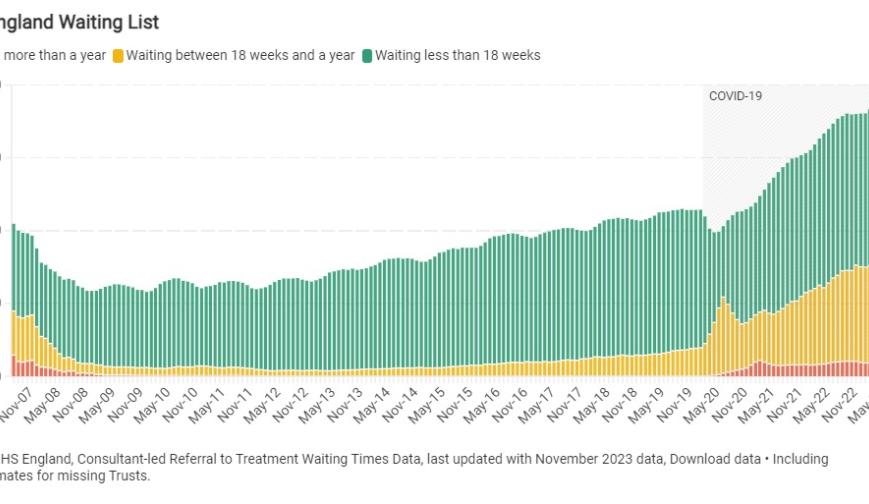
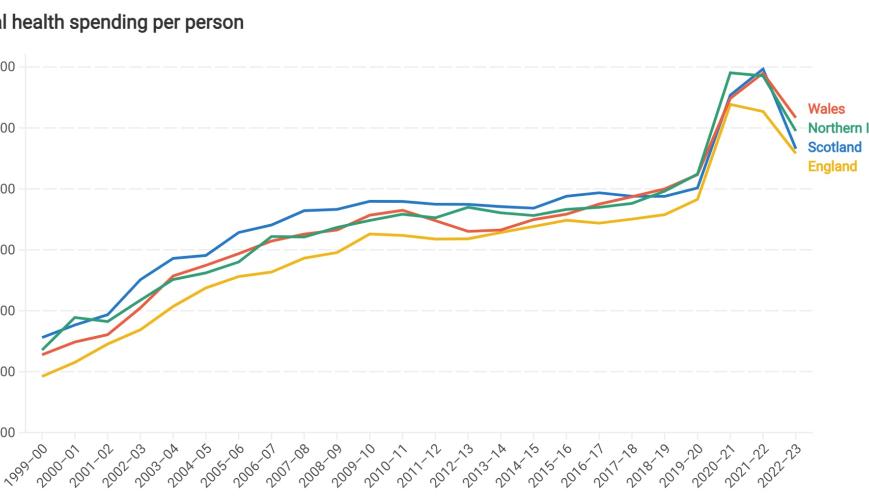
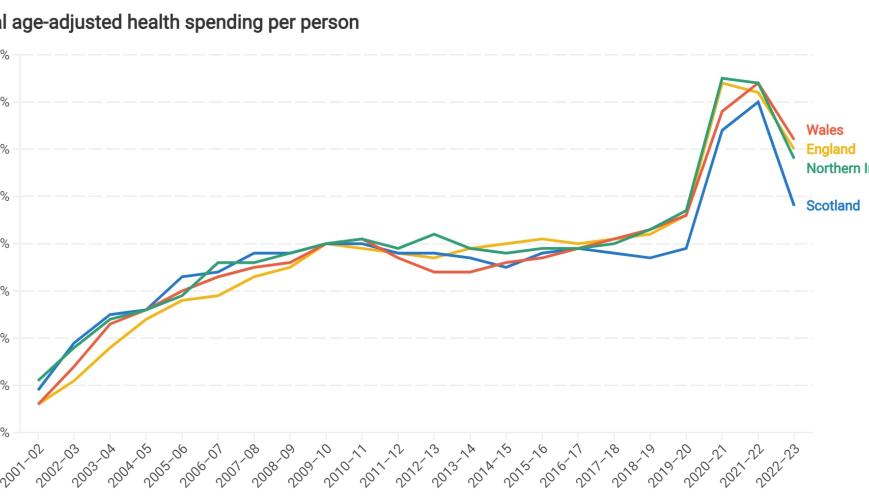
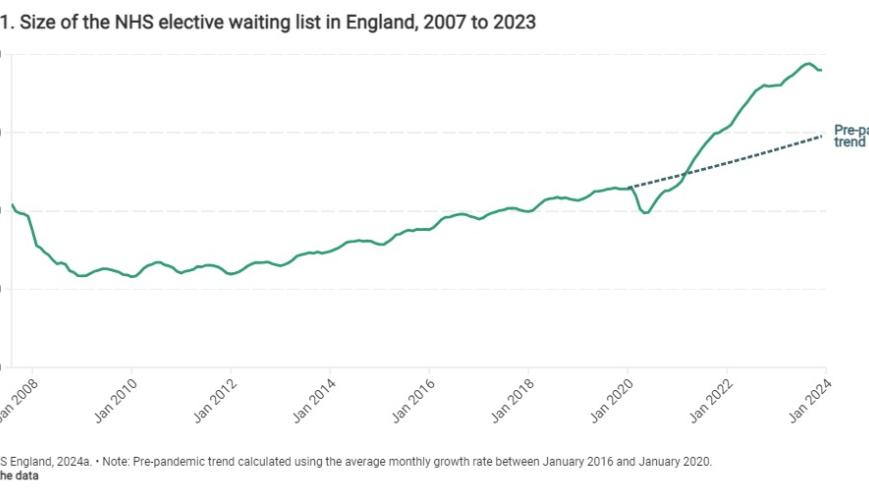
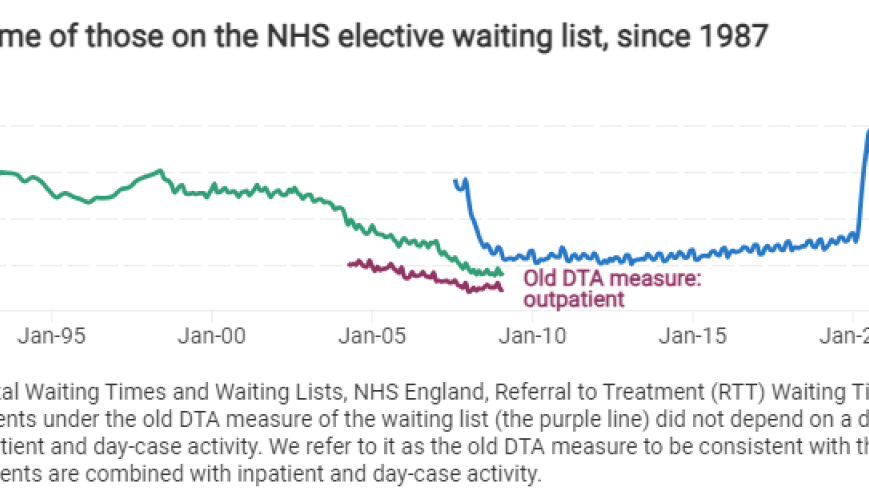
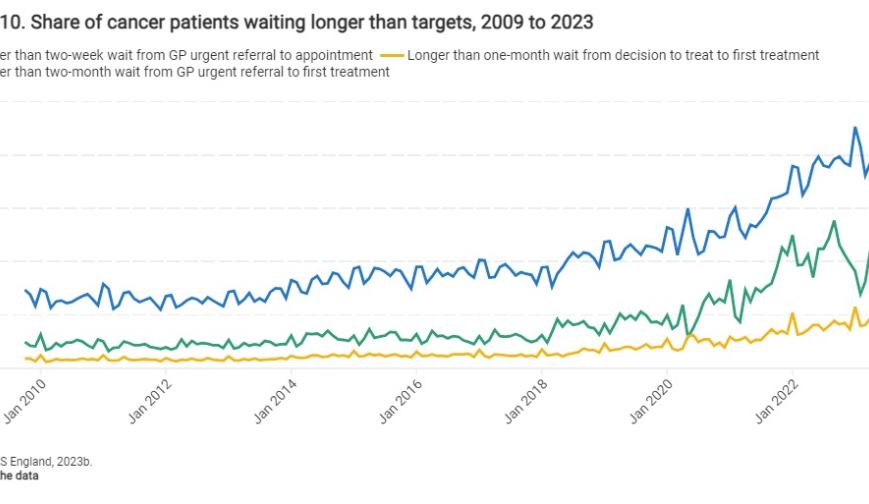
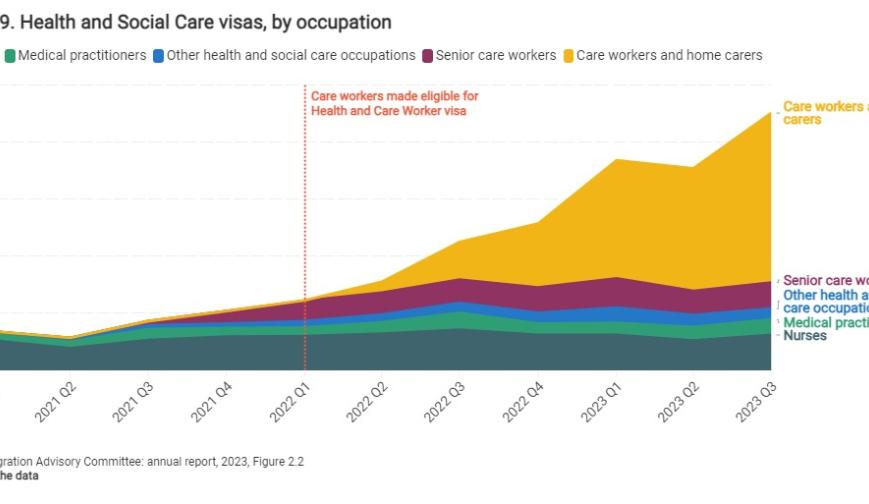
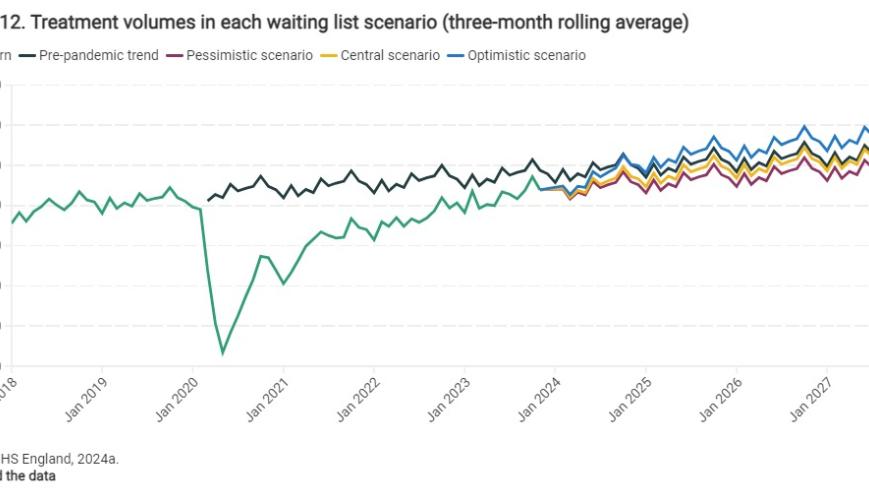
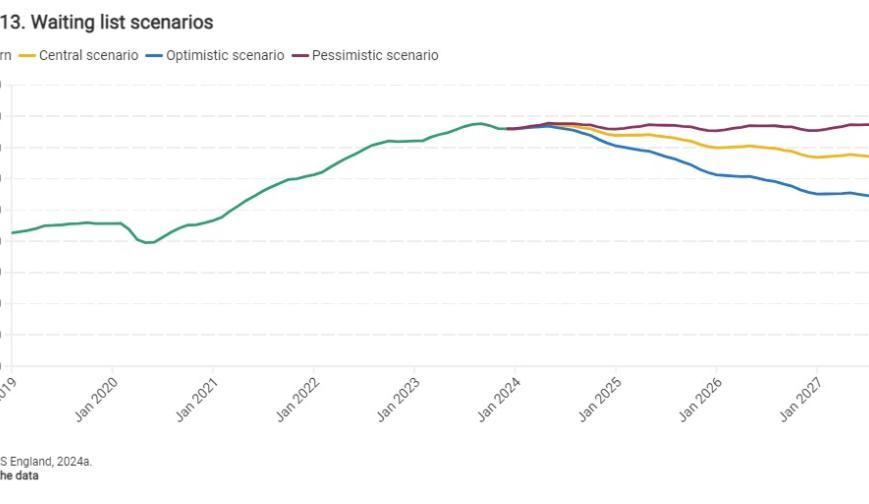
Health and social care


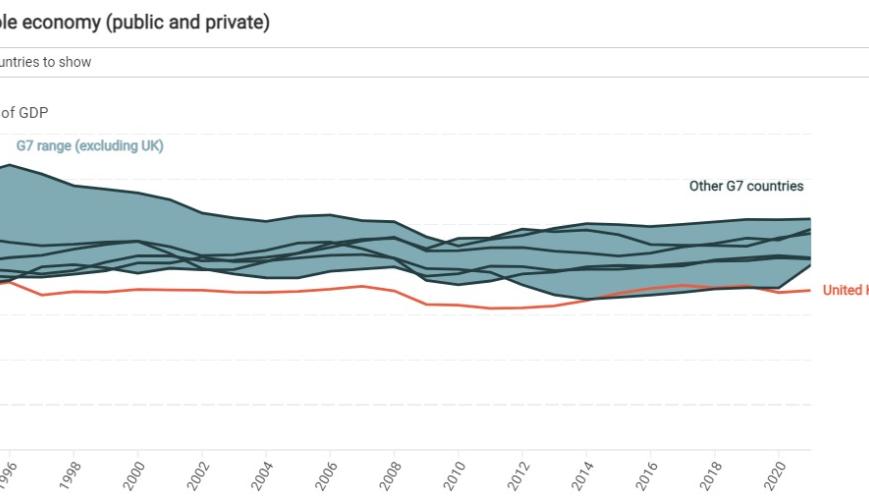
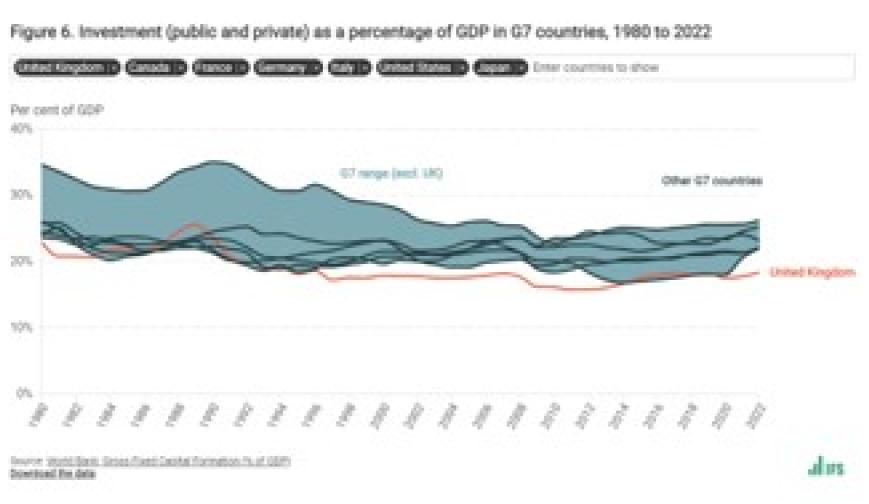
Business and investment
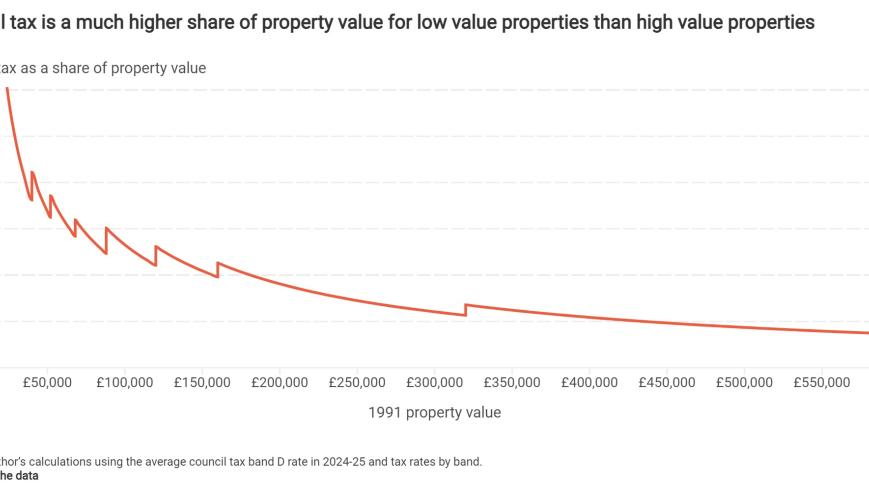
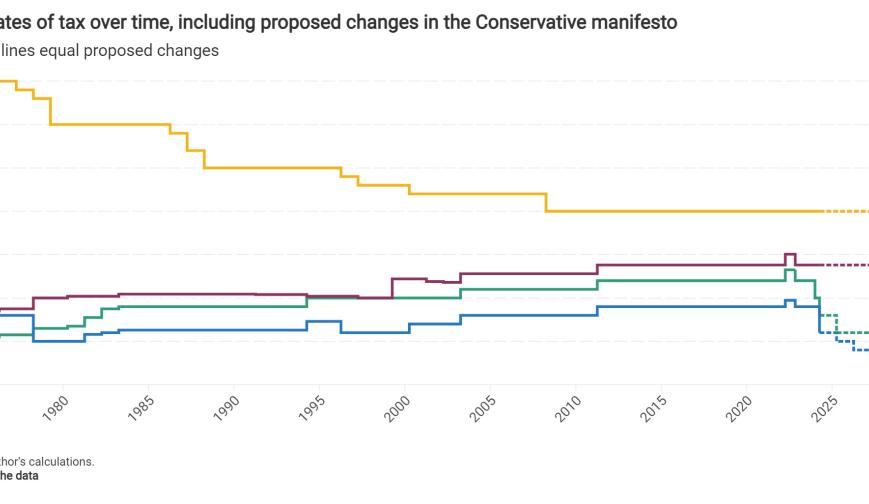
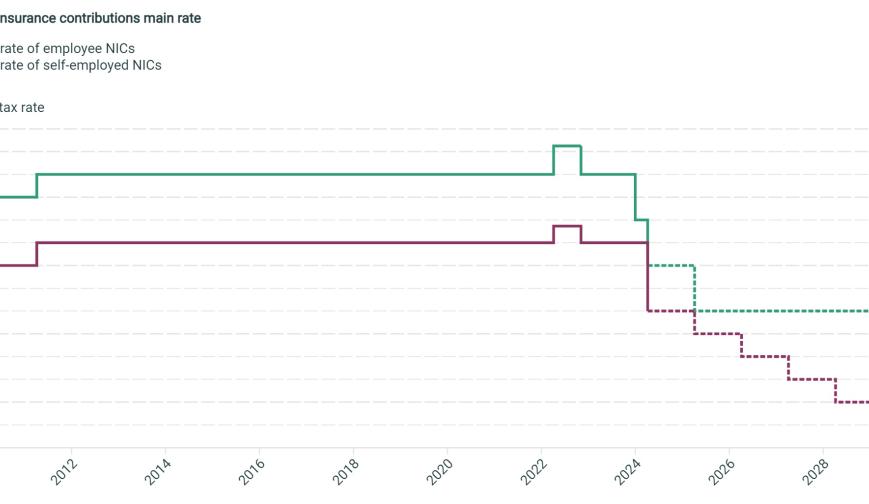
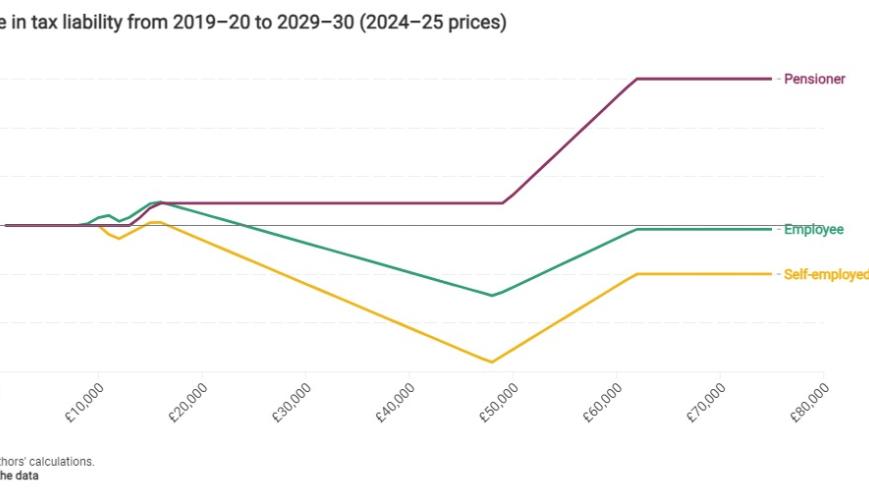
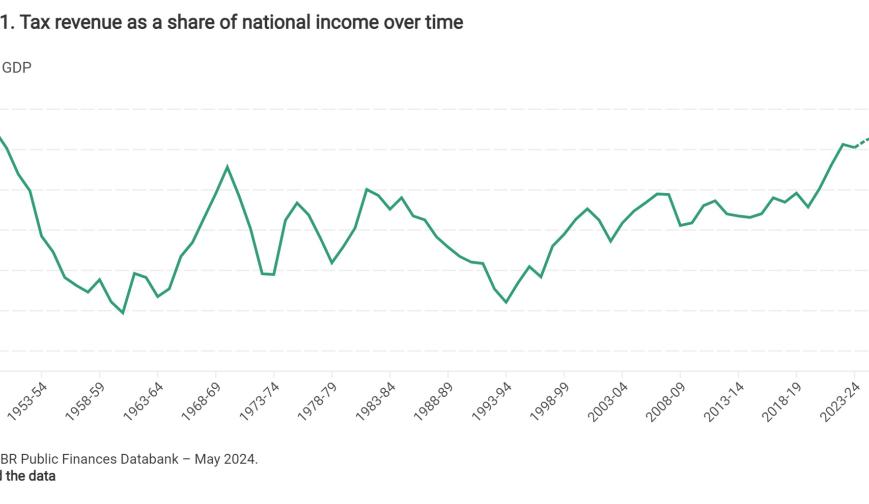
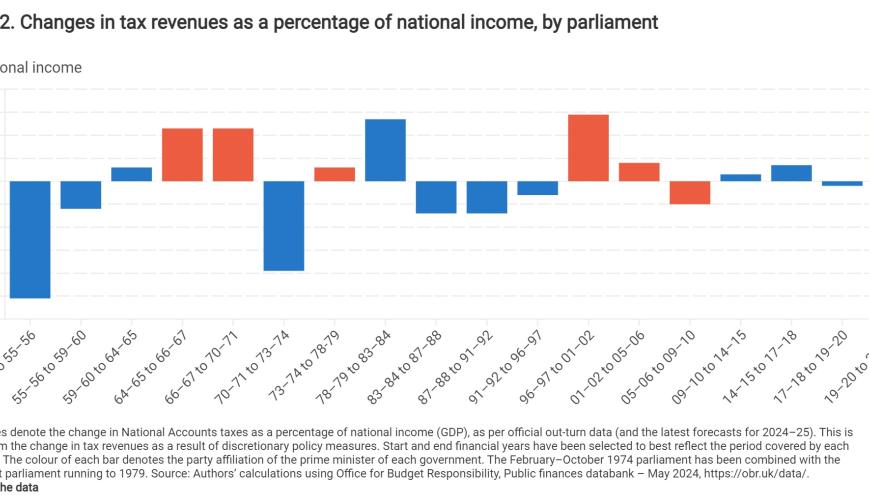
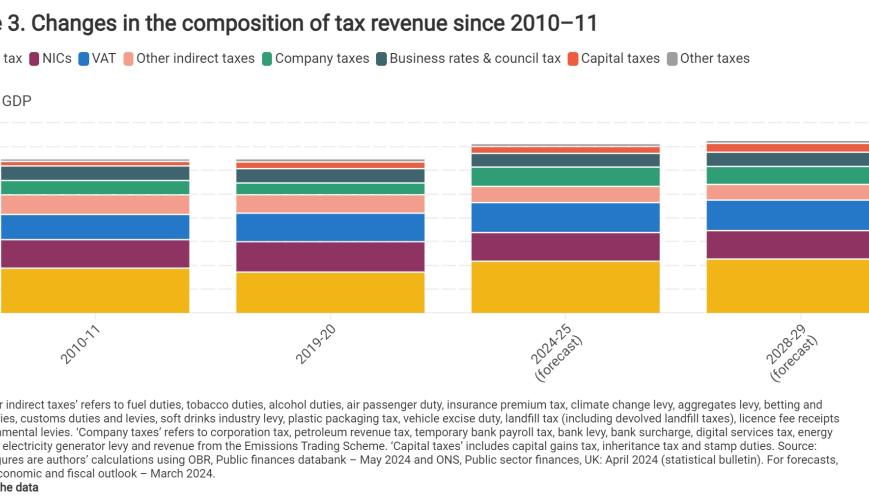
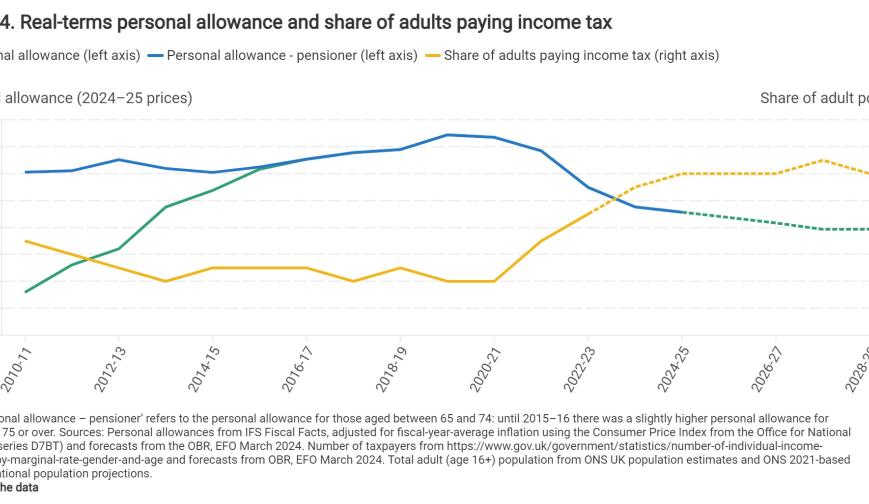
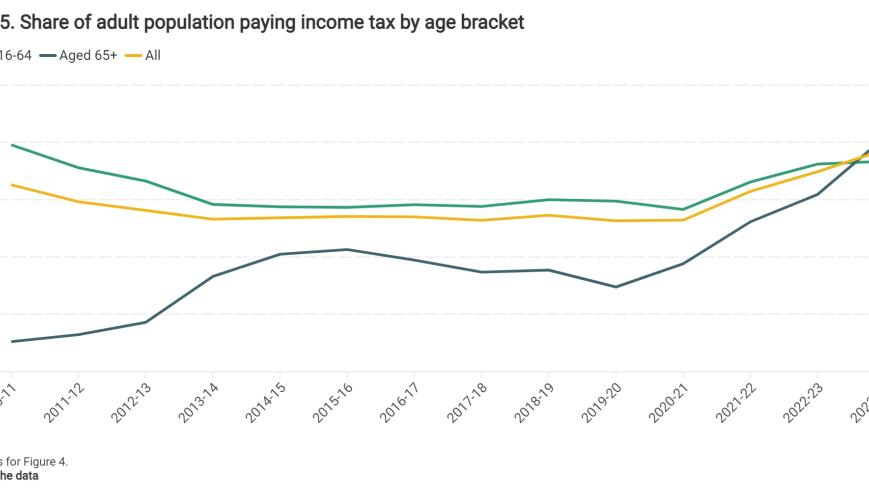
Tax


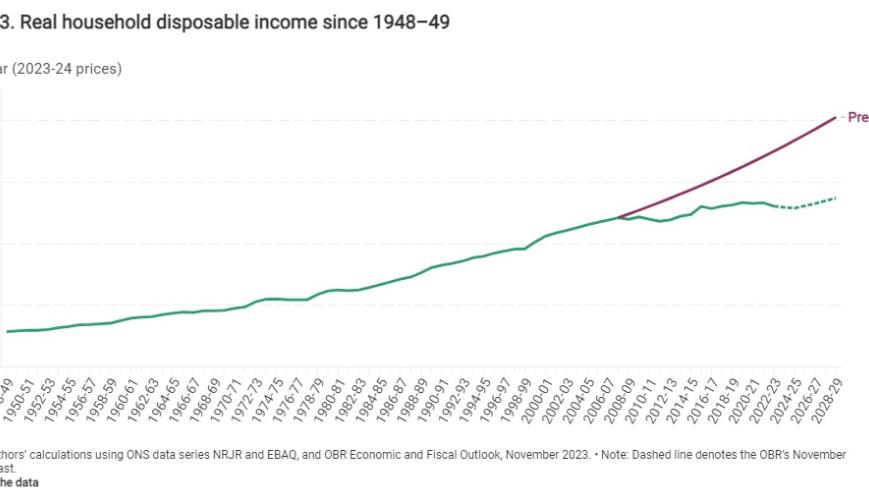
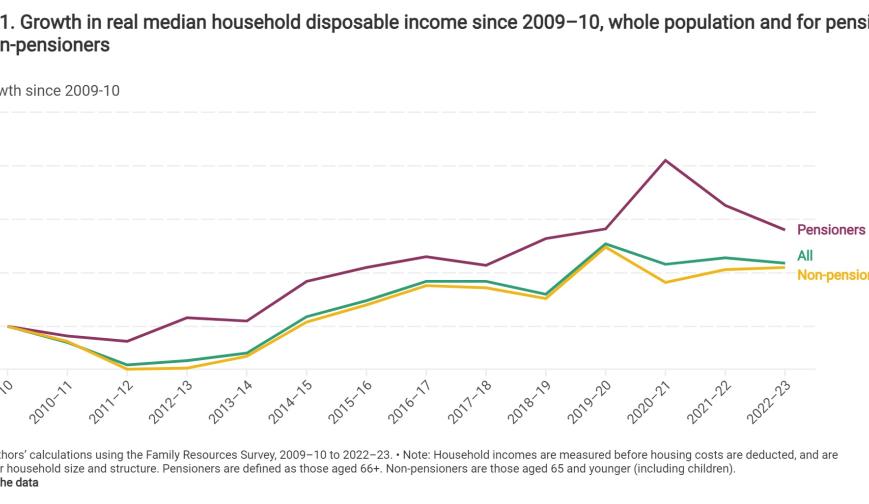
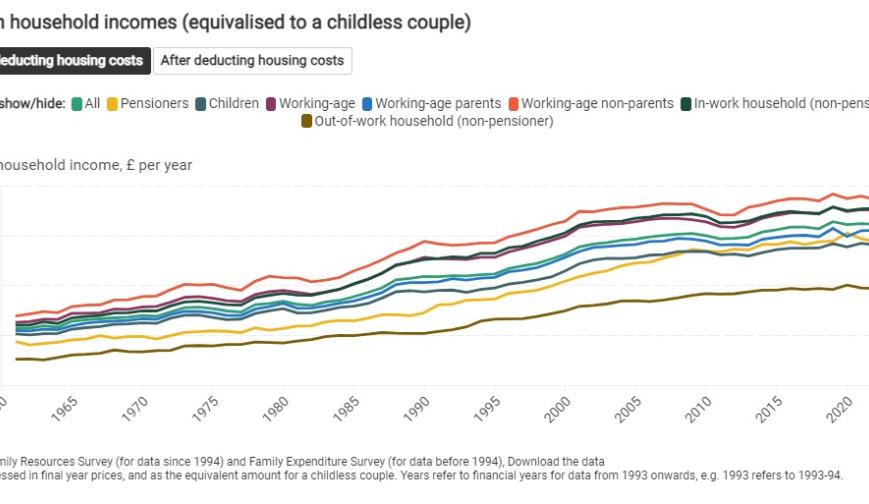
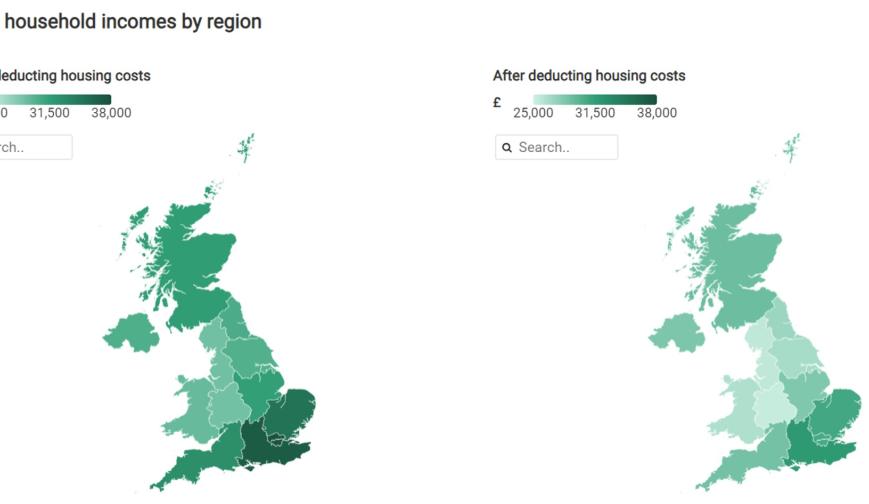
Employment and income

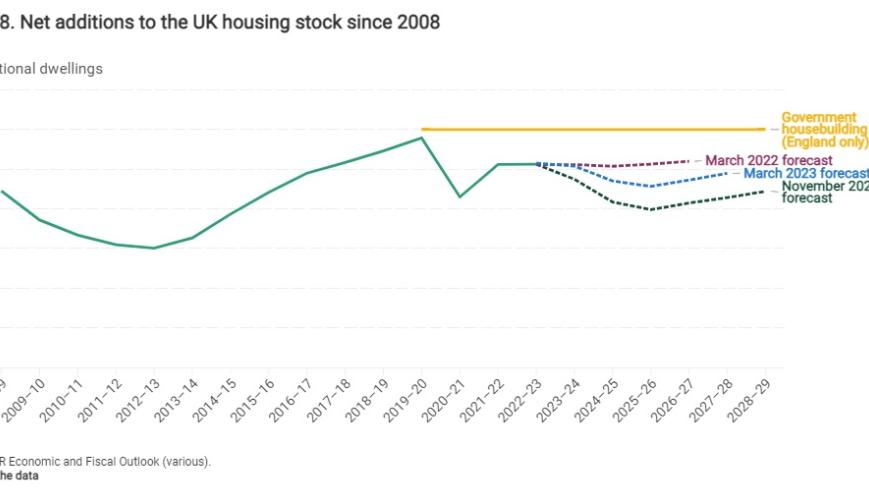
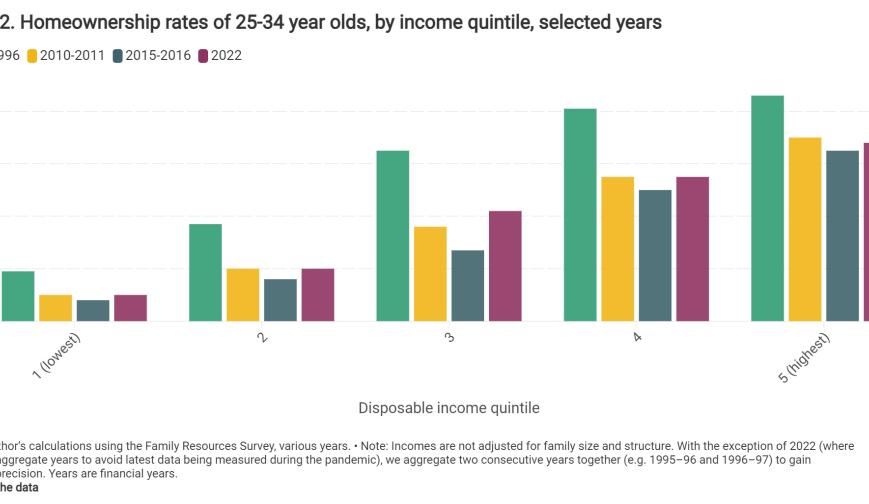
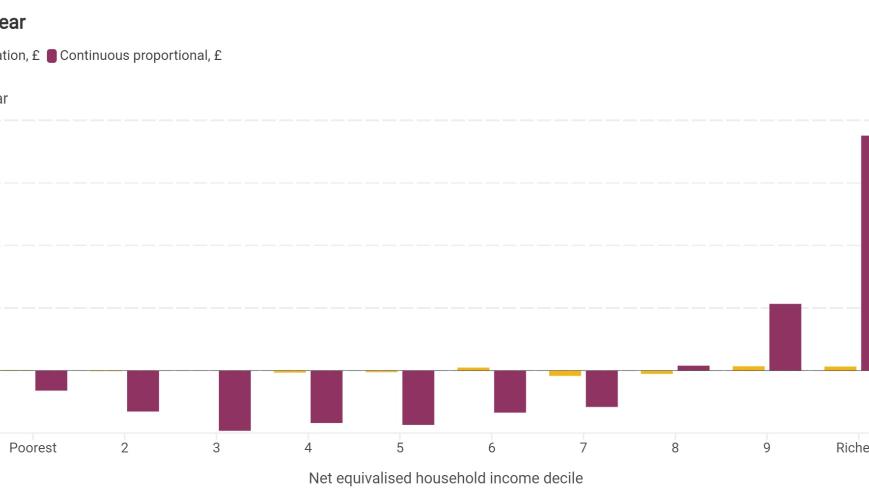
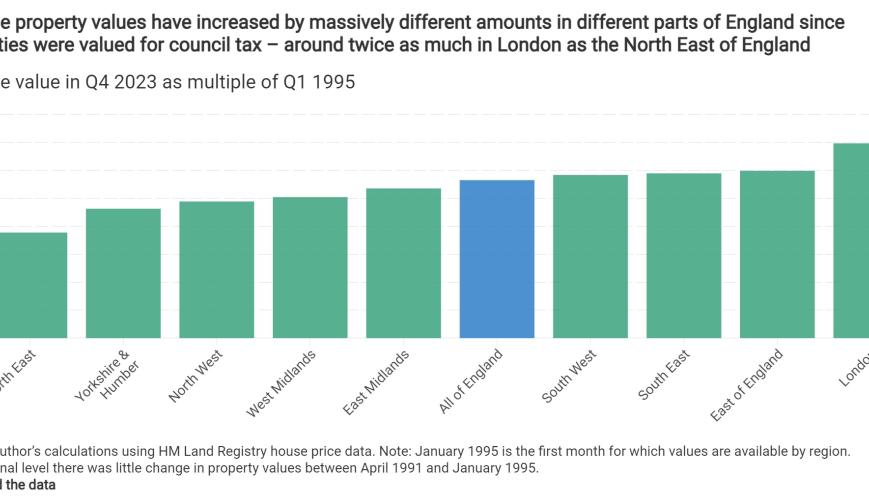
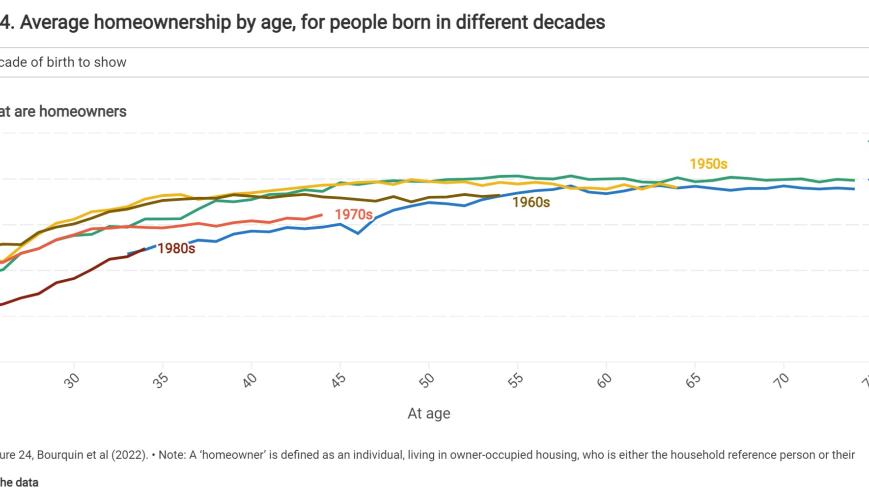
Housing