Downloads
GB2019-Chapter-8-Options-for-cutting-direct-personal-taxes.pdf
PDF | 446.26 KB
Key findings
- Raising the higher-rate income tax threshold (and the National Insurance contributions thresholds that are aligned with it) from £50,000 to £80,000 in 2020–21 would cost £9 billion per year and cut taxes for the highest-income 8% of individuals. The cost of the policy would be lower, both in the short and long run, if the threshold were raised more gradually. For example, an £80,000 threshold in 2024–25 would cost £8 billion per year relative to current plans.
- This is a substantial and expensive tax cut from which only those on high incomes would gain. It would offset some of the big tax increases that have affected the very highest earners since 2009.
- Raising the higher-rate threshold to £80,000 in 2020–21 would take 2.5 million people out of paying the higher rate, reversing the increase over recent decades and taking the number of higher- (or additional-) rate taxpayers to its lowest level since the UK’s individual tax system began in 1990–91.
- The government should remove the tapered withdrawal of the personal allowance from £100,000 per year, which creates a £25,000-wide 60% marginal income tax band and affects ever more people each year. Raising the higher rate of income tax from 40% to 45% above the proposed new higher-rate threshold of £80,000 would cover most of the cost to the exchequer of removing this bizarre and opaque feature of our income tax system.
- Raising the point at which employees and the self-employed start to pay National Insurance contributions (NICs), from its planned level of £8,788 per year in 2020–21, would cost about £3 billion for every £1,000 by which it is raised. If the employer NICs threshold were raised alongside this, the total cost would be £5 billion. Raising NICs thresholds would benefit everyone who currently pays NICs – all workers above the bottom 12% of the weekly earnings distribution, or any employee aged 25+ working at least 20 hours per week at the national living wage.
- Raising the NICs threshold is the best way to help low and middle earners through the tax system, but if the aim is to help the lowest earners, increasing work allowances under universal credit is much more effective. Only 3% of the total gains from raising the NICs threshold (either by £1,000 or to the personal allowance threshold) would accrue to the poorest fifth of households. Spending £3 billion on increasing work allowances could raise the incomes of the poorest fifth of households by 1.5%, compared with less than 0.1% under an equally costly NICs cut.
8.1 Introduction
The new prime minister has expressed a desire to overhaul radically the direct personal tax system. During the leadership election, Boris Johnson announced plans to cut income taxes for all existing higher-rate payers by raising the threshold at which the 40% rate kicks in from £50,000 to £80,000. He also suggested raising the point at which people start paying National Insurance contributions (NICs) to help those on low earnings. The new chancellor has expressed similar priorities to lower taxes, and also to simplify the tax system.
The proposed policies would constitute a dramatic tax giveaway at a time when the prime minister has just turned on the spending taps (see Chapter 6). Raising the higher-rate threshold (HRT) and the NICs thresholds that are aligned with it to £80,000 a year would cost around £9 billion a year in 2020–21.1 If the threshold is raised more gradually, to £80,000 in cash terms in 2024–25, this would still cost £8 billion a year. Depending on the details of the pledge to raise the threshold for starting to pay NICs, the total package could cost as much as £26 billion. To set this in context, reversing all welfare cuts announced since 2015 would cost around £13 billion.2 The total increase to day-to-day departmental spending in 2020−21 announced in the September 2019 Spending Round, relative to what was planned in the spring, was also around £13 billion.3
Total taxes in the UK are high by historical standards: tax revenues now are (just) higher as a share of national income than at any point since the late 1960s. But revenues from income taxes and social security contributions (NICs and equivalents) are slightly lower, as a share of national income, than their late 1960s levels and much lower than their peak in the mid 1970s (around 15% today compared with 19% in 1975).
Further, revenues from income taxes and social security contributions are low in the UK compared with most similar countries. In 2016, they stood at around 15% of national income, compared with an average of 20% across G7 countries and 25% in Scandinavia.4 Lower revenue from these taxes entirely explains why total tax revenue as a share of national income is lower in the UK than on average across other similar countries. As Figure 8.1 shows, the UK raises more than average from all other taxes combined as a share of national income. The proposed policies would reduce revenues from direct personal taxes by 3–7%, making the UK even more atypical among developed countries.
At a time of economic uncertainty over Brexit – not least the possibility of a ‘no deal’ Brexit – a substantial permanent tax giveaway would risk putting the public finances on an unsustainable path, as set out in Chapter 4.
Figure 8.1. Tax revenues as a share of national income, 2016
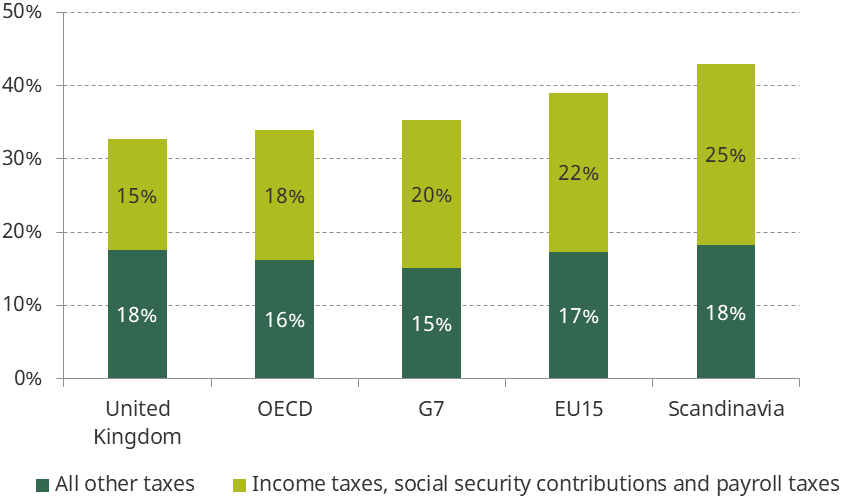
Note: OECD categories are as follows: income taxes 1100, social security contributions 2000, payroll tax 3000. Averages for OECD, G7, EU15 and Scandinavia are simple averages. The OECD average excludes Mexico, for which a tax-by-tax breakdown is unavailable.
Source: Authors’ calculations using OECD, Global Revenue Statistics Database, extracted 28 August 2019 (http://www.oecd.org/tax/tax-policy/global-revenue-statistics-database.htm).
The government’s intention to make big cuts to direct taxes could, however, provide an opportunity to clean up some of the complexity and anomalies in the system while ensuring that there are fewer ‘losers’ than a revenue-neutral reform would imply. In particular, the government should consider removing the arbitrary and opaque spike in marginal tax rates between £100,000 and £125,000 caused by the withdrawal of the personal allowance, which – because the threshold is not even indexed to prices, let alone incomes – is rapidly affecting ever more people as it becomes less generous in real terms. It should also consider less costly ways to boost the incomes of low-earning families than raising the NICs threshold, which on average benefits richer families more than families on low incomes.
This chapter sets out the cost of the prime minister’s proposed policies and analyses their distributional impacts on workers and households. It examines other ways the government could cut taxes for high-income individuals whilst simplifying the system, and a more targeted – and hence less costly – approach to boost the incomes of low-earning households.
The chapter proceeds as follows. Section 1.2 briefly describes the direct personal tax system in the UK and how it varies for different groups of people. Section 1.3 sets out the effects of the proposed rise to the higher-rate threshold and examines a reform package that removes the personal allowance taper in a broadly revenue-neutral way (relative to the prime minister’s proposed policy). Section 1.4 discusses the effects of raising the point at which people start paying NICs, and considers raising work allowances under universal credit as a more cost-effective way to help low earners. Section 1.5 concludes.
Box 8.1. Key modelling choices
Scotland: NICs and benefit policy is set by Westminster for the whole of the UK, but income tax on earned income (other than the personal allowance threshold) is devolved to Scotland. However, changes to income taxes in the rest of the UK affect the amount of grant funding given to the Scottish government via the Barnett formula (see Box 8.2). In modelling the costs of various policies, we take the Barnett formula into account and present total costs to the UK government. Since we do not know how the Scottish government would respond to changes in grant, analysis of the distributional impacts of reforms involving changes to income tax – including numbers of winners and losers – excludes Scotland. Distributional impacts of other policies are shown for the whole of the UK.
Thresholds linked to the higher-rate threshold: A number of thresholds in the tax system are linked to the HRT. These include the upper earnings limit and the upper profits limit (above which employees and self-employed workers pay a lower NICs rate) and the upper secondary threshold and the apprentice upper secondary threshold (below which employers of under-21s and certain apprentices under 25 pay no NICs). In addition, higher-rate taxpayers are not eligible for the marriage allowance (which lets couples transfer up to 10% of their personal allowance between them) and have a lower personal savings allowance (above which they start paying income tax on savings income). In modelling the effect of raising the HRT, we assume that these thresholds remain linked to the HRT. The threshold at which child benefit starts being withdrawn, fixed at £50,000 in cash terms, currently coincides with the HRT, but this is merely a transitory coincidence: the two are not formally linked and have not coincided in previous years. Our central estimates therefore do not assume that the threshold for tapering child benefit is raised with the HRT.
Modelling period: Our calculations assume that all policies take effect in 2020–21. Effects would be slightly different in reality if policies were introduced later, particularly for policies that are specified in nominal terms, taking no account of inflation. For example, raising the HRT to £80,000 costs less (in real terms) the later it is done, since the inflation-indexed threshold rises (in cash terms) over time even without policy change. If the HRT were raised to £80,000 in 2024–25 instead of 2020–21, it would cost £8 billion instead of £9 billion in today’s prices.
Universal credit: We model all policies assuming that universal credit is fully in place. This is obviously not the case – the government currently expects its roll-out to be complete in December 2023 – but since we are considering permanent changes to the tax and benefit system, it is more informative to model impacts under universal credit than under the benefits it is replacing. The assumption has little effect on the estimated impacts of the proposed tax policies.
8.2 Income taxes in the UK
Personal incomes in the UK are subject to two direct taxes: income tax and National Insurance contributions. Individuals are entitled to an income-tax-free personal allowance of £12,500 a year, above which they start to pay income tax at a basic rate of 20%. In England, Wales and Northern Ireland, any income between £50,000 and £150,000 is taxed at a higher rate of 40%, and income above £150,000 at an additional rate of 45%. (See Box 8.2 later for a discussion of income taxes in Scotland.)
Since 2010, those with incomes above £100,000 are affected by an oddity in our tax system, which creates an effective band taxed at 60%. This is because the personal allowance is withdrawn by £1 for every £2 of income above £100,000. Each additional pound is therefore subject to an effective 20% tax rate, on top of the usual higher-rate (40%) tax that is due, until the personal allowance is exhausted at £125,000. As a result, the marginal income tax rate jumps from 40% to 60% at £100,000, and back to 40% at £125,000, before rising to 45% at £150,000.
National Insurance is a separate tax system, originally intended to entitle workers to contributory social security benefits. In practice, how much an individual contributes bears little relation to how much they receive in benefits, and the link has weakened over time, so that NICs act much like an additional tax on earnings. Unlike income tax, NICs are only payable on earned income, not income from other sources such as pensions, interest on savings or rent on a property. For employees, NICs layer an additional 12% tax rate on annual earnings between £8,632 and £50,000 – the ‘upper earnings limit’, which is aligned to the higher-rate threshold in income tax – and 2% thereafter.5
Throughout this chapter, we refer to the threshold at which earnings become liable for NICs as the ‘lower NICs threshold’ or simply the ‘NICs threshold’ and we use the term ‘upper earnings limit’ (UEL) to refer to the threshold above which the 2% rate is paid (or analogously the ‘upper profits limit’ (UPL) for the self-employed, which is aligned with the UEL and higher-rate threshold).
Figure 8.2 shows the marginal rates of income tax and employee NICs – the tax incurred on every additional pound – at different levels of earned income. The ranges at the top of the graph show the share of adults in each income tax band. It shows that nine in ten adults pay a marginal income tax rate of 20% or less: 42% have incomes below the personal allowance and pay no income tax, whilst a further half pay the basic rate. Approximately 1 million people have taxable incomes of over £100,000 a year, and are therefore affected by the withdrawal of the personal allowance above that level.
Employers also pay NICs of 13.8% on salaries above £8,632. Although the tax is levied on employers, in the long run earnings are likely to adjust so the economic burden of the tax falls at least partly on employees. Irrespective of who ‘pays’ the tax in a legal sense, both employer and employee NICs divert some of the amount that it costs an employer to employ someone, away from the pocket of the employee and towards the exchequer. Hence, if employee NICs reduce take-home incomes for workers then so, in the long run, should employer NICs, through knock-on effects on the earnings that employers are willing to pay.6
Figure 8.2. Current income tax and employee NICs schedule for earned income
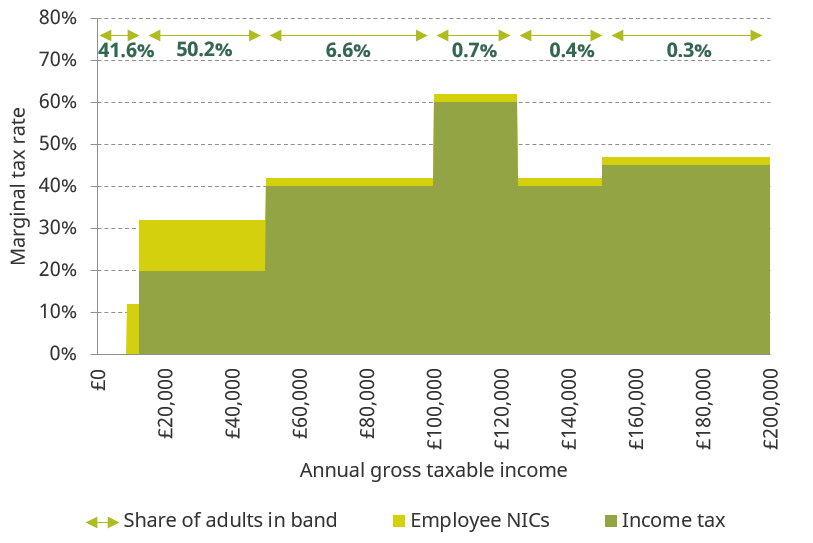
Note: Shows tax schedule for working-age employees and distribution of taxable income among all people in England, Wales and Northern Ireland. Assumes all income is from earnings and no use of transferable personal allowance for married couples or personal savings allowance. Approximately 0.3% of adults have total taxable incomes of over £200,000 a year.
Source: HMRC tax rates and thresholds and authors’ calculations using Family Resources Survey 2017–18 and TAXBEN, the IFS microsimulation model.
Box 8.2. Income taxes in Scotland
The discussion in the main text relates to tax schedules in England, Northern Ireland and Wales. The income tax (but not NICs) schedule in Scotland has differed since 2017–18, following the devolution of rates and bands of income tax on non-savings-and-dividends income in that year. The Scottish government has used these powers to raise revenues and increase the progressivity of the income tax schedule. Figure 8B.1 shows the income tax schedules in Scotland and the rest of the UK. Note that the UK government retains the power to set the personal allowance in Scotland, so this is the same across the UK.
The differences in tax schedules mean that those with incomes of more than £27,000 a year pay more income tax in Scotland than in the rest of the UK. Scottish taxpayers with incomes of £50,000, £100,000 and £200,000 pay £1,544, £2,044 and £3,169 more a year in income tax than residents in the rest of the UK respectively.
Figure 8B.1. Marginal income tax rates in Scotland and the rest of the UK
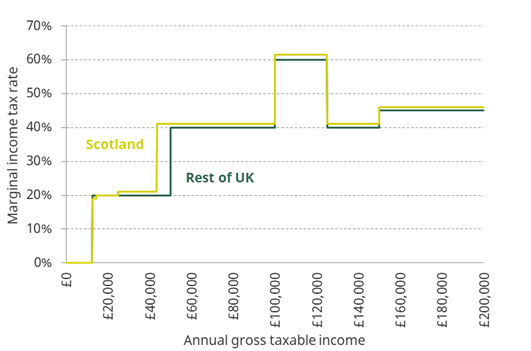
Note: Assumes all income is from earnings and no use of transferable personal allowance for married couples or personal savings allowance.
Source: HMRC tax rates and thresholds.
It will be up to the Scottish government to decide whether to replicate any changes to tax rates and thresholds made by the UK government.
The funding system is set up so that changes to Scottish or UK income taxes affect grants to the Scottish government through the Barnett formula. This means that if the UK were to increase the higher-rate threshold, the net grant to the Scottish government would rise. The Scottish government would then have the choice of replicating the increase in the higher-rate threshold made by the UK government or using the additional block grant funding for other purposes – such as alternative cuts to income tax or other taxes, or higher public spending.a
Note that since April this year, the Welsh government also has powers over income tax, albeit more limited than in the case of Scotland. It can vary the basic, higher and additional rates of income tax on non-savings-and-dividends income in Wales, but it cannot vary thresholds or introduce new marginal rate bands. Furthermore, changes to the basic, higher and additional rates of income tax by the UK government continue to apply by default in Wales – although the Welsh government could choose to offset them.
Figure 8.3. Current income tax and NICs schedule for earned income
Note: Shows tax schedule for working-age employees, including employer NICs, based on the employer cost (gross salary + employer NICs). Assumes all income is from earnings, no pension contributions and no use of transferable personal allowance for married couples or personal savings allowance.
Source: HMRC tax rates and thresholds.
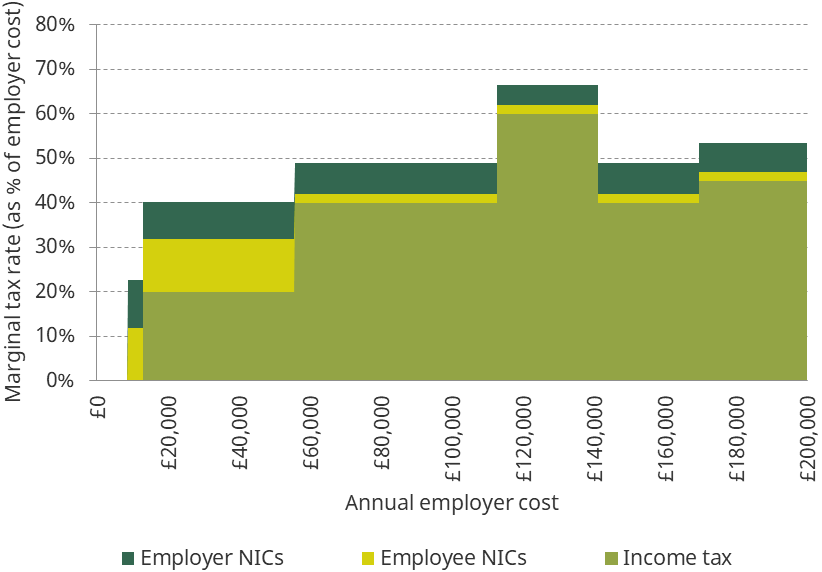
Figure 8.3 shows the marginal rates of income tax, employee NICs and employer NICs as a share of employer cost. This is a different measure from the annual gross taxable income shown in Figure 8.2, and captures the annual direct cost to a firm of employing a worker – that is, the worker’s gross earnings plus the employer NICs due on them.7 Figure 8.3 shows, for an extra £1 paid out by the employer, what fraction of that ends up with the exchequer rather than the employee (whether through income tax, employer NICs or employee NICs).
NICs rates differ between employees and the self-employed and between working-age workers and those above the state pension age. Self-employed workers earning more than £6,365 pay a flat rate of £156 a year, plus 9% of self-employed earnings between £8,632 and £50,000, falling to 2% at the upper profits limit of £50,000. The net effect is that a self-employed worker generating more than £8,632 in profit will keep more of the proceeds than an employee in a job generating the same amount of value, since the sum of employer and employee NICs for that employee exceeds the NICs payable by the self-employed.8 Workers above the state pension age do not pay employee or self-employed NICs, though employers of pensioners carry on paying employer NICs of 13.8%.
The figures above show the marginal income tax and NICs schedules that apply to all workers, regardless of their family circumstances. In practice, some people may keep less of every additional pound earned than the direct tax schedules would imply. For low-income households, entitlements to state benefits are gradually withdrawn at higher levels of income, so the effective marginal tax rate they face is often higher than the income tax and NICs rate. Claimants of universal credit with children or a disabled family member can earn a certain amount before seeing their benefits withdrawn (their ‘work allowance’, which depends on their family and housing circumstances), but thereafter lose 63p in benefits for every additional pound earned net of tax.
The tax system for high earners
In recent years, a number of tax reforms have increased tax for families at the top of the income distribution. These include the following:
- The higher-rate income tax threshold has been deliberately cut in real terms since 2010, partly to claw back gains to higher-rate taxpayers from personal allowance increases.
- Since 2010, the income tax personal allowance is tapered away from those with incomes exceeding £100,000, as described above.
- Since 2010, an ‘additional’ rate of income tax has applied to those on at least £150,000 per year – currently a marginal rate of 45% above that level.
- The so-called ‘high income child benefit charge’, introduced in 2013, effectively claws back a family’s child benefit through the income tax system when the highest-income adult in the family has a taxable income of £50,000 or more (and claws back all of the child benefit if that person has an income of £60,000 or more).
- The annual limit on tax-free pension saving (before pension contributions) was reduced in a tapered way in 2016, from £40,000 for those with a taxable income (before pension contributions) of £150,000 or less, down to £10,000 for those with a taxable income (before pension contributions) or £210,000 or more.9
In sum, these policies have represented a significant increase in tax for those on the highest incomes. IFS researchers have previously estimated that policies introduced by the coalition government (May 2010 to May 2015) reduced net household incomes among the richest 10% of households by around 2.5%. If one were also to include measures introduced in the final months of the last Labour government (in particular, the additional income tax rate and the tapered withdrawal of the personal allowance), that figure rises to 6.5%.10
Unfortunately, these increases in taxes at the top have often been done in a way that also makes the system increasingly complex and opaque. The tapering of the personal allowance – really just another marginal income tax rate in disguise, as explained above – and annual limit on pension contributions are clear examples of that. The fact that other tax breaks have been newly introduced but then restricted only to people with taxable income below a certain level have added further to this complex picture when it comes to the effective income tax schedule. These include the transferable allowance for married couples, which is only available to basic-rate taxpayers, and the personal savings allowance, which is lower for higher- and additional-rate taxpayers. The additional 15 hours a week of free childcare (for 3- and 4-year-olds in working families) and childcare subsidies of up to £2,000 a year per child through ‘tax-free childcare’ are not available to those with incomes exceeding £100,000.
In addition, the changes have introduced various additional sources of ‘fiscal drag’: more people end up paying higher tax rates over time as incomes rise faster than tax thresholds. Fiscal drag can happen even if tax thresholds are uprated with inflation (since earnings growth typically exceeds inflation), but it is particularly pronounced when thresholds are fixed in nominal terms, as many of the new ones are. These include the £50,000 and £60,000 thresholds used to withdraw child benefit; the £100,000 threshold from which the personal allowance is tapered (and from which tax-free childcare and the additional 15 hours of free weekly childcare are withdrawn); and the £150,000 threshold from which the additional income tax rate and the taper on tax-free pension saving limits kick in.
These forms of fiscal drag are important. IFS researchers have estimated that, by 2022–23, one in five families with children will have someone who earns more than £50,000 in cash terms and lose at least some of their child benefit, up from one in eight when the child benefit clawback was introduced.11 More than 300,000 additional people now earn more than £100,000 than in 2007–08 – an increase of over 50% – and there are over 100,000 more taxpayers with incomes exceeding £150,000 than there were back then.12
8.3 Changes to top taxes
Effect of raising the higher-rate threshold
Prime Minister Boris Johnson has proposed raising the higher-rate threshold from its current level of £50,000 to £80,000. This would mean that taxable income between £50,000 and £80,000 is subject to the basic rate of income tax of 20%, rather than the higher rate of 40%.
For pensioners and those with unearned income in this range, this change would reduce the tax due by 20p for each additional pound of income. But the policy would be less generous than this for those of working age with earned income in that range, for whom half of the gains would be clawed back through higher NICs. This is because the upper earnings limit – above which the rate of employee NICs falls from 12% to 2% – is aligned with the HRT. Taken together, raising the HRT from £50,000 to £80,000 reduces the combined tax liability from income tax and employee NICs on earnings within that range from 42% to 32%. In other words, the combined marginal tax rate falls by 10, rather than 20, percentage points for these people.
Figure 8.4 shows the annual gain from raising the HRT for working-age employees at different levels of income, focusing simply on the increase in individual take-home income (we include a household-level analysis later). Employees with total taxable incomes of £80,000 per year or more would be made £3,000 better off per year as result of the policy, with those between £50,000 and £80,000 gaining by less than that. Working-age self-employed people with incomes in the affected range gain slightly more, up to £3,900 a year, as they face a lower NICs rate (9%) below the UEL and so less of their gains would be clawed back through higher NICs. People above the state pension age (and the very small number of people of working age without earnings and with very high savings and investment income) can gain up to £6,000 a year, as they do not pay employee or self-employed NICs. To give a sense of which kinds of people get this tax cut, anyone with a taxable income of over £50,000 is in the highest-income 8% of adults and anyone on more than £80,000 is in the highest-income 3%.
Figure 8.4. Gains from raising HRT, by taxable income
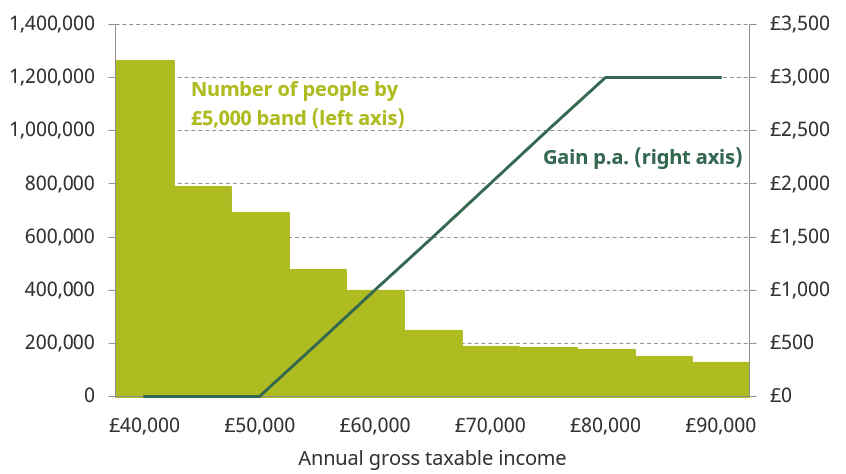
Note: Shows gains for working-age employees and number of people within £5,000 income bands. Excludes Scotland. Number of people on top incomes (above £80,000) in the UK is estimated using a Pareto distribution to interpolate between thresholds provided by HMRC, following the methodology set out in S. Adam, A. Hood, R. Joyce and D. Phillips, ‘Labour’s proposed income tax rises for high-income individuals’, IFS Briefing Note BN209, 2017, https://www.ifs.org.uk/publications/9229. Share of those on top incomes in England, Wales and Northern Ireland (excluding Scotland) is estimated using a linear approximation of the share of Scottish taxpayers by £5,000 income band.
Source: Authors’ calculations using Family Resources Survey 2017–18, TAXBEN (the IFS microsimulation model) and table 2.1 of HMRC, ‘Income tax statistics and distributions’, https://www.gov.uk/government/collections/income-tax-statistics-and-distributions.
Basic-rate taxpayers can take advantage of the marriage allowance, which lets couples transfer up to 10% of the personal allowance between them if one member of the couple has income below the allowance and the other member is a basic-rate taxpayer. This can be worth up to £250 a year. The personal savings allowance, above which people start paying income tax on savings, is also higher for basic-rate taxpayers than for higher-rate taxpayers. Assuming that these allowances stay tied to the higher-rate threshold, raising the HRT to £80,000 would also entitle more families to take advantage of these tax breaks. Figure 8.4 ignores those details, for simplicity and because the HMRC data on which the figure is based do not reveal how many people in the relevant income ranges are able to take advantage of these allowances. But for the rest of the chapter, we assume that the thresholds for these tax allowances are raised alongside the HRT.
Effects on government revenues
If implemented in April 2020, the policy would cost the government around £8 billion a year in reduced tax revenue from England, Wales and Northern Ireland. When the increase in grant to Scotland through the Barnett formula is taken into account, the overall cost to the UK exchequer would be around £9 billion a year, cutting income tax revenue by 4%.13 How the Scottish government would spend this extra grant (or use it to cut taxes) is of course unknown, so for the rest of this section we focus on the effects in the rest of the UK.
The prime minister has indicated that he might choose to raise the higher-rate threshold to £80,000 more gradually, rather than in a single year.14 This would reduce the cost of the policy, both in the short run (because the short-run increase in the HRT would be smaller) and in the long run (because £80,000 will be worth less in real terms in future years). For example, given current inflation forecasts, if the HRT were to reach £80,000 by 2024–25, the long-run cost would be about £8 billion per year (rather than £9 billion) in today’s terms, since by 2024–25 that threshold is already set to rise from its current level of £50,000 to £54,080 in nominal terms under current policy.15 The shorter-term costs would of course depend on the details of how the rise to £80,000 is phased in. To give a sense of scale, raising the threshold by £5,000 or £10,000 in cash terms in 2020–21 would cost £2 billion or £4 billion in that year respectively.
Table 8.1. Effects of raising HRT by different amounts in 2020–21 in current prices
Outcome | To £80,000 | By £5,000 | By £10,000 |
Annual short-run cost | £8.9bn | £2.3bn | £4.1bn |
|
|
|
|
Number of people taken out of higher-rate tax | 2.5m | 0.8m | 1.3m |
Number of people who gain | 3.7m | 3.7m | 3.7m |
Average tax cut for people who gain | £2,280 | £580 | £1,050 |
|
|
|
|
Number of households that gain | 3.3m | 3.4m | 3.4m |
Average gain per household p.a. | £320 | £80 | £150 |
Average gain p.a. among households that gain | £2,490 | £640 | £1,150 |
Share of total gains accruing to the richest 10% of households | 75% | 66% | 69% |
Note: Total costs are rounded to the nearest 0.1 billion, numbers of people and households to the nearest 0.1 million, and annual gains to the nearest £10. The richest 10% of households are defined in terms of their net equivalised household incomes. Income deciles are derived by dividing all households into 10 equal-sized groups according to income adjusted for household size using the modified OECD equivalence scale. Total costs are for the whole of the UK but other figures exclude Scotland.
Source: Authors’ calculations using Family Resources Survey 2017–18 and TAXBEN, the IFS microsimulation model.
Table 8.1 summarises key effects of raising the higher-rate threshold by different amounts. The numbers of people and households that gain are similar across the options, as everyone over the current HRT gains.16 But average gains (even in the long run) are higher the more quickly the HRT is raised to £80,000, for the reasons explained above. In the remainder of this section, we discuss the impact of raising the HRT to £80,000 next year (2020–21) – that is, the scenario corresponding to the first column of Table 8.1.
Effects on individuals
As Prime Minister Johnson set out, part of the motivation behind the policy is to ‘help the huge numbers that have been captured in the higher rate by fiscal drag’.17 The number of higher-rate taxpayers has indeed risen over the past three decades, as the threshold for paying the higher rate has not risen in line with incomes (and has been deliberately cut in real terms since 2010, partly as a way of clawing back some of the gains to higher-rate taxpayers of raising the personal allowance).18 Around 3.8 million people pay the higher (or additional) rate today, which is 13% of all income tax payers or 8% of all adults – nearly double the proportion paying the higher rate when the individual tax system was introduced in 1990–91.
As Figure 8.5 shows, raising the HRT to £80,000 in 2020–21 would take 2.5 million people out of paying higher-rate tax and undo this rise in numbers in one fell swoop. The number of higher- (or additional-) rate taxpayers would fall to just 1.3 million, or 3% of adults – a lower proportion than in 1990–91. Even raising the HRT by £5,000 in 2020–21 would take the share of higher- (or additional-) rate taxpayers to its lowest level since 2000–01.
Around 3.2 million working people would gain from raising the HRT to £80,000 in 2020–21, including 0.4 million people in self-employment. 3.0 million of those 3.2 million are below their state pension age. 0.4 million retired pensioners and 0.1 million working-age people who do not have earnings, but have significant unearned income, would also gain. Those who gain see their direct personal tax liabilities fall by an average of around £2,300 a year – although, as described above, the amount gained varies according to how far above £50,000 their income is, whether they are employed or self-employed, and whether they are below or above the state pension age.
Figure 8.5. Higher- or additional-rate taxpayers as share of adult (16+) population

Note: Excludes Scotland. Shows number of higher- (and additional-) rate taxpayers in financial years divided by population estimates in corresponding calendar year (calendar year 1990 for financial year 1990–91, labelled 1990; and so on). Figures for 1990 to 1998 are estimates based on the number of higher-rate taxpayers across the UK as a whole because nation-specific figures are not available for that period. Population for 2019 and 2020 are based on projections for 15+ population.
Source: Authors’ calculations using: Family Resources Survey 2017–18; TAXBEN, the IFS microsimulation model; tables 2.1 and 2.2 of HMRC, ‘Income tax statistics and distributions’, https://www.gov.uk/government/collections/income-tax-statistics-and-distributions; and ONS, ‘National population projections: 2016-based’, https://www.ons.gov.uk/releases/nationalpopulationprojections2016basedstatisticalbulletin.
Some 0.4 million people would actually lose from the policy. This is a perverse and unintended consequence of having two systems – income tax and NICs – kept separate, with slightly different rules, when they are really trying to do much the same thing. Unlike income tax, earnings liable for NICs are calculated without applying any personal savings allowance or transferable personal allowance for married couples, and – unless using a salary sacrifice scheme – without deducting employee pension contributions. As result, there are people who have earned income above the current National Insurance UEL (so are currently subject to the lower 2% rate of NICs), but have less or no income that attracts higher-rate income tax due to the use of these additional income tax allowances that do not apply to NICs. For most of these people, the loss from raising the UEL would outweigh the gain from raising the HRT of income tax. This is an example of a seemingly innocuous wrinkle in our tax system making it impossible for the government to make basic policy changes without unintended consequences.
Personal incomes vary substantially over people’s lifetimes and between men and women. Three-quarters (76%) of those who would get a tax cut from the rise in the HRT are men, who would receive 79% of total cash gains. 12% of men would get a tax cut, compared with just 3% of women, though it is worth noting that 14% of women (and 16% of men) live in a household where someone benefits from the policy.
In the short term, people in the mid to late working-age years are most likely to gain from the policy, as incomes tend to be higher at this point than at other stages of life. 12% of 35- to 54-year-olds would see their tax liabilities reduced (and 21% would be in a household where at least one person sees their tax reduced), compared with just 3% of those under 35 and 7% of those aged 55 and over. Of course, assuming that the policy is permanent, the long-term gains to different generations will be less unevenly spread than the short-term gains to different age groups. For example, of the current younger generations who do not have an income above £50,000, some will do so later in life and hence would, at a later stage, benefit from this policy were it to remain in place. Of those who do gain from the rise in the higher-rate threshold, older people typically gain more. As explained above, people over the state pension age do not pay NICs, so a taxpayer over the state pension age would typically gain twice as much as a working-age person with the same income. People over the state pension age make up just 15% of those who gain, while 20% of the total reduction in tax accrues to them.
Table 8.2 compares the characteristics of those who would be taken out of paying higher-rate tax by an increase in the HRT to £80,000, those who would remain higher-rate taxpayers, and those who would be basic-rate taxpayers either way. Compared with those who will remain on higher-rate tax after the policy, those taken out of paying higher-rate tax are more likely to live in London and the South and to be women. They are less likely to work as managers and directors and less likely to work in finance than those who will remain higher-rate taxpayers, but on most dimensions still resemble this group more than they resemble basic-rate taxpayers.
Table 8.2. Characteristics of taxpayers
Characteristic | Taken out of higher-rate tax (£50,000–£80,000) | Remain on higher-rate tax (£80,000+) | Basic-rate taxpayers (below £50,000) |
Male | 73% | 81% | 56% |
Above state pension age | 15% | 11% | 19% |
In a couple | 84% | 88% | 74% |
Has children | 38% | 43% | 27% |
Lives in London | 19% | 18% | 13% |
Lives in South East/West | 39% | 31% | 28% |
Manager or director | 21% | 30% | 8% |
Works in finance | 8% | 11% | 4% |
Works in public sector | 26% | 20% | 32% |
Note: ‘Manager or director’ refers to SOC2010 major group 1. Finance corresponds to SIC2007 K (finance and insurance). Public sector corresponds to SIC2007 O, P, Q (public administration and defence, education, health and social work).
Source: Authors’ calculations using Family Resources Survey 2017–18 and TAXBEN, the IFS microsimulation model.
Effects on households
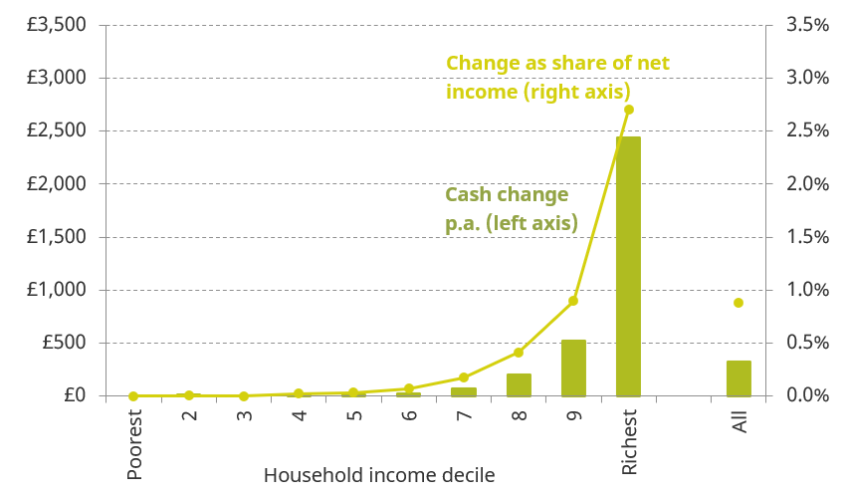
Typically when assessing the distributional impacts of policy, we should also examine the impacts on household – rather than individual – incomes. For example, the member of a single-earner couple not in paid work still benefits from an income tax cut for their spouse if some of the additional after-tax income is pooled within the household. The 3.7 million people who get a personal tax cut from the policy are in 3.3 million households –containing 9.5 million people in total – which gain an average of £2,500 per household per year. As Figure 8.6 shows, these gains mostly accrue to households at the top of the household income distribution. Three-quarters of the fall in tax liabilities would go to those in the top tenth richest households, which gain around £2,400 a year on average and see their net incomes rise by 2.7%. Nearly all (97%) of the gains accrue to the richest 30% of households.
The reason that any households outside the top few deciles gain at all is that tax is levied on individual incomes, while we are measuring incomes at a household level and taking account of the size of the household. So someone earning £60,000, for example, who lives with a spouse with no personal income and has a few children, could be around the middle of the household income distribution.
Since 2013, families in which either partner earns over £50,000 are subject to the child benefit clawback, losing 1% of their child benefit entitlement for every additional £100 of income, until all child benefit entitlement is exhausted at £60,000. Unlike the personal savings allowance and the marriage allowance, the threshold for the child benefit clawback has been fixed at £50,000 (without any indexation) and not tied to the HRT, but it does currently happen to coincide with it. In our modelling so far, we have assumed that the threshold for withdrawing child benefit will remain at £50,000, which would mean that people paying the basic rate of income tax under the new prime minister’s plans would lose their child benefit. This was certainly not the policy intent when the child benefit withdrawal was introduced, although that was in the context of an HRT substantially lower than £80,000. If the threshold above which child benefit is tapered away rises to £80,000 in line with the HRT, this would cost a further £2 billion, with gains accruing overwhelmingly to the top half of the household income distribution.
Figure 8.6. Distributional effects of raising the HRT to £80,000, by household income
Note: Excludes Scotland. Income deciles are derived by dividing all households into 10 equal-sized groups according to income adjusted for household size using the modified OECD equivalence scale.
Source: Authors’ calculations using Family Resources Survey 2017–18 and TAXBEN, the IFS microsimulation model.
Potential behavioural effects
The modelling above assumes that people do not adjust their earnings in response to the cut in taxes. In his Telegraph column and in hustings during the leadership election, the prime minister has repeatedly cited the Laffer curve, which posits that there is a tipping point beyond which higher tax rates reduce government revenue by encouraging people to earn less or engage in avoidance or evasion. In a nod to the Laffer curve,19 the chancellor has also said that maximising tax revenue ‘doesn't always mean that you have to have the highest tax rate possible’.20
However, whilst (declared) taxable incomes for the very-highest-income individuals (approximately those with incomes above £150,000 per year) have been found to be quite responsive to marginal tax rates,21 the evidence does not suggest that changing marginal tax rates in the income range between £50,000 and £80,000 would have nearly such a significant ‘behavioural’ impact. In Budget 2012, following a review of the evidence, HM Treasury assumed a ‘taxable income elasticity’ of just 0.03 for individuals affected by cuts to the HRT, with incomes of over £48,000 in today’s prices. This means that a 1% rise in the marginal net-of-tax rate (the share kept of every additional pound earned, so 100% minus the marginal tax rate) is estimated to increase taxable income by 3%. Previous IFS research estimated the taxable income elasticity around the HRT to be 0 for employees and around 0.05 for the self-employed.22 Based on these estimates, the exchequer would recoup around half a billion of the £9 billion sticker cost of raising the HRT to £80,000.
That is not a knock-down argument against the tax cut: governments can still reasonably do things even if they cost money – after all, millions of individuals would get to enjoy a rise in their after-tax income. But it should not be implied that the policy will pay for itself. It certainly will not.
One of the stated aims of the policy is to ‘stimulate’ the economy after the UK leaves the EU,23 and the prime minister has advocated tax cuts to ‘give the economy the jolt that it needs’.24 But a permanent change to the income tax schedule, at ongoing cost to the exchequer, would not be a good way of providing fiscal stimulus, not least because fiscal stimulus packages should be temporary and not permanent. Furthermore, giveaways to high-income households (those who would benefit from this policy) would be less effective at boosting spending than comparable giveaways to low-income households, as the latter spend a higher share of their gains.25 Alternative policies to support the economy after Brexit are discussed in Chapter 5.
Removing the personal allowance taper
The proposed rise to the higher-rate threshold would represent a substantial change to our tax system for those on higher incomes. The government could introduce a more comprehensive package which simultaneously rationalises income taxes for those on high incomes, in particular by removing the arbitrary and opaque 60% marginal income tax rate between £100,000 and £125,000.
As described above, the 60% rate arises from the withdrawal of the personal allowance by £1 for every £2 of income above £100,000, until there is no allowance left at £125,000. Once employee and employer NICs are included, the marginal income tax rate (as a share of employer cost) over this range is (at least) 67%.26
The high effective marginal tax rate kicking in from £100,000 will significantly reduce incentives to earn above this level. Previous analysis by IFS researchers has indeed found evidence of bunching at incomes just below £100,000.27 The data they used ran to 2013–14 – predating the cliff-edge withdrawal of some childcare subsidies at this level of income – so all else equal we might expect more bunching today.
Further, the threshold for withdrawing the personal allowance is fixed in cash terms, which means that the number of people affected rises arbitrarily over time with inflation. Since the policy was first mooted in 2007–08, the number of people with incomes over £100,000 has increased by over 50%.28 The number of people facing the 60% marginal income tax rate has also increased rapidly, to around 360,000 today, not only due to nominal income growth but also because of a widening of the band. That is because the width of the band is double the personal allowance, which successive governments have increased in real terms. When the policy was first introduced in 2010–11, the personal allowance stood at £6,475, so the 60% marginal tax rate applied to everyone with incomes between £100,000 and £112,950. Now, with the personal allowance at £12,500, the band stretches between £100,000 and £125,000.
Whilst many people would consider it reasonable for marginal tax rates to rise with incomes, an income tax schedule in which the marginal rate peaks, then falls, then rises again (when the additional income tax rate of 45% kicks in, from £150,000) looks extremely difficult to rationalise, whatever the government’s distributional objectives. And where government judges that high-income groups should pay more, one might hope that this could be achieved in a transparent manner after an open debate about how taxes are raised, rather than by letting opaque tapers and fiscal drag do the job.
Simply removing the personal allowance taper would, of course, be a giveaway to some very-high-income people, to the tune of £4 billion a year. It would benefit people with incomes over £100,000 – approximately the top 3% of those paying income tax or the top 2% of adults. But the government could choose to raise taxes at the top in a way that is far more straightforward and transparent than withdrawing the personal allowance.
One way of doing this is to allow the 45% rate of income tax, which currently applies only above £150,000, to kick in earlier. Since the prime minister is already proposing to raise the HRT to £80,000, he could consider raising the tax rate above this threshold to 45% at the same time as removing the personal allowance taper.29 Doing so would remove the bizarre spike in the marginal tax rate between £100,000 and £125,000, and would have the additional benefit of sweeping away two tax thresholds that are not indexed to inflation (the £100,000 threshold for the 60% rate and the £150,000 threshold for the additional rate). It would return the income tax system to a two-rate system (or three rates including the 0% band below the personal allowance), as it was in 2009–10, simplifying the tax system in line with the chancellor’s stated intention.30
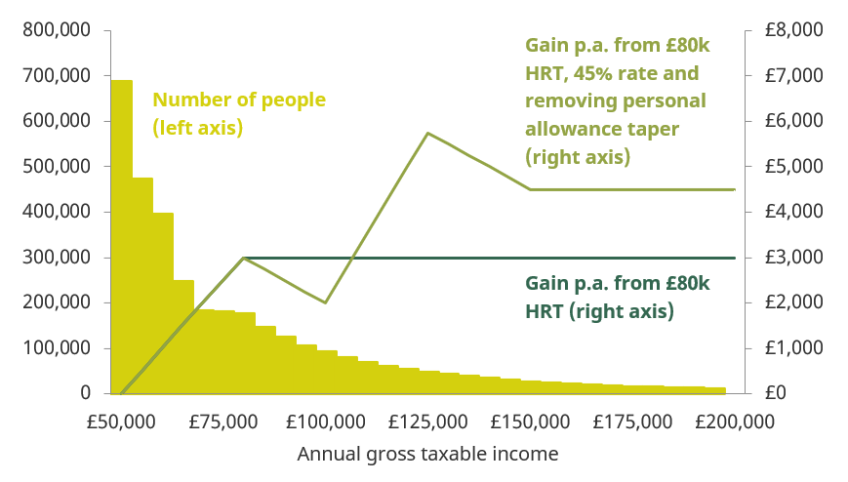
Figure 8.7 compares the effects of this reform with those of the proposed policy to raise the HRT to £80,000 in England, Wales and Northern Ireland. Approximately 700,000 people with taxable incomes between £80,000 and around £107,000 would gain less from this package than from simply raising the HRT to £80,000 (with a difference of up to £1,000 per year). This is because they would face a higher marginal rate of 45% without benefiting as much, or at all, from the removal of the personal allowance taper. Approximately 900,000 people with taxable incomes above £107,000 would gain more, by up to £2,750 a year.
Figure 8.7. Gains from top income tax reform options, by taxable income
Note: Shows gains for working-age employees and number of people within £5,000 income bands. Excludes Scotland. Number of people on top incomes (above £80,000) in the UK is estimated using a Pareto distribution to interpolate between thresholds provided by HMRC, following the methodology set out in S. Adam, A. Hood, R. Joyce and D. Phillips, ‘Labour’s proposed income tax rises for high-income individuals’, IFS Briefing Note BN209, 2017, https://www.ifs.org.uk/publications/9229. Share of those on top incomes in England, Wales and Northern Ireland (excluding Scotland) is estimated using a linear approximation of the share of Scottish taxpayers by £5,000 income band.
Source: Authors’ calculations using Family Resources Survey 2017–18, TAXBEN (the IFS microsimulation model) and table 2.1 of HMRC, ‘Income tax statistics and distributions’, https://www.gov.uk/government/collections/income-tax-statistics-and-distributions.
Removing the personal allowance taper whilst starting the 45% rate at £80,000 would cost around £1 billion, on top of the £9 billion cost of raising the HRT to £80,000 in 2020–21. To keep the net cost the same as the prime minister’s plan of simply increasing the HRT to £80,000, one could start the higher rate of 45% at £75,000 rather than £80,000. Relative to current policy, this would still cut taxes for 3 million people and take 2 million people out of paying the higher rate of income tax, taking the number of higher-rate taxpayers to the lowest level since 1990–91.
8.4. Policies to help the low-paid
Effect of raising the NICs threshold
The earnings threshold for paying employee, self-employed and employer NICs is currently £8,632 and is set to increase with (CPI) inflation to £8,788 in 2020–21. The prime minister has said he wants to increase this threshold, indicating that helping people on the lowest pay would be his ‘priority’.31 In an interview to the Times, the chancellor has also said: ‘if you are going to have tax cuts, I think you should always be thinking about the lowest paid, and about how you can try and help them’.32
If the focus is indeed on the lowest paid, then changing the NICs threshold certainly makes more sense than fixating only on the income tax personal allowance, as has been the case in recent years: income tax kicks in at a significantly higher level of earnings than NICs, and is paid not only on earnings but on other sources of income too. In a context where the income tax personal allowance has risen sharply, some attention for NICs is long overdue. That said, if the primary objective is to help lower earners then any direct tax policy is limited in how well it can target the problem. We discuss a natural alternative in the following subsection.
The prime minister has not stated how much he would like the NICs threshold to increase by, or whether he intends to raise the threshold for employer NICs along with the employee and self-employed thresholds. One option would be to align the point at which earnings are liable for NICs with the Personal Allowance at £12,500, as proposed by Dominic Raab (the new foreign secretary) during the Conservative leadership contest. Raising the employee and self-employed NICs thresholds to this level would cost £10 billion per year – £1 billion more than the cost of raising the HRT to £80,000, which would be consistent with raising NICs being the government’s ‘priority’. If the employer NICs threshold were raised in tandem, the cost would rise to £17 billion. Either policy would represent a substantial cut to NICs revenues33, of around 7% and 12% respectively.
Aligning employee, self-employed and employer NICs thresholds with the personal allowance would take around 2 million people out of paying tax on earnings. 26 million people would gain from the policy, of whom around 3 million are self-employed. They are in 16 million households which gain an average of around £1,000 a year. Remarkably, a small number of low-income households would actually lose a little from the policy. This is because some families that receive both universal credit and council tax support – both assessed on the basis of net incomes – would lose some of their entitlement to each of these benefits when a NICs cut increases their post-tax earnings, and the combined loss of benefits would in some cases exceed the gain from the tax cut.34
Of course, the prime minister could choose to raise the NICs threshold by a smaller amount. Raising the threshold by £1,000 to £9,788 in 2020–21 would take 1 million people out of paying NICs and cost £3 billion in total, or £5 billion if the employer NICs threshold is raised alongside the employee and self-employed thresholds. The number of people and households that gain would be similar to the number gaining when raising the NICs threshold up to the personal allowance – in both cases, nearly everyone with earnings above the current NICs threshold gains. However, a smaller rise in the threshold of course translates into lower average gains.
Table 8.3 summarises key outcomes for different options for raising the NICs threshold: by £1,000 or to £12,500, with and without raising the employer NICs threshold. In general, the cost of the policy would increase by around £3 billion for every £1,000 that the NICs threshold is raised, and raising the employer NICs threshold in tandem would increase the cost by around 60%.
Raising the NICs threshold is the most effective way to target low-paid workers through the tax system. It is more effective than, say, further raising the personal allowance threshold, which has been increased by successive governments since 2008 in real terms. This is both because the threshold for paying NICs is lower and because raising the personal allowance thresholds also benefits people who are not in paid work but have other sources of income. But cutting NICs does not reach the lowest 12% of earners, whose earnings fall below the current threshold for paying NICs (equivalent to working less than 20 hours a week as an employee aged 25 or over on the national living wage). In cash terms, it benefits high earners at least as much as low earners, so is an expensive way to boost the incomes of low earners. Further, low earners who benefit from the NICs threshold may live with higher-earning partners, and hence not be in low-income households. Some of those who are in low-income households can also have some of the gains clawed back through reduced benefit entitlements, since universal credit is assessed against net-of-tax income.
Figure 8.8 shows the distributional impact of raising all NICs thresholds, including the employer NICs threshold, to £12,500. It shows that raising the NICs threshold disproportionately benefits households towards the middle and top of the income distribution. 77% of the households that benefit from the policy are in the top half of the income distribution, and only 2% are in the poorest tenth of households. On average, the richest 30% of households gain around £1,000 a year, whilst the poorest 10% gain only around £30 a year.35 This is the most extensive – and expensive – of the NICs reforms that we consider; for other proposals, the shape of the distributional impact is broadly similar, but the value of the gains will be smaller. As shown in Table 8.3, raising the NICs threshold by just £1,000 also benefits the richest households much more than the poorest households.
Table 8.3. Effects of raising NICs threshold for different policy variants
Outcome | Employee/ self-employed NICs threshold | All NICs thresholds | Employee/ self-employed NICs threshold | All NICs thresholds |
Total cost | £10.4bn | £17.0bn | £2.8bn | £4.5bn |
Number of people taken out of NICs | 2.6m | 2.4m | 0.6m | 0.6m |
Number of people whose personal income is increased | 25.3m | 26.0m | 25.3m | 26.0m |
Number of households that gain | 15.9m | 16.4m | 16.0m | 16.4m |
Average gain per household p.a. | £380 | £610 | £100 | £160 |
Average gain p.a. among households that gain | £650 | £1,040 | £170 | £280 |
|
|
|
|
|
Average gain in poorest half of households p.a. | £160 | £260 | £40 | £70 |
Average gain in poorest half of working households p.a. | £400 | £660 | £110 | £180 |
Average gain in poorest 10% of working households p.a. | £130 | £230 | £40 | £70 |
Average gain in richest half of working households p.a. | £770 | £1,240 | £200 | £330 |
Note: Total costs are rounded to the nearest 0.1 billion, numbers of people and households to the nearest 0.1 million, and annual gains to the nearest £10. The poorest and richest x% of households are defined in terms of their net equivalised household incomes. Income deciles are derived by dividing all households into 10 equal-sized groups according to income adjusted for household size using the modified OECD equivalence scale.
Source: Authors’ calculations using Family Resources Survey 2017–18 and TAXBEN, the IFS microsimulation model.
Figure 8.8. Distributional effects of raising all NICs thresholds to £12,500, by household income

Note: Shows the effect of increasing employee, self-employed and employer NICs thresholds to £12,500. Assumes full take-up of benefits. Income deciles are derived by dividing all households into 10 equal-sized groups according to income adjusted for household size using the modified OECD equivalence scale.
Source: Authors’ calculations using Family Resources Survey 2017–18 and TAXBEN, the IFS microsimulation model.
Richer households benefit more from raising the NICs threshold for three main reasons:
- First, many of the poorest households do not currently pay any NICs at all, either because they have no one in paid work or because no one earns above the current NICs threshold. These households do not benefit from the policy at all. Only one in ten of the 10% poorest households gain from raising all NICs thresholds to £12,500, compared with eight in ten of the 10% richest households. This is partly due to higher worklessness among poorer households: only 26% of the poorest households have someone in paid work, whilst 84% of the richest households do. But low earnings at the bottom of the income distribution mean that only 46% of those in the poorest 10% of working households gain from raising the NICs threshold compared with 99% in the richest 10%. Average gains among winners are also larger for richer households.
- Second, households nearer the bottom of the income distribution get a larger share of their income from benefits, rather than earnings. Since benefits are unearned income and so not subject to NICs, this means that the policy has a smaller impact on their incomes in proportional terms.
- Finally, because universal credit and council tax support are assessed on the basis of net-of-tax incomes, many low-income households lose benefits as they gain from the higher NICs threshold. Of all households in the bottom 10% of the income distribution that gain from the policy, nearly two-thirds (62%) have some of their gains offset by withdrawn benefits.
Increasing work allowances
Raising the starting point for paying NICs would be the best way to help low earners by cutting direct taxes. But as we show above, the policy would be expensive and largely benefit richer households, without benefiting the very lowest earners.
Low-income working households could be better targeted by increasing work allowances under universal credit. This is the amount claimants can earn before they start losing their universal credit, at a rate of 63p for every additional pound earned net of income tax and NICs. As with the NICs threshold, work allowances can be used to target only those families with someone in paid work.
An alternative policy would be to reduce the rate at which universal credit is withdrawn as family earnings increase above the work allowance (the so-called ‘taper rate’), as was done in 2017. This would also focus support on low earners, though it would be slightly less progressive than raising the work allowance, as those earning less than the current work allowances would not benefit and universal credit recipients with the highest earnings (although still relatively low earners when compared with the population at large) would benefit more in cash terms than those with lower earnings.36 In this subsection, we focus on raising work allowances, which is more directly analogous to raising the threshold for paying NICs.
There are at least four important reasons why raising universal credit work allowances has a different distributional impact from raising the NICs threshold:
- First, higher work allowances would benefit the very-lowest-earning people, not just those earning more than the current NICs threshold. As stated above, the bottom 12% of the earnings distribution currently pay no NICs.
- Second, universal credit entitlements are assessed based on family incomes, whereas the NICs system is entirely based on individual earnings. Individuals with low earnings are not always individuals in low-income households, in particular because low earners sometimes have a higher-income partner. If the aim is to focus resources on the lowest-income households, as would often be the case where the underlying concern is poverty and low living standards, then this is an advantage of using the benefit system rather than the tax system.
- Third, raising the NICs threshold reduces taxes paid by high earners as much as low earners (in cash terms), and is therefore an expensive way to boost incomes at the bottom. Because universal credit is restricted to families on relatively low incomes, raising work allowances can more tightly focus any increase in generosity on the poorest.
- Fourth, cuts in NICs are partly (and in a small number of cases fully) offset by reductions in benefits for those on the lowest incomes, because universal credit and council tax support are assessed against net-of-tax income. Channelling support through the benefit system, instead of the tax system, avoids this result.
There are always drawbacks of increasing means-tested benefits too. There can be both hassle and stigma involved in claiming means-tested benefits, and some families do not claim their entitlement – issues that are avoided with cuts to personal taxes which feed through automatically. Raising work allowances would increase the number of families on universal credit, which would increase administration costs (though those costs would be dwarfed by the costs of giving a NICs cut not only to low-income families but to millions of others as well). And the impacts on financial work incentives would not be uniformly positive, as explained below.
There have been a number of cuts to universal credit work allowances since the ‘finalised’ allowances were first announced in the 2012 Autumn Statement. In 2013 and 2014, work allowances were frozen in cash terms until 2017–18. Budget 2015 further reduced the levels at which work allowances were set, and abolished allowances altogether for non-disabled families without children. Budget 2018 rowed back on some of these cuts, raising work allowances by £1,000 a year, but only for family types for whom work allowances had not already been abolished entirely.
The overall effect of these policies is that work allowances are much lower than originally planned for most family types, meaning more families are getting their benefits clawed back. Table 8.4 shows the current work allowances in 2019–20, and what they would have been had they been set and uprated according to the plans in 2012. For most family types, work allowances are lower now than they would be under the 2012 plans; for childless families, work allowances have been removed entirely. For example, lone parents who own their home can earn £6,036 a year before seeing their benefits withdrawn (equivalent to working 14 hours a week on the national living wage), but could have earned £9,552 a year in today’s prices had work allowances remained at their planned 2012 levels (equivalent to working 22 hours per week on the national living wage). The exceptions are couples with children and disabled families that claim support for housing costs, for whom work allowances today are more generous than initially conceived, and lone parents who claim support for housing costs, whose work allowances are as intended in 2012.
Reinstating the 2012 plans for all family types for whom work allowances have since fallen37 would benefit the poorest fifth of households more than even the most generous variant of the NICs policy (raising all NICs thresholds to £12,500). Assuming full take-up of universal credit, the poorest 10% of households would see their incomes rise by 0.8% on average, by around £80 a year, substantially more than the 0.0–0.2% increase under the different NICs options set out above. Unlike raising the NICs threshold, no households would lose from raising work allowances.
Table 8.4. Planned and current universal credit work allowances in 2019–20, £ per month
Family type | 2012 planned allowances | 2019–20 allowances | % difference |
Not claiming support for housing costs |
|
|
|
Single, no children | £120 | £0 | –100% |
Lone parent | £796 | £503 | –37% |
Couple, no children | £120 | £0 | –100% |
Couple with children | £581 | £503 | –13% |
Disabled | £703 | £503 | –28% |
|
|
|
|
Claiming support for housing costs |
|
|
|
Single, no children | £120 | £0 | –100% |
Lone parent | £287 | £287 | 0% |
Couple, no children | £120 | £0 | –100% |
Couple with children | £240 | £287 | 20% |
Disabled | £209 | £287 | 37% |
Note: 2012 planned levels are uprated to 2019–20 using the method set out in the 2012 Autumn Statement: rising by 1% a year in 2014–15 and 2015–16 and with inflation thereafter.
Source: Office for Budget Responsibility, Economic and Fiscal Outlook: March 2019, https://obr.uk/efo/economic-fiscal-outlook-march-2019/ and J. Browne, A. Hood and R. Joyce, ‘The (changing) effects of universal credit’, The IFS Green Budget: February 2016, https://www.ifs.org.uk/uploads/gb/gb2016/gb2016ch10.pdf.
Nearly half (46%) of the gains from restoring the planned 2012 work allowances would accrue to the poorest fifth of households. In comparison, only 3% of the gains from (any option for) raising the NICs threshold would accrue to the bottom fifth. Because they concentrate gains on low-income households, raising work allowances to (at least) their planned 2012 levels would cost just £1.4 billion – half the cost of raising employee and self-employed NICs by £1,000, and less than a tenth of the cost of aligning all NICs thresholds with the personal allowance threshold.
The distributional consequences of reinstating 2012 work allowances, compared with the least and most generous variants of the NICs policy we consider, are shown in Figure 8.9. A government looking to put more money in the pockets of low earners could go one step further. At the same cost to the exchequer as raising employee and self-employed NICs thresholds by £1,000 (£3 billion), it could restore 2012 work allowances and further increase all work allowances by 20%. Such a policy would benefit the bottom half of the income distribution significantly more than the corresponding NICs cut. The poorest tenth of households, who barely benefit at all from the change in NICs thresholds, would see their net incomes rise by 1.3% on average (around £140 a year), compared with just 0.1% (£5 a year) under the NICs cut of the same cost. Average net incomes for those in the second poorest decile of households would rise by 1.7%, or around £310 a year, compared with 0.1% (£25 a year) under the corresponding NICs cut.
Figure 8.9. Distributional effects and cost of raising NICs thresholds and universal credit work allowances (WAs)
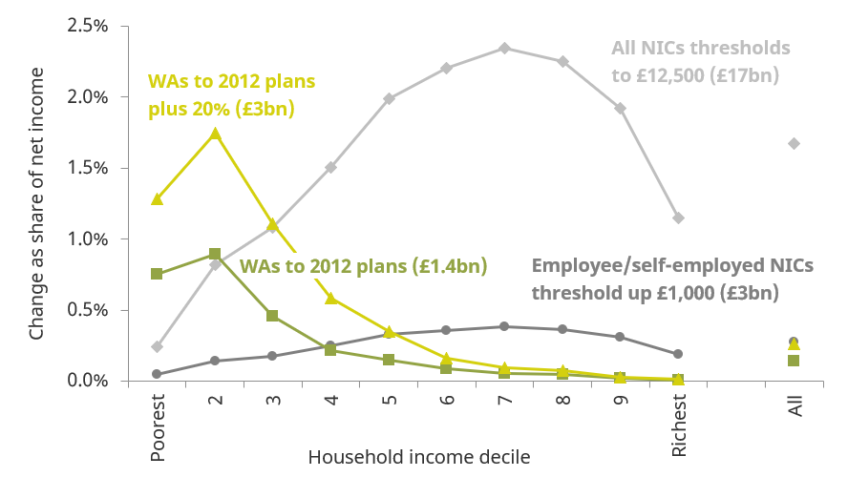
Note: ‘WAs to 2012 plans’ refers to reinstating 2012 plans for all family types for whom work allowances have since fallen – that is, not for couples with children and disabled families claiming support for housing costs, for whom current work allowances are more generous. Assumes full take-up of benefits. Income deciles are derived by dividing all households into 10 equal-sized groups according to income adjusted for household size using the modified OECD equivalence scale.
Source: Authors’ calculations using Family Resources Survey 2017–18 and TAXBEN, the IFS microsimulation model.
Increasing work allowances would also have different effects on work incentives from raising the NICs threshold. The financial incentive to be in work at all, and the financial incentive to increase earnings slightly, can be summarised by the participation tax rate (PTR) and effective marginal tax rate (EMTR) respectively.38 In both cases, higher effective tax rates indicate weaker work incentives.
Raising the NICs threshold slightly strengthens the incentive to be in paid work for those whose earnings exceed the current NICs threshold. Raising employee and self-employed NICs by £1,000 would reduce the PTRs of 25 million people by 0.5 percentage points on average. It would also strengthen the incentive to earn a little more for 0.6 million workers earning between the current and proposed NICs thresholds, reducing their EMTRs by 10 percentage points on average.39 But it has no effect on work incentives for the very lowest earners, who are not affected by the policy. Nor does it affect the incentive to earn a little more for workers earning more than the proposed NICs threshold.
Higher work allowances mean stronger financial incentives to have at least one person in the family in paid work. But because they give some families more universal credit than they would have had, whilst not changing the fact that families will lose universal credit if their combined earnings rise high enough, they tend to mean weaker financial incentives to have a second person in paid work. They can also either strengthen or weaken incentives for some people already in work to increase earnings further, depending on the details of their circumstances.
Restoring 2012 work allowances and further increasing all work allowances by 20% would strengthen incentives to be in paid work (that is, reduce PTRs) for 0.7 million people in the bottom 10% of the earnings distribution, and weaken incentives to be in paid work for 0.2 million people in the bottom 10%, with the remaining 2.1 million unaffected. Of those who see their PTRs rise, 0.1 million see a rise of over 10 percentage points, and of those who see their PTRs fall, 0.3 million see a fall of over 10 percentage points. The policy very slightly weakens average incentives to be in paid work for people further up the earnings distribution. Among those above the 10th percentile of earnings, 4.4 million see their PTRs rise (0.2 million by more than 10 percentage points) and 2.3 million see their PTRs fall (0.3 million by more than 10 percentage points).
The policy strengthens incentives to earn slightly more for 0.4 million people across the earnings distribution and weakens them for 0.5 million people. On average, EMTRs under increased work allowances are very slightly (0.6 percentage points) higher than under the current system. Of those who face weaker incentives to earn slightly more under the policy, nearly all see their EMTRs rise by more than 10 percentage points, and of those who face stronger incentives, 0.1 million see their EMTRs fall by more than 10 percentage points.
Figure 8.10. PTR and EMTR in current system (solid line), raising employee/self-employed NICs threshold by £1,000 (dotted line) and increasing 2012 planned work allowances by 20% (dashed line)
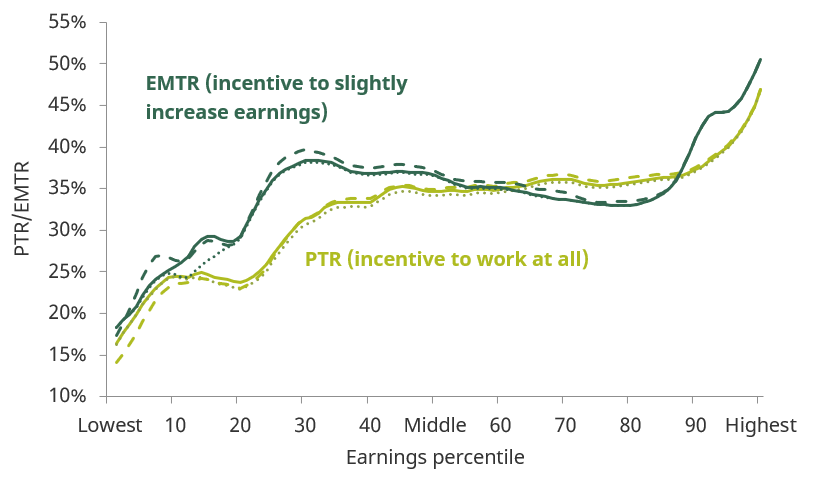
Note: PTR and EMTR curves have been smoothed. Only estimated for people in paid work.
Source: Authors’ calculations using Family Resources Survey 2017–18 and TAXBEN, the IFS microsimulation model.
Figure 8.10 shows average PTRs and EMTRs at different levels of earnings under the current system (solid line), the policy of raising the employee and self-employed NICs threshold by £1,000 (dotted line), and the alternative policy of raising work allowances with the same total cost (dashed line).
One could introduce further reforms to try to mitigate adverse effects of work allowances on work incentives; for example, one could introduce a separate work allowance for second earners. But the basic point remains that any increase in a means-tested benefit will weaken work incentives for some people. Notwithstanding these caveats, raising universal credit work allowances is clearly a much more cost-effective way of targeting support at low-earning families than raising the NICs threshold.
8.5 Conclusion
The government has expressed a desire to cut incomes taxes and National Insurance contributions, with the stated aims of taking people out of higher-rate tax, helping low earners and stimulating the economy. We estimate that the proposed rise to the higher-rate threshold would cost at least £9 billion if implemented in the next fiscal year, and it would take the number of higher-rate taxpayers to its lowest level since the UK’s individual income tax system began in 1990–91. Raising the point at which people start paying NICs would cost around £3 billion for each £1,000 that it is raised, or £5 billion if employer NICs were included.
The combined cost of the policies depends on how gradually the HRT is raised, how much the NICs thresholds are raised by, and whether the increase applies to employer NICs. If the higher-rate threshold is raised to £80,000 in 2020–21, the total cost to the exchequer is around £19 billion if employee and self-employed (but not employer) NICs thresholds are raised to £12,500, and around £12 billion if they are raised by £1,000. If employer NICs are raised in tandem, the estimated costs would be £26 billion and £13 billion respectively. To put these numbers in further context, they would imply a drop in revenue from income tax and National Insurance contributions of 3–7%.
As we have outlined in this chapter, both of these policies on their own benefit high earners more, so it is not surprising that their combined effect does as well. The richest tenth of households could gain up to £3,500 a year if the higher-rate threshold is raised in 2020–21 and all NICs thresholds are aligned with the personal allowance, whilst the poorest tenth of households would gain less than £30 a year on average.
Given the government’s intention to overhaul the direct tax system radically and the amount of money it appears willing to spend, it would do well to take the opportunity to rectify deficiencies in the current system in the process. In particular, it should remove the arbitrary and opaque spike in marginal tax rates caused by the withdrawal of the personal allowance from £100,000. To offset some of the cost, the government could allow the 45% rate to kick in at the (new, higher) higher-rate threshold. Doing so would largely preserve the tax cut to those on high incomes that the prime minister clearly intends. It would return us to a simpler income tax system with just two rates (20% and 45%), in line with the chancellor’s stated aim to simplify the tax system. It would cost £1 billion more than the prime minister’s plans, but could be made revenue neutral (with respect to the prime minister’s plans) by setting the higher-rate threshold at £75,000 rather than £80,000.
Successive governments have fallen prey to the temptation to fixate on the totemic income tax at the expense of NICs, distorting tax policy – for example, by raising the income tax personal allowance considerably since 2010 while doing nothing to the point at which NICs become payable. One might then consider the prime minister’s focus on NICs both welcome and long overdue. That said, a primary stated objective of this is to help the low-paid. There are better-targeted ways of doing that than any changes to direct taxes. Only 3% of the total tax cut from (any variant of) raising the NICs threshold accrues to the lowest-income fifth of households. The government could target low-earning families much more effectively by raising work allowances under universal credit, which would deliver higher benefits to the lowest-paid working households for a fraction of the cost.
Endnotes
Authors


Xiaowei Xu
Xiaowei joined the IFS in 2018 and works in the Income, Work and Welfare sector.
More from IFS
Understand this issue


Policy analysis


Academic research


