
Downloads
The changing cost of childcare
PDF | 589.92 KB
Early education and childcare can have a critical impact both on helping children to develop and in supporting parents (especially mothers) to work. But childcare can also have a significant impact on the disposable income – and, hence, living standards – of families with very young children. Rapidly rising prices and a wider ‘cost of living crisis’ have seen debates on the extent and design of support with childcare costs move up the political agenda in recent months.
In this report, we discuss how the cost of childcare has changed over time, and how it varies across the country and between different types of families. While methodological issues mean that common international comparisons overstate the degree of difference between England and other countries, we show that England remains an expensive country for childcare even after correcting for the most significant issues. This could be linked to staff-to-child ratios that are tight compared with most European countries, though there are trade-offs in setting these legal limits that could justify this policy choice. And, while there is a wide (and often confusing) range of government support for early education and childcare in England, we show that take-up rates differ widely across these programmes.
Key findings
- More than half of families with a pre-school-age child made no payments towards childcare in 2019. Among families whose children are aged 1 and 2, this is due to families either not using childcare (20%) or using unpaid, informal settings such as care from grandparents (33%). 85% of children aged 3 and 4 use some formal childcare; two-thirds of these households pay less than £20 per week for it. Half of 3- and 4-year-olds do not take up their full entitlement to funded childcare hours. Greater support with childcare costs (especially at younger ages) could help these families use more formal childcare, but will not immediately ease existing pressures on their budgets.
- While many families have low or no weekly childcare costs, some families pay very high amounts. This is most strongly related to the age of a child – among families using formal childcare, the median family with a 1-year-old spent over £90 a week in 2019. This falls to around £45 among 2-year-olds and less than £5 for 3- and 4-year-olds. A quarter of families using formal childcare and earning between £20,000 and £30,000 a year spent more than £100 a week on childcare for their 1- to 2-year-old – equivalent to more than 17% of their pre-tax income.
- Overall, 16% of families using formal childcare for a pre-school-aged child report finding it difficult or very difficult to manage these costs. The share is somewhat higher in the middle of the income distribution; a fifth of families earning between £30,000 and £65,000 and using formal childcare say they find it difficult or very difficult to manage their childcare costs. Among all families with a child aged 0–4 (regardless of whether they use formal childcare), a tenth report difficulty meeting childcare costs.
- Location is an important driver of costs. Among formal childcare users, median spending per week was highest in the East Midlands (around £40) and lowest in London (under £10). But some families in London pay huge amounts per week – at the 90th percentile, weekly childcare spending in London stood at nearly £350. That is more than double the 90th percentile in most other regions.
- The cost of childcare in England is high compared with other countries, and has risen quickly over time. According to data from one survey, the cost of a part-time nursery place for a child under 2 grew by 60% in cash terms between 2010 and 2021 – twice as fast as average earnings, and much higher than the 24% growth in overall prices in the same period.
- Childcare ratios are tighter in England than in most other European countries, particularly for younger children. England (and the other UK nations) allows the smallest number of 1-year-olds per member of staff in Europe, and only Norway has tighter ratios for 2-year-olds. Ratios for 3- and 4-year-olds are considerably looser and much less likely to act as a binding constraint; in 2021, at least 40% of providers took on fewer 3- and 4-year-olds than the staffing ratios would have permitted.
- While some parts of the early years system are providing substantial support with childcare costs, significant improvements to tax-free childcare are needed. While over 90% of eligible households are aware of the 15-hour free entitlement for 3- and 4-year-olds, only 4 in 10 parents of pre-school-aged children had heard of tax-free childcare in 2019. Even once the scheme has been explained, nearly 40% of potentially eligible families say they will not apply – often due to confusing eligibility rules or perceived hassle of the application process.
1. Introduction
Early education and childcare can have a critical impact both on helping children to develop and in supporting parents (especially mothers) to work. But childcare can also have a significant impact on the disposable income – and, hence, living standards – of families with very young children. Rapidly rising prices and a wider ‘cost of living crisis’ have seen debates on the extent and design of support with childcare costs move up the political agenda in recent months.
In this report, we discuss how families’ out-of-pocket childcare costs have changed over time, and how they vary across the country and between different types of families. While methodological issues mean that common international comparisons overstate the degree of difference between England and other countries, we show that England remains an expensive outlier even after correcting for the most significant issues. England (and the rest of the UK) is also an outlier in its staff-to-child ratios, which particularly for younger children are much tighter than those in most other European countries.
We also examine the role that government support for childcare costs plays. While there is a wide (and often confusing) range of programmes in place, we show that take-up rates for different types of support differ widely. Extraordinarily, the majority of families with young children have never even heard of the government’s flagship tax-free childcare programme (which provides a 25% top-up on childcare spending through dedicated accounts).
Families use many different arrangements to look after their children in the pre-school years. Grandparents, friends and other relatives are important sources of care, especially for the youngest children. These ‘informal’ arrangements are particularly important for parents who need childcare outside of standard hours or in irregular patterns.
In this report, however, we focus on the use – and cost – of more formal childcare arrangements before children begin school. This broadly includes nurseries, pre-schools, childminders, babysitters, nannies and clubs. We use data from the 2019 Childcare and Early Years Survey of Parents, described in more detail in Box 2.1, to describe the out-of-pocket costs paid by parents and how these vary for different types of families.
Our focus in this report is on the cost of childcare and the extent to which government support helps families manage these costs. Of course, any early years system also needs to consider the impact that early education and care has on children’s development and on parents’ ability to work. Any policy proposals that aim to reduce costs must also consider the wider impacts on quality or accessibility if they are to be acceptable to families and childcare providers.
In this report, we start by outlining the use of formal childcare among children of different ages. We then examine how much families with different characteristics spend on formal care – both in total over the course of a week, and per hour of care they receive. We explore how current childcare prices in England compare both historically and internationally and discuss how staff-to-child ratios in England compare with those in other European countries. Finally, we analyse the extent to which existing government programmes support families with the cost of childcare.
2. Trends in childcare prices
There is no one ‘typical’ experience of the childcare system. As we show in this section, there is huge variation in the amount of care, the type of care and the cost of care that families use.
2.1 Use of formal childcare
The vast majority of children spend some time being looked after by people who are not their parents. As Figure 2.1 shows, in 2019 only about one in five 1-year-olds did not use any childcare; for 3- and 4-year-olds, the figure was about one in twenty.
As children get older, they are much more likely to be enrolled in formal childcare. Just over a third of 1-year-olds are using some formal childcare, compared with 85% of 3- and 4-year-olds.
Differences by age in the use of formal childcare have a range of causes, including different prices and families’ preferences. One important cause is likely to be the pattern of government support, especially through the ‘free entitlement’ to funded childcare hours. Under this programme, 3- and 4-year-olds are entitled to either 15 or 30 hours a week of funded childcare; 2-year-olds in the 40% most disadvantaged families are also eligible for 15 hours a week. These funded childcare programmes – which we explore in more detail in Section 3 – reduce the cost of formal care for eligible children, potentially increasing take-up.
Box 2.1 provides more detail on the data underlying these figures. Since these data – the latest available – were collected in 2019, they provide a snapshot of the childcare market before the COVID-19 pandemic. During the pandemic, lockdowns, public health concerns and a changing labour market all reduced demand for childcare. National data on the take-up of funded childcare hours show that take-up among 3- and 4-year-olds fell from 93% in January 2020 to 90% in January 2021; among 2-year-olds, take-up fell more steeply, from 69% to 62%.
While Figure 2.1 shows that a large share of pre-school children use at least some formal childcare, the amount of care used varies across families. Figure 2.2 focuses on children using at least some formal childcare and shows the distribution of weekly hours of care.
Figure 2.1. Share of children using formal childcare, by age (2019)
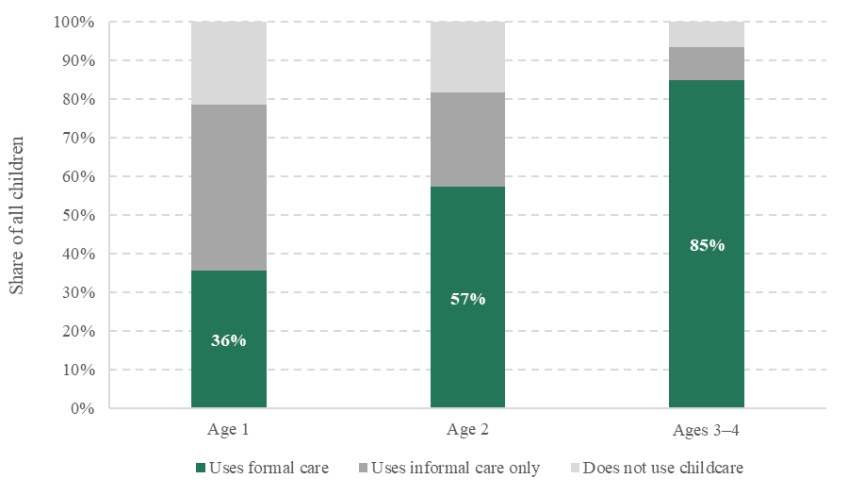
Note: Formal childcare includes nurseries, playgroups/pre-schools, childminders, babysitters, nannies and clubs. Informal childcare includes any time a child is under the care of someone who is not the main care-giver or their partner/spouse, and not at one of the listed formal care providers. The sample excludes 4-year-olds who have started school.
Source: Authors’ calculations using the Childcare and Early Years Survey of Parents, 2019.
Figure 2.2. Weekly hours of formal childcare among formal childcare users, by age (2019)
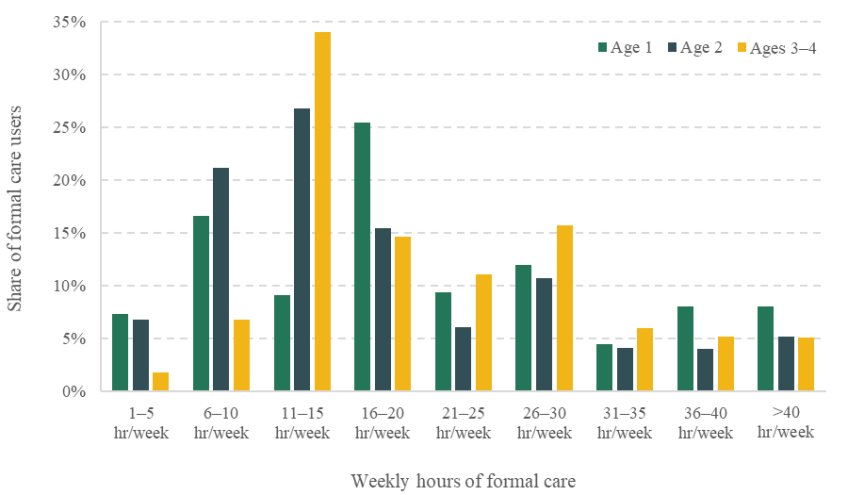
Source: Authors’ calculations using Childcare and Early Years Survey of Parents, 2019.
Among the third of 1-year-olds using formal childcare, the most common arrangement is to use between 16 and 20 hours of childcare a week, corresponding roughly to part-time work. A quarter of families use 10 hours or fewer a week. The distribution for 2-year-olds looks similar, except that 2-year-olds are more likely than younger children to use 11 to 15 hours of care a week; this spike is likely driven by the 15-hour funded childcare entitlement for disadvantaged 2-year-olds.
The distribution of hours among 3- and 4-year-olds looks quite different. By far the most common arrangement is using between 11 and 15 hours of care a week – suggesting that many 3- and 4-year-olds are using up their part-time childcare entitlement, but not using more formal care. There is a smaller spike at 26 to 30 hours of care, where the 30-hour extended entitlement tops out. At all ages, a significant minority of around 15–20% of families use more than 30 hours of formal childcare each week.
Box 2.1. Data description
In this report, we primarily use data from the 2019 Childcare and Early Years Survey of Parents (CEYSP). The survey focused on a representative sample of families in England with a child aged 0–4 (though we drop 4-year-olds who have already started school from our analysis). We focus on ‘formal’ childcare, which includes time spent at nursery, pre-school and clubs, or with a childminder, nanny or babysitter.
We rely on the CEYSP since it contains detailed information about the types of childcare that children use, the length of time they spend in childcare, the costs to families, and the role of government support programmes. The CEYSP data set also has some limitations; two of these are particularly important for this report:
- First, information on weekly childcare spending is collected by asking respondents how much the family spent, out of its own pocket, on childcare providers in a given reference week. Data are not provided on the value of external support for childcare (e.g. from government entitlements or employer-provided childcare).
- Second, the data set has only coarse information about income for the entire family, not individual parents. This means we are not able to compare the cost of childcare with any one parent’s wage or weekly earnings.
2.2 Spending on formal childcare
To give a sense of how important childcare is in family budgets, Figure 2.3 shows the average weekly cost for formal childcare among families with children of different ages. We show costs both for all families using any childcare (paid or not) and for those using any formal childcare.
Particularly among families using formal childcare, there is a clear age gradient – among the third of 1-year-olds using formal childcare, the median family (shown in purple) spent over £90 a week on formal childcare in 2019, twice as much as the median family with a 2-year-old. Families with 3- and 4-year-olds enrolled in formal childcare spent less than £5 a week at the median; this reflects the large share of families who do not exceed their free entitlements.
However, as Figure 2.1 shows, younger children are also less likely to be enrolled in formal childcare. Looking across all families who use any childcare (including informal care by grandparents or friends), median spending on formal childcare therefore appears much lower (and much more even across ages 1 and 2). At the far left of Figure 2.3, we show weekly childcare costs among all families. At all ages, the median family pays nothing for formal childcare.
Figure 2.3. Mean and median weekly cost of formal childcare, by age group (2019)
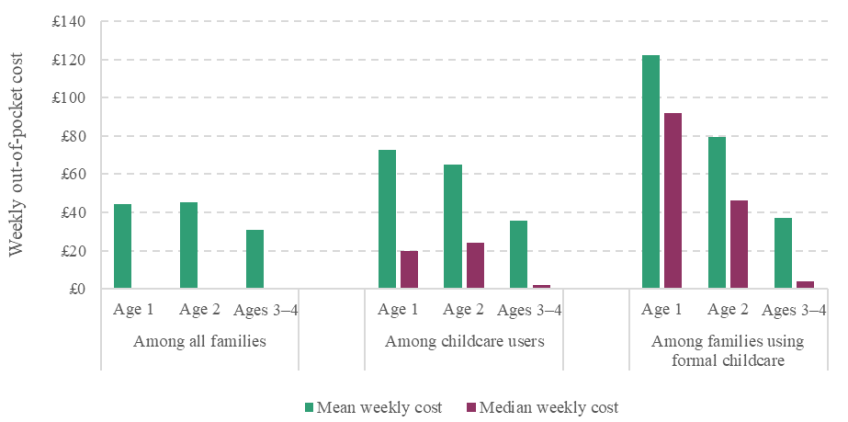
Note: The median family with a child aged 1, 2 or 3–4 (the far-left group on the graph) does not pay anything out of pocket for formal childcare. ‘Among childcare users’ includes families using any formal or informal care (e.g. from grandparents).
Source: Authors’ calculations using Childcare and Early Years Survey of Parents, 2019.
Figure 2.3 also shows the average (mean) weekly cost of childcare, in green. These means are much larger than the median weekly cost, reflecting a large proportion of people paying little or nothing for formal childcare but very high costs among a smaller group who do pay. Across all families, the average weekly cost of formal childcare is around £40 for 1- and 2-year-olds, and £30 for 3- and 4-year-olds. For families with a 1-year-old in formal care, the average weekly cost exceeds £120.
The difference between the mean and median costs in Figure 2.3 points to the importance of understanding the distribution of spending on childcare. Figure 2.4 therefore plots the share of formal childcare users spending different amounts each week.
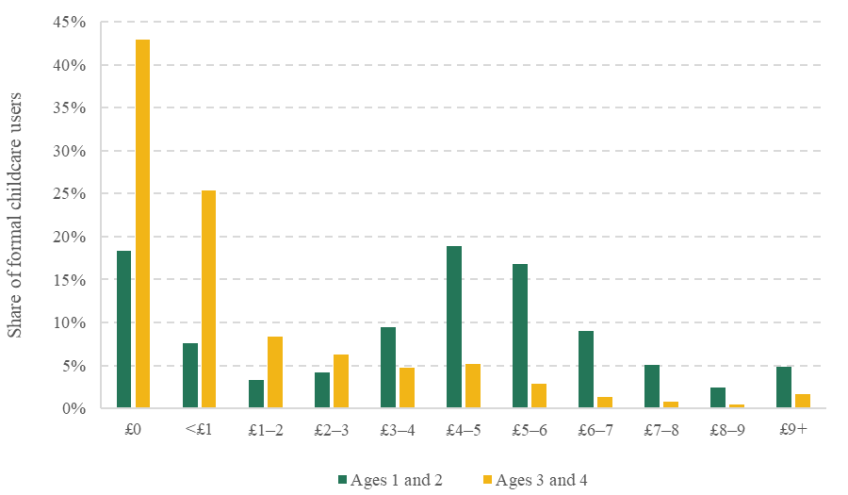
Figure 2.4. Distribution of weekly spending on formal childcare, among formal childcare users (2019)
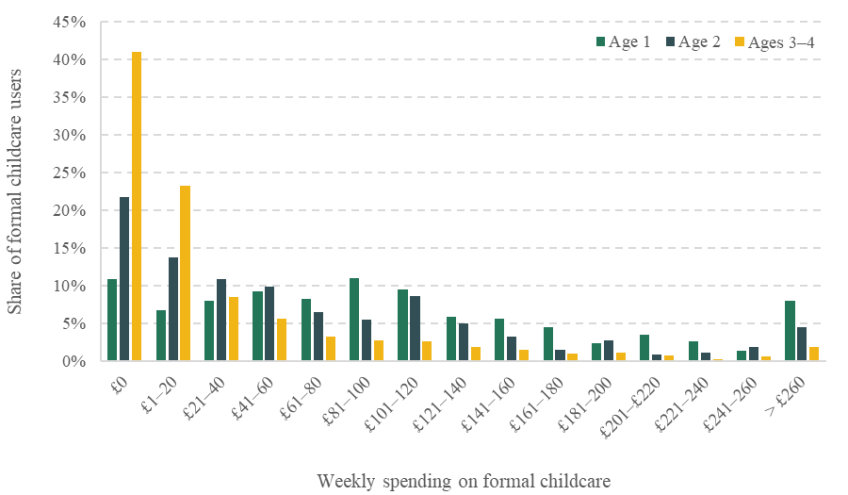
Note: Conditional on using some formal childcare. Families reporting no spending on formal childcare may be using their free entitlement hours (ages 3–4, and some 2-year-olds) and/or using other forms of support, such as workplace nurseries.
Source: Authors’ calculations using Childcare and Early Years Survey of Parents, 2019.
For nearly two-thirds of parents of 3- and 4-year-olds, childcare expenses are typically less than £20 a week – still a significant amount of money for those on very low incomes, but around 3% of median weekly household earnings for families with children this age. About 40% of 3- and 4-year-olds, and 20% of 2-year-olds, pay nothing for their formal childcare, likely due to free entitlement hours (especially at older ages) and other support such as subsidised workplace nurseries (for younger children).
By contrast, there is a significant minority of parents of younger children paying much more than this. 15% of families with a 1-year-old in formal care spent more than £200 a week on childcare – equivalent to more than £10,000 a year. Among families with a 1- or 2-year-old in full-time formal care (40 hours or more per week), half spent more than £240 a week on childcare fees for their young child. Even among families with a 1-year-old where all parents are in work, median weekly earnings in 2019 were £900 – so these childcare expenses may cause significant pressure.
Childcare costs and family income
Figure 2.5 explores this further by showing how spending on childcare relates to family income. In general, the relationship is clear: families with higher incomes are more likely to spend more on childcare (both because they are willing to pay higher prices per hour, and because they on average work more hours and so use more childcare each week). Among families with 3- and 4-year-olds, the highest childcare costs are typically paid by households with a total pre-tax income of £45,000 or more; it is quite unusual for families with lower incomes to spend more than £100 a week on childcare.
Figure 2.5. Distribution of weekly spending on formal childcare by pre-tax family income, among formal childcare users (2019)
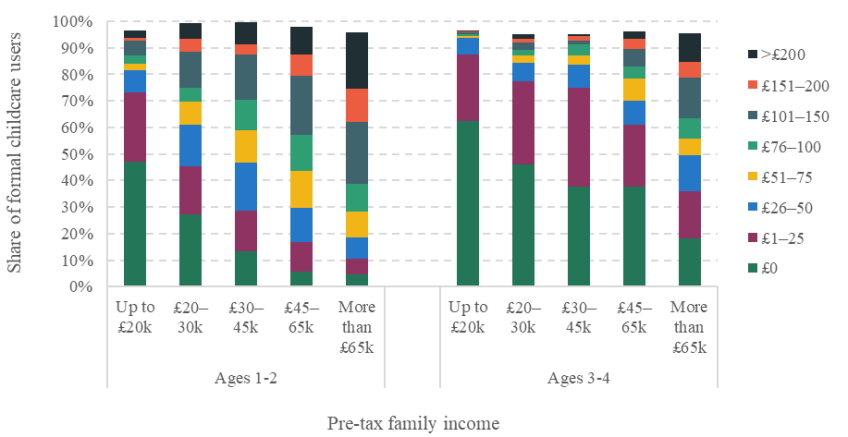
Note: Since some families do not report their childcare costs, columns do not sum to 100% of families. £20,000 of annual pre-tax income is equivalent to £385 a week; £30,000 is equivalent to £577; £45,000 is equivalent to £865; and £65,000 is equivalent to £1,250.
Source: Authors’ calculations using the Childcare and Early Years Survey of Parents, 2019.
Among families using formal childcare for their 1- to 2-year-olds, though, high childcare costs are common even for those on lower and middle incomes. For example, 13% of families using formal childcare for their 1- to 2-year-old earn between £20,000 and £30,000 a year (before tax). A quarter of these families spent more than £100 a week on formal childcare fees for their 1- or 2-year-old – for these families, even under the most generous assumptions, childcare eats up more than 17% of their total pre-tax income. In some cases, particularly where families have several young children, spending could be much higher.
Difficulty affording childcare
Figure 2.5 shows that families with high out-of-pocket childcare costs tend to be better off; 43% of families spending more than £100 a week on childcare for 1- and 2-year-olds, for example, are earning more than £65,000 a year (compared with 17% of all families with a 1- or 2-year-old). This makes it somewhat challenging to work out which families have the most difficulty paying their childcare costs.
Figure 2.6. Self-reported difficulty in meeting childcare costs, among formal childcare users
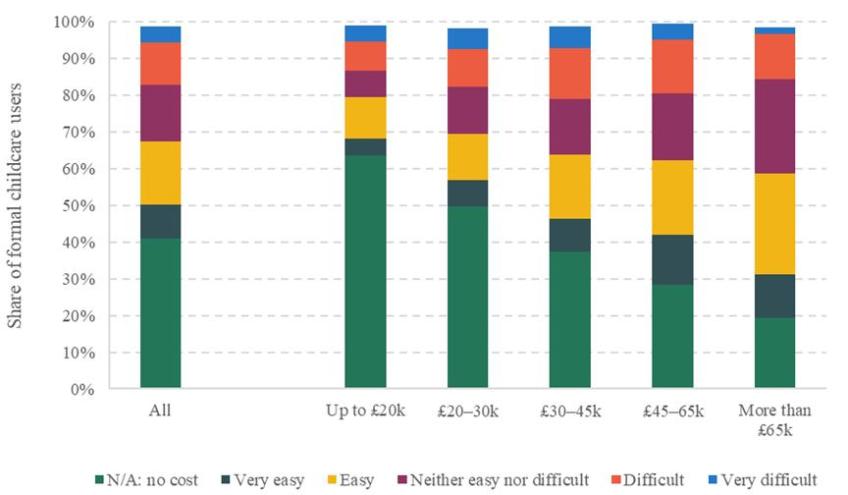
Note: Sample is all families with a child aged 0–4 who use formal childcare (for any child in the household). Families were asked about their difficulty in affording their total childcare costs for all children in the household. Columns do not total 100% because of non-responses.
Source: Authors’ calculations using the Childcare and Early Years Survey of Parents, 2019.
In Figure 2.6, we plot the share of families using formal childcare who report that it is (very) easy, (very) difficult, or neither easy nor difficult to manage their current level of childcare costs. Overall, 16% of families using formal childcare for a pre-school-aged child report finding it difficult or very difficult to manage these costs. The share is somewhat higher in the middle of the income distribution; a fifth of families earning between £30,000 and £65,000 and using formal childcare say they find it difficult or very difficult to manage their childcare costs.
Since not all families use formal childcare, it is also helpful to consider what proportion of all families (not just formal childcare users) report difficulty meeting their childcare costs. Overall, just over 10% of families with a pre-school child say they find it difficult or very difficult to meet childcare costs (20% say it is easy or very easy, 12% find it neither easy nor difficult, and 55% are either not using or not paying anything for formal care). Reported difficulty increases slightly among better-off families, to 15% of those earning between £45,000 and £65,000.
Differences in childcare costs
The cost of childcare varies enormously – by the age of the child and the number of hours of care needed, but also by the type of setting and the local area. In this subsection, we explore how the cost of formal childcare differs along these latter channels.
In Figure 2.7, we look at the median weekly spending by type of setting and age. Despite a perception that childminders are a cheaper option, we find that weekly spending on childminders is higher than that on nurseries at all ages. This could reflect different prices or a different number of hours of care.
Figure 2.7. Median weekly spending on formal childcare, by type of setting

Note: Conditional on using each form of childcare.
Source: Authors’ calculations using the Childcare and Early Years Survey of Parents, 2019.
Figure 2.8. Weekly spending on formal childcare among formal childcare users, by region
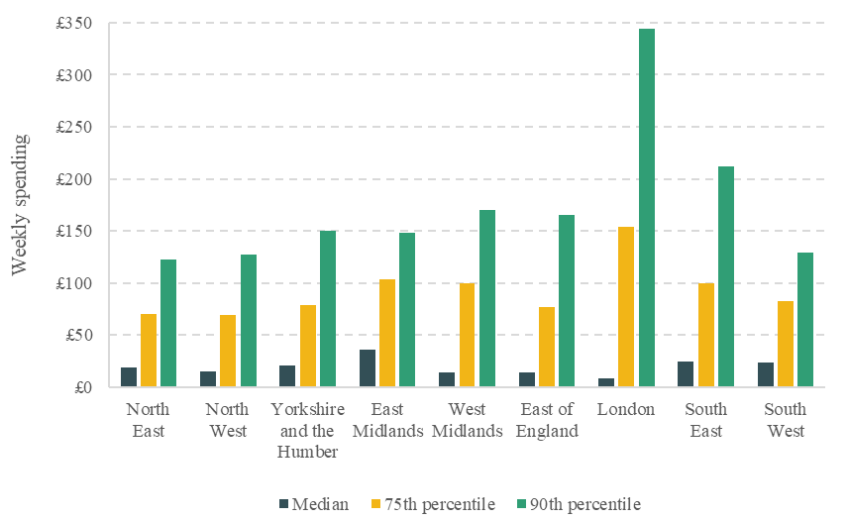
Note: Median, 75th and 90th percentile childcare spending per child. Conditional on using some formal childcare. Sample includes all children aged 0–4 years that do not attend school.
Source: Authors’ calculations using the Childcare and Early Years Survey of Parents, 2019.
Figure 2.8 pools children of all ages and displays the median, 75th percentile and 90th percentile of childcare expenditure (among families using formal childcare) by region in England. At the median, childcare users in the East Midlands spend the most on childcare – £36 per week. Perhaps surprisingly, median formal childcare costs are lowest in London, at £8.
But these median values hide greater variation at the top of the distribution. Although London has the lowest median at £8 per week, it has the highest 75th percentile of weekly childcare spending, at around £150. At the 90th percentile, families in London spent nearly £350 a week on formal childcare in 2019. For the majority of other regions, the 90th percentile of spending is less than half that in London.
2.3 The hourly cost of childcare
So far, we have focused on families’ weekly out-of-pocket spending on childcare fees (for a given child). Weekly spending gives a good indication of how childcare compares with earnings or with other cost pressures. It also makes it easier to compare across different ages and other types of spending. But it is possible that the differences we have observed so far are driven mainly by families making different choices about how much formal childcare to use.
Figure 2.9. Distribution of average spending per hour of childcare, among formal childcare users (2019)
Note: Average hourly cost of childcare across all types of formal childcare used in specified reference week.
Source: Authors’ calculations using the Childcare and Early Years Survey of Parents, 2019.
In Figure 2.9, we therefore plot the distribution of the average cost of formal childcare – the out-of-pocket cost families pay per hour of formal childcare they use. This average cost is different from the price of childcare (the amount families would have to pay to receive another hour of care), since the average cost reflects the benefit that families get from any free entitlement hours they receive.
Figure 2.9 shows that, in terms of average childcare spending per hour, 1- and 2-year-olds tend to fall into two groups: around a quarter of families spend less than £1 per hour on average, but nearly half spend somewhere between £4 and £6 per hour. This maps closely to the average price of formal childcare for the under-2s, which was £5.15 per hour in 2019 (Department for Education, 2019).
For 3- and 4-year-olds, around three-quarters of families report spending less than £2 an hour on average on childcare. This cost is much lower than what most parents spend for 1- and 2-year-olds, mainly because older children enjoy considerably more support from the free entitlement, which drives down the amount that families spend per hour of care they receive.
2.4 Trends in childcare prices
So far, we have focused on the level of childcare prices and how they compare with earnings. But it is also important to understand the trend that childcare spending has been on. In Figure 2.10, we therefore use data from Coram Family and Childcare’s annual Childcare Survey to show growth in childcare prices since 2010.
We need to focus on the price of childcare for children aged under 2, enrolled in a part-time (25-hour) place with a nursery or a childminder.1 Indexing prices to their 2010 levels, the figure shows that the cost of a part-time childminder place had risen 43% by 2021. For a part-time nursery place, the cost increase was 59%.
Figure 2.10. Growth in part-time childcare prices for 0- and 1-year-olds, average earnings and general prices since 2010
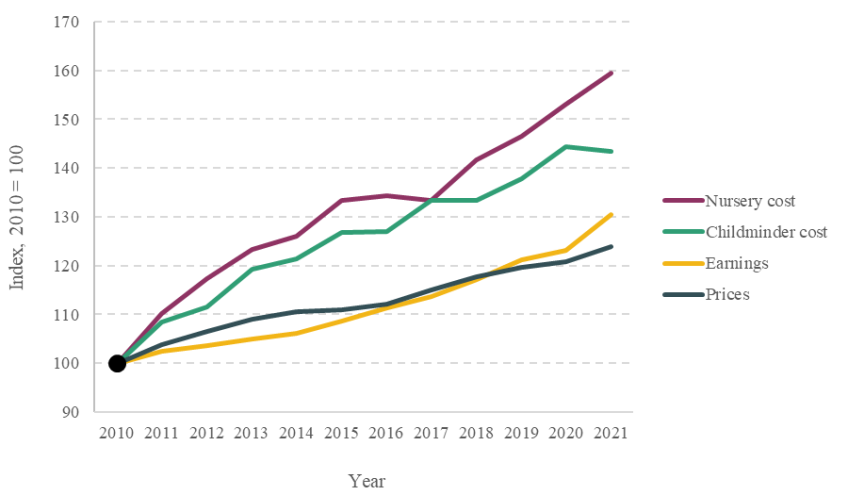
Note: Nursery and childminder costs show the cash-terms increase in the cost of part-time (25 hours/week) care for a child aged under 2 in England. ‘Earnings’ shows the cash-terms increase in average weekly earnings (seasonally adjusted). ‘Prices’ shows the increase in general economy-wide prices, as measured by the Consumer Prices Index.
Source: Coram Family and Childcare, Childcare Survey (various years). Office for National Statistics, ‘CPIH index 00: all items’, 16 February 2022. Office for National Statistics, ‘Average weekly earnings: whole economy level (£): seasonally adjusted total pay excluding arrears’, 15 February 2022.
This is much faster growth than for either general economy-wide prices (which grew by 24%) or average weekly earnings (which rose 30% over the same period). In real terms, this means that the cost of a childminder place was 16% higher, and the cost of a nursery spot nearly 30% higher, than they had been in 2010. Such rapid price growth is likely one reason for the increased attention on childcare as a major contributor to the cost pressures facing families.
Importantly, these figures only look at prices among children aged under 2. As we have shown above, childcare prices vary quite a bit by age, as does government support. The period considered in Figure 2.10 saw the introduction of both a part-time childcare entitlement for disadvantaged 2-year-olds and the extended 30-hour entitlement for 3- and 4-year-olds in working families. These will have significantly eased the cost pressures facing many families with slightly older children. They might also have contributed to the rapid growth of prices for the youngest children, as an increasingly generous ‘free childcare’ offer pushes childcare providers to raise prices on paid hours to cross-subsidise the children receiving government funding.
2.5 International comparisons
Accurately comparing the cost of childcare across countries is challenging: very different systems of recording public subsidies and out-of-pocket spending make it difficult to arrive at comparable figures. However, available figures suggest that childcare is more expensive in the UK than in many other high-income countries.
Figures 2.11 and 2.12 show how the total cost of childcare (including both parents’ out-of-pocket spending and public subsidies) compares with after-tax household income. Both figures assume a 2- and a 3-year-old, both using full-time, centre-based childcare. Figure 2.11 compares the total cost of this care with the after-tax household income of a family with two parents, both earning average wages. Figure 2.12 instead compares it with after-tax income for a single parent on the minimum wage. For both groups, the total cost of childcare in the UK is around twice the average for the OECD as a whole.
To arrive at these international comparisons of total childcare costs, the OECD looks for the best estimates available for each country. These are not always especially comparable. The OECD’s estimate for the cost of childcare in the UK, for example, is drawn from Coram Family and Childcare’s Childcare Survey (used in Section 2.4 of this report). But Coram’s figures for full-time care are based on 50 hours of childcare per week, while for most other countries the OECD uses estimates of full-time care based on 40 hours a week. We therefore show an ‘adjusted’ value for the UK in Figures 2.11 and 2.12, which simply rescales the OECD’s estimates by 0.8 (under the assumption that the total cost of 40 hours of care is around 80% of the total cost of 50 hours).
Figure 2.11. Gross childcare fees as a share of net household income for a two-earner couple on average wage (2020)

Figure 2.12. Gross childcare fees as a share of net household income for a single parent on minimum wage (2020)
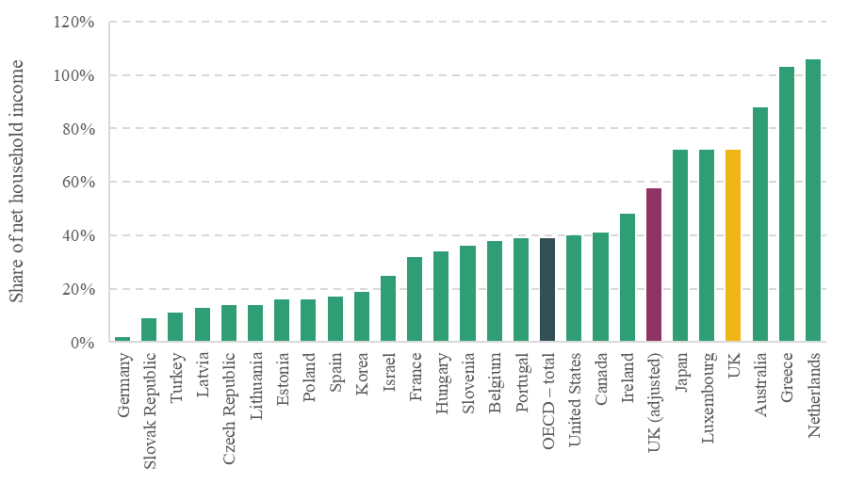
Note: Figures 2.11 and 2.12 show gross childcare fees as a share of net household income, inclusive of any public subsidy. Both figures assume a 2- and a 3-year-old, both using full-time, centre-based childcare. ‘UK (adjusted)’ is 80% of the value of the OECD’s estimate for the United Kingdom, reflecting the different number of hours making up full-time care (50 in the UK versus 40 in most other cases). Not all countries have 2020 data available in the OECD database.
Source: OECD, ‘Net childcare costs for parents using childcare facilities’, series ‘Gross childcare fees’. Authors’ calculations.
The approach of using the best local estimate of childcare costs can lead to other inconsistencies as well: while figures for the UK are relatively recent (from 2018), in other cases the OECD has used older figures without adjusting for growth in childcare prices (or inflation more generally).2 The OECD’s estimates for the UK also assume that the total cost of childcare for 2-year-olds is the same as that for 3-year-olds (including both parents’ out-of-pocket spending and public subsidies). This may lead to an overestimate of the cost of childcare for a 2- and a 3-year-old (since, on an hourly basis, care tends to be cheaper for older children). These issues are more difficult to correct for without unpicking the methods behind the data for all of the countries the OECD covers, so these are not addressed in the graphs.
2.6 Childcare ratios
Even after adjusting for differences in the number of hours considered, Figures 2.11 and 2.12 show that childcare in the UK remains expensive compared with other countries. Recently, the UK government has suggested that it will consider relaxing staff-to-child ratios in a bid to help drive down costs.
In the UK, minimum staff-to-child ratios depend on both the ages of children and the type of provider being considered. Table 2.1 shows how the legal staff-to-child ratio varies across the country. In most cases, policy in England is aligned with that in other UK nations – though group-based providers in Scotland allow each member of staff to look after five rather than four 2-year-olds.
Internationally, the UK ratios appear to be more of an outlier (see Figure 2.13). For 1-year-olds, the UK’s ratios are among the tightest in Europe; for 2-year-olds, only Norway has more stringent criteria. Among 3-year-olds, the UK is closer to the middle of the pack, based on a ratio of 13 children per staff member. However, there are still a number of countries that have much looser restrictions on ratios at this age.
Figure 2.13. Maximum number of children per staff member in centre-based early years provision among selected European countries, 2018–19
Panel A. For 1-year-old children
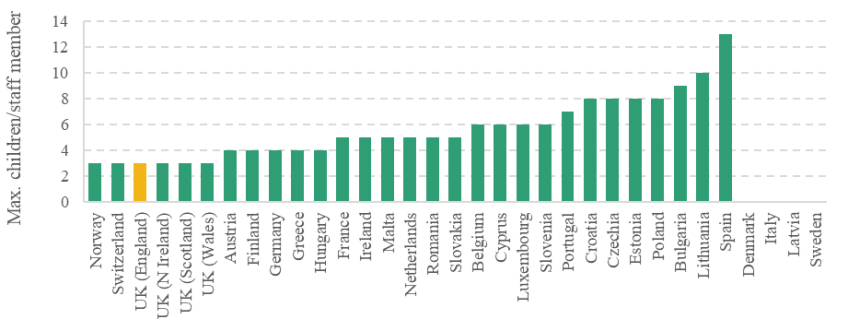
Panel B. For 2-year-old children
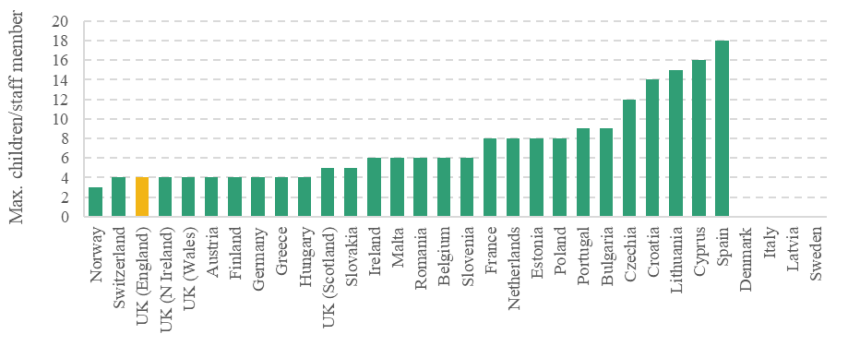
Panel C. For 3-year-old children

Note: Countries with no bar had no legal maximum for staff:child ratios in 2018–19. Note that Table 2.1 presents more recent ratios for UK nations (including tighter ratios for 3-year-olds in Wales and Northern Ireland).
Source: Figure C8 and annex A of European Commission / EACEA / Eurydice (2019).
Table 2.1. Indicative number of children allowed per staff member
| Group-based providers | Childminders | ||||
| Under 2 | Age 2 | Ages 3–4 | Under 1 | Ages 1–4 | Total numbers |
England | 3 | 4 | 8 or 13a | 1 | 3 | 6 children under 8 |
Scotland | 3 | 5 | 8 or 10b | 1 | 3 | 6 children under 12 |
Wales | 3 | 4 | 8c | 2 under | 3 | 6 children under 8 |
N. Ireland | 3 | 4 | 8 | 1 | 3 | 6 children under 12 |
a The minimum ratio is 1:13 if one of the staff holds a relevant degree-level qualification; 1:8 otherwise.
b Children in sessional (half-day) care may have a ratio of 1:10.
c Temporarily relaxed to 10 during COVID-19 pandemic.
Note: The table shows indicative ratios only. There is a range of additional factors that can affect ratios, including levels of qualifications and training, whether children being cared for are siblings and whether a childminder is looking after her/his own child.
Source: National early years frameworks; https://www.daynurseries.co.uk/advice/childcare-nursery-staff-to-child-ratios-in-the-uk.
The fact that the UK’s – and specifically England’s – childcare ratios are particularly tight in international comparison does not necessarily mean that they should be relaxed, for several reasons. First, tighter staff-to-child ratios in England might be a way of compensating for looser requirements on staff qualifications. Particularly for core practitioners working with younger children, the UK has less stringent qualification requirements than countries such as France, Germany, Finland or Norway (European Commission / EACEA / Eurydice, 2019).
Even if England increased qualification requirements for early years workers, the government might still choose to require tighter staff-to-child ratios in a bid to prioritise the quality of early years settings. Notably, countries such as Norway – whose early years system has been shown to significantly improve children’s outcomes3 – tend to have similar or tighter ratios than England.
Finally, Figure 2.13 shows the legal maximum number of children per staff member for each country, but it does not show what ratios typically apply in practice. It is possible that other countries allow settings to have more children per member of staff, but in practice these limits are rarely reached. In England, by contrast, legal limits on staff-to-child ratios do seem to bind, as Figure 2.14 shows. It is an open question whether relaxing these limits would feed through into lower prices – Figure 2.14 shows that any change to childcare prices is likely to be felt among younger age groups, where current ratios are a more binding constraint.
Figure 2.14. Childcare ratios among group-based providers in England, 2021
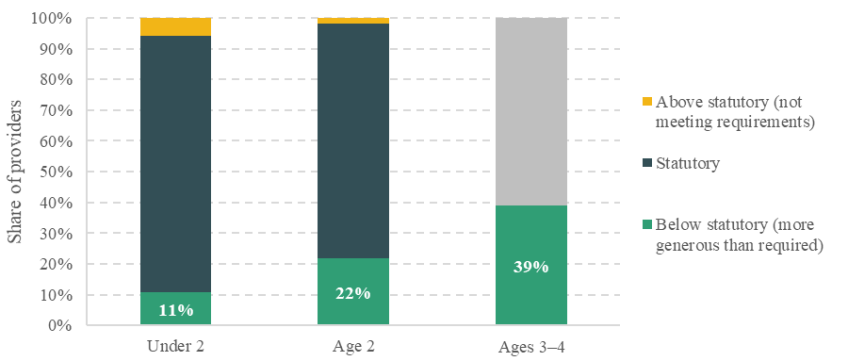
Note: ‘Below statutory’ refers to providers where staff:child ratios are more generous than required (i.e. where current statutory ratios are not binding). Since statutory ratios for ages 3–4 depend on staff qualifications, which are not included in the source data, the figures for ages 3–4 are a lower bound on the share of providers with below-statutory ratios.
Source: Tables 27–29 of the 2021 Childcare and Early Years Providers Survey.
3. Government support for childcare costs
There are already a number of programmes subsidising childcare and early education in England. These programmes have different focuses, summarised in Table 3.1: some target low-income families, while others are aimed at working parents with children. Some subsidise only government-regulated early education; others emphasise flexible childcare to help parents work. Some programmes are restricted to pre-school-aged children, while others cover a wider age range.
In this section, we examine families’ awareness and use of some of the major programmes of support.
3.1 Awareness of government support
There are major differences in how aware families are of some of the main programmes of support. At one end of the scale, 93% of families with pre-school-aged children have heard of the universal ‘free entitlement’ to 15 hours of funded childcare, available to all 3- and 4-year-olds. Awareness of other free entitlement programmes is somewhat lower, at around 80% for both the extended entitlement (30 hours a week, for 3- and 4-year-olds whose parents are in work) and the 2-year-old entitlement (15 hours a week for the 40% most disadvantaged 2-year-olds).4
The real outlier in Figure 3.1 is tax-free childcare, the programme that replaces employer-provided childcare vouchers. While tax-free childcare was initially due to be introduced from October 2015, in practice the roll-out was delayed until April 2017. Two years later, only 40% of parents with a young child had heard of the programme.
Across the board, awareness is higher among families that are eligible for each programme. Virtually all families predicted to be eligible for the 30-hour extended entitlement for 3- and 4-year-olds were aware of the programme. Awareness of the 15-hour entitlement for disadvantaged 2-year-olds is similar among eligible families and among all families with a 2-year-old (85% compared with 79% respectively). Tax-free childcare remains an outlier, with only 54% of eligible families aware of the programme.
Figure 3.1. Awareness of the main programmes of government support for childcare (2019)
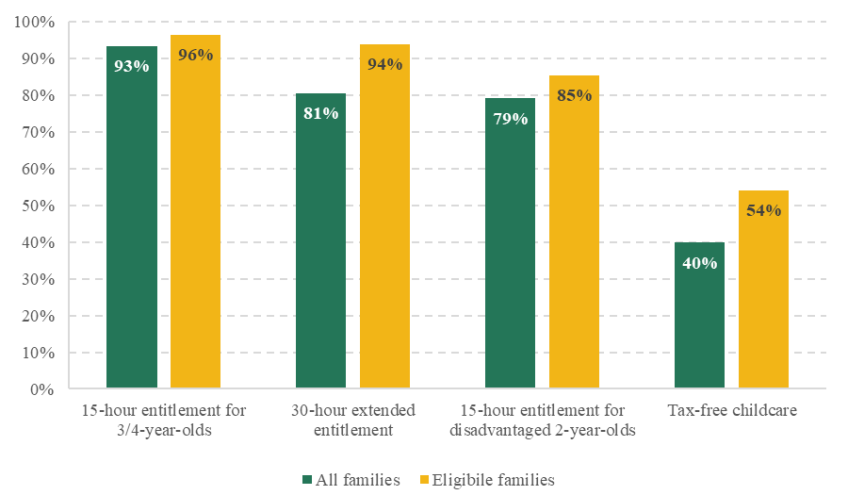
Note: For 2-year-old entitlement, the figure shows the share of parents of 2-year-olds aware of the programme (rather than the share of all parents of a 0- to 4-year-old). Identification of eligible families is detailed in Box 3.1.
Source: Authors’ calculations using data from the Childcare and Early Years Survey of Parents, 2019.
Table 3.1. Summary of programmes supporting early education and childcare in England
Type of policy | Programme | What is it? | Who gets it? | How many benefit? (2021 or latest available) |
Free entitlement | Universal offer | 15 hours/week, 38 weeks/year | All 3- and 4-year-olds | 1,210,000 children |
| Extended offer | Additional 15 hours/week | 3- and 4-year-olds whose parents worka and earn ≤£100,000 | 330,000 children |
| 2-year-old offer | 15 hours/week, 38 weeks/year | 40% most disadvantaged 2-year-oldsb | 125,000 children |
Subsidy through benefits system | Childcare support: working tax credit | Reimbursement of up to 70% of childcare expenses | Children aged 14 and younger in low-income working families (closed to new entrants)c | 95,000 families* |
| Childcare support: universal credit | Reimbursement of up to 85% of childcare expenses | Children aged 15 and younger in low-income working families | 185,000 children** |
Tax reliefs and other subsidies | Employer-supported childcare (including childcare vouchers) | Salary sacrifice scheme: 32% subsidy for basic-rate taxpayersd | Children aged 15 and younger whose parents are employed by a company offering a voucher programme (closed to new entrants)e | Not available – being phased out |
| Tax-free childcare | £2 government top-up per £8 in a designated account | Children aged 11 and younger in working families whose parents earn ≤£100,000f | 410,000 children |
VAT exemptions |
| VAT exemption worth up to 20% | Depends on provider/characteristics | Not available |
* As at April 2021. ** As at November 2021.
a In most cases, both parents (or the lone parent) must be in paid work with weekly earnings at least the equivalent of 16 hours at the relevant minimum wage.
b This includes looked-after children, children with special educational needs or an education, health and care plan, and those whose families receive certain means-tested benefits (e.g. income support, income-based jobseeker’s allowance, tax credits or universal credit). Caps on family income also apply in some of these cases.
c Childcare costs can be included for children until the week of 1 September after they turn 15, or 16 for young people with certain disabilities.
d Specifically, employees can divert some of their salary into buying childcare vouchers from their employer, but they do not pay income tax or National Insurance contributions on the money they use to buy the vouchers. Employers are also exempted from paying their side of the National Insurance contributions on these earnings.
e The childcare voucher programme is not open to self-employed parents, parents whose company does not offer vouchers, or parents who are not in work.
f Children stop being eligible on 1 September following their 11th birthday. For full details of eligibility, see https://www.gov.uk/tax-free-childcare.
Source: Adapted from table 2.1 of Britton et al. (2020). Free entitlement programmes – ‘Provision for children under five in England: January 2021’ (DfE). Working tax credit – table 8.3 of ‘Child and working tax credits statistics: provisional awards – April 2021’ (HMRC). Universal credit – table 7 of ‘Universal credit statistics, 29 April 2013 to 10 March 2022’ (DWP). Tax-free childcare – table 8 of ‘Tax-free childcare statistics, December 2021’ (HMRC).
Box 3.1. Identifying eligible families
In this section, we refer to eligible families when discussing the knowledge and use of government support programmes. Unfortunately, we do not directly observe eligibility in the data that we use. Instead, we model which families are likely to be eligible for each programme based on many of the eligibility criteria detailed in Table 3.1.
15-hour entitlement for 3- and 4-year-olds: A family is eligible if it contains a child aged 3 or 4 who has not yet started school.
30-hour extended entitlement: A family is eligible if it contains a 3- or 4-year-old and both parents in the family (or the lone parent) work 16+ hours a week. This means that there are two sources of misclassification in our data: we will wrongly classify families as eligible if one parent earns more than £100,000 a year (around 1% of families); and we will wrongly classify families as ineligible if parents work fewer than 16 hours a week, but earn more than the equivalent of 16 hours at the relevant minimum wage.
15-hour entitlement for disadvantaged 2-year-olds: A family is considered eligible if it contains a 2-year-old and the family is either economically disadvantaged (receiving tax credits) or the 2-year-old has an education, health and care (EHC) plan, a statement of special educational needs (SEN), or a long-standing illness or disability. We are not able to observe families receiving universal credit; however, universal credit (as opposed to tax credit) receipt was quite rare among working families with young children in 2019.a
Tax-free childcare: A family is considered eligible if both parents in the family (or the lone parent) are working 16+ hours a week and neither are receiving tax credits or employer provided childcare vouchers. As for the 2-year-old offer, we are not able to observe whether families receive universal credit (and so would be ineligible).
a In August 2019, when the CEYSP data collection finished, there were around 45,000 families claiming childcare support through universal credit (table 7 of Households on Universal Credit, from ‘Universal credit statistics, 29 April 2013 to 10 March 2022’). By comparison, around 300,000 families received childcare support through the tax credit system in 2018–19 (‘Child and working tax credits statistics: finalised annual awards – 2019 to 2020’).
3.2 Full use of the free entitlement
In terms of government spending, the most important part of support for childcare and early education are the three free entitlement programmes. This has become increasingly true since 2010: free entitlement spending has nearly doubled in real terms, from just under £2 billion to nearly £4 billion (IFS Education Spending microsite).
Take-up of the universal free entitlement for 3- and 4-year-olds is very high. In the mid 2000s, virtually all children used at least some of their free entitlement hours. Take-up rates have been on a downward trajectory for the last few years; they fell to 93% before the pandemic and to 90% in 2020–21, the lowest level in two decades (Farquharson et al., 2021).
As Figure 3.2 shows, the free entitlement programmes seem to shape families’ choices about how much childcare to use. Nearly 30% of families whose 3- or 4-year-old is eligible only for the 15-hour universal entitlement use precisely 15 hours of formal childcare each week. Precisely ‘using up’ free entitlement hours is less common for the extended 30-hour entitlement and for the 2-year-old offer, but even here between a tenth and a fifth of families use precisely as much care as they are entitled to.
Figure 3.2 also shows that a large share of families – 60% of those eligible for the extended entitlement and 65% of those eligible for the 2-year-old offer – do not take up their full entitlements. This means that policies aimed at cutting costs by expanding the entitlements of these groups would not immediately benefit these families’ budgets.
Figure 3.2. Hours spent in formal childcare in comparison with free entitlement
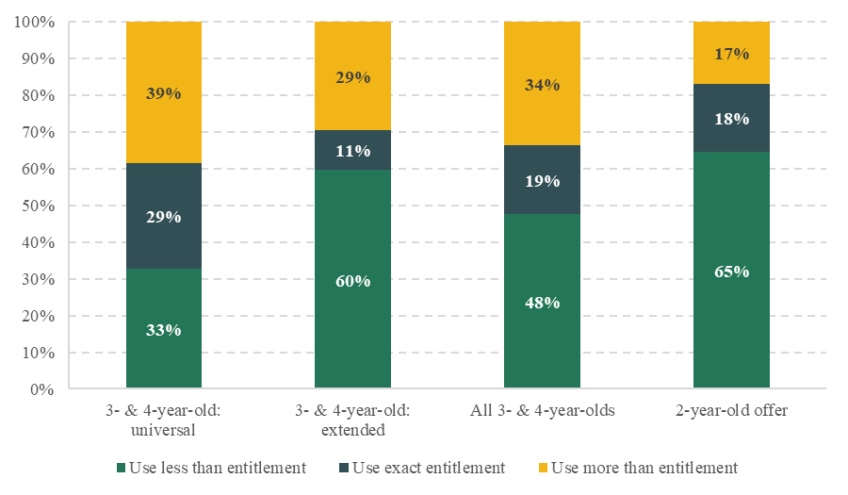
Note: Among children eligible for each entitlement. ‘Universal’ bar includes 3- and 4-year-olds only entitled to the universal offer.
Source: Authors’ calculations using Childcare and Early Years Survey of Parents, 2019.
3.3 The trouble with tax-free childcare
Tax-free childcare was introduced to replace employer-supported childcare vouchers. There are good arguments for changing the design of the system: childcare vouchers relied on employers to offer the scheme, and excluded self-employed parents completely. They also followed parents rather than children – so a two-earner couple could potentially access twice as much subsidy as a lone parent, even if the lone parent had more children.
However, the roll-out of tax-free childcare has been difficult. It was intended to take effect from October 2015, with the government anticipating that 90% of the roughly 1.3 million eligible families would be using the scheme by 2015–16 (Seely, 2021). In practice, legal challenges delayed the programme’s launch until April 2017.
Even once tax-free childcare was fully rolled out, take-up of (and spending on) tax-free childcare has persistently come in well below the government’s expectations. The government estimated in 2017 that 1.5 million families UK-wide would be eligible for the scheme and incurring qualifying childcare costs (HM Revenue and Customs, 2017). The same impact assessment anticipated that spending in 2019–20 would reach £865 million; in practice, as Figure 3.3 shows, spending in that year was £236 million. Taken together, in the four years after introducing tax-free childcare, the government spent £2.3 billion less on the scheme than it had planned.
Figure 3.3. Anticipated and actual spending on tax-free childcare (cash terms)
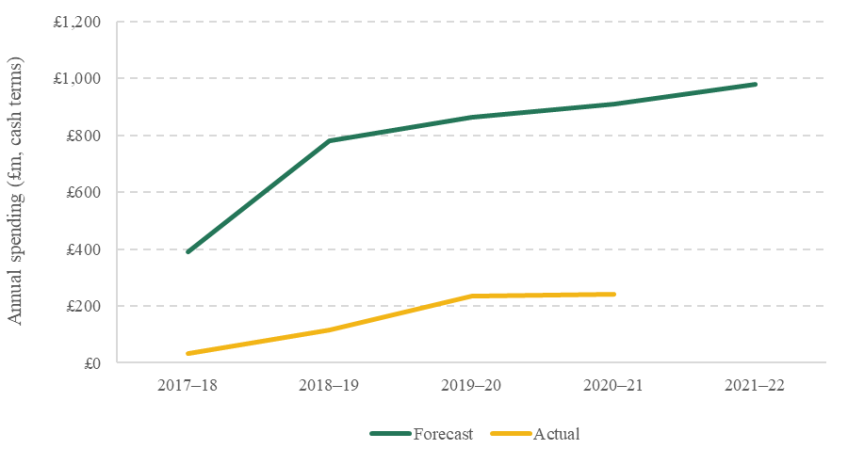
Source: Forecast spending – HM Revenue and Customs, 2017. Actual spending – table 1 of ‘Tax-free childcare statistics, December 2021’.
Figure 3.4. Tax-free childcare status of families predicted to be eligible (2019)
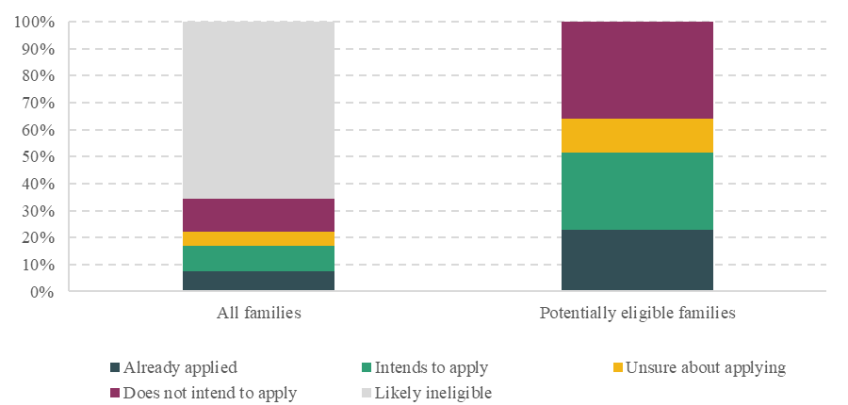
Note: Eligibility is based on families’ work patterns and their receipt of employer childcare vouchers or tax credits (as described in Box 3.1). Data limitations mean that this measure of predicted eligibility may not perfectly capture actual eligibility.
Source: Authors’ calculations using data from the Childcare and Early Years Survey of Parents, 2019.
Figure 3.5. Main reasons for not taking up tax-free childcare (among families predicted to be eligible but not intending to apply)
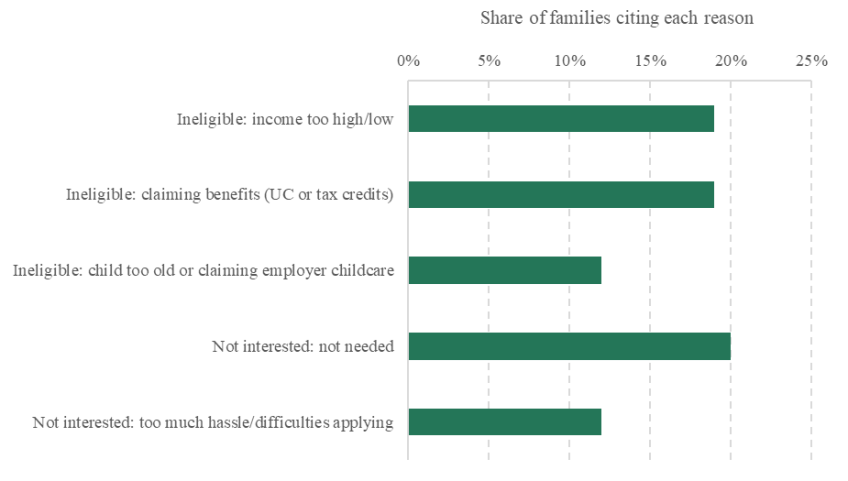
Note: Figure shows the share of families that reported each category as a reason for not intending to apply for tax-free childcare. Multiple responses were accepted.
Source: Authors’ calculations using data from the Childcare and Early Years Survey of Parents, 2019.
Subsequent analysis by the Treasury Select Committee identified a range of reasons for low take-up, including poor awareness, technical difficulties, complicated eligibility criteria and confusing guidance to help families navigate the system (House of Commons Treasury Committee, 2018). In Figure 3.4, we show that only 23% of eligible families reported having applied for tax-free childcare in 2019; 36% of potentially eligible families did not intend to apply, and another 12% were unsure about applying.
In Figure 3.5, we show what potentially eligible parents of children aged 0–4 who did not plan to apply for tax-free childcare cited as the main barriers. The most common responses related to beliefs about ineligibility; overall, 50% of these families cited one or more reason related to their perceived (in)eligibility. While some of this likely reflects limitations in our predicted measure of eligibility, in many cases these responses likely point to confusion around the rules. For example, all parents in our sample have a child aged 0–4 – so all of them have a child who is not too old to benefit.
Another set of challenges reflected families’ lack of interest in the programme. Around a fifth of these families responded that tax-free childcare was not needed in their circumstances. Just over 10% reported that they were put off by the amount of hassle involved in the application process.
3.4 Credit constraints in childcare benefits
For low-income families, the most important source of childcare support is the benefits system. Working families receiving tax credits or universal credit can have the majority of their childcare expenses covered through additional childcare support. Families on universal credit can have 85% of their childcare spending covered; for those on legacy benefits, the subsidy rate is 70%.
This support is subject to caps; in the case of universal credit, families with one child can receive the subsidy on up to £175 per week of childcare expenses (£300 per week for families with two or more children). As Figure 2.5 shows, it is fairly rare for families on low incomes to breach this cap.
But there are administrative constraints that may be particularly difficult for low-income benefit recipients to overcome. Like with tax-free childcare, families claiming support through universal credit must pay for their childcare up front and then claim the subsidy in arrears. For parents on low incomes trying to move into work, finding money to pay for five weeks of childcare fees (as well as any childcare deposit) at the same time as they start their job could be very challenging. Indeed, this model of payment in arrears was initially found to be discriminatory and irrational by the High Court, before being upheld in the Court of Appeal.
4. Conclusion
There is no single story about ‘the’ cost of childcare in England. For many families, formal childcare represents a fairly small line on their household budget. They may use few hours of formal childcare, or not use it at all; they may make use of their free entitlement hours but not pay for any care out-of-pocket; or they might have support through other programmes, such as employer-subsidised childcare.
But for some families, the cost of childcare is an enormous burden. Families with very young children, who use full-time formal childcare, who live in expensive parts of the country or who have multiple children could easily have childcare costs as one of their biggest outgoings.
The challenge for policymakers concerned about the cost of childcare is to distinguish between these groups and target policy appropriately. In general, the free entitlement for 3- and 4-year-olds has reduced childcare costs significantly for these slightly older children. Take-up of the entitlements is very high, particularly for the universal 15-hour offer, and there is evidence that the policy has brought more children into the formal childcare sector.
By contrast, there is much less support for families with 1- and 2-year-olds. For the most part, these parents are reliant on either tax-free childcare or support through the benefits system to help with their childcare costs. But only 40% of parents of pre-school children had even heard of tax-free childcare in 2019, and a significant minority said they were put off applying by the perceived hassle. Within the benefits system, the current approach of requiring families to pay for childcare costs up front before reimbursement has been criticised by a parliamentary committee and was the subject of a legal challenge. Since 1- and 2-year-olds using formal childcare also face far higher out-of-pocket costs than older children, any policy programme to help families with the cost of childcare should start by trying to understand what is going wrong with existing programmes of support.
And, of course, the cost of childcare is not the only consideration. Policymakers will need to balance the desire to reduce costs for (some) families against the twin goals of early education and care programmes: helping parents to work and supporting children’s development. A focus on driving down costs at the expense of the flexibility or quality of care could mean longer-term consequences for parents and their children.
References
Britton, J., Farquharson, C., Sibieta, L., Tahir, I. and Waltmann, B., 2020. 2020 annual report on education spending in England. Institute for Fiscal Studies (IFS), Report 183, https://ifs.org.uk/publications/15150.
Department for Education, 2019. Childcare and Early Years Providers Survey: 2019. https://www.gov.uk/government/statistics/childcare-and-early-years-providers-survey-2019.
European Commission / EACEA / Eurydice, 2019. Key data on early childhood education and care in Europe – 2019 edition. Eurydice Report. Luxembourg: Publications Office of the European Union, https://op.europa.eu/en/publication-detail/-/publication/5816a817-b72a-11e9-9d01-01aa75ed71a1/language-en/format-PDF/source-102611557.
Farquharson, C., Sibieta, L., Tahir, I. and Waltmann, B., 2021. 2021 annual report on education spending in England. Institute for Fiscal Studies (IFS), Report 204, https://ifs.org.uk/publications/15858.
Havnes, T. and Mogstad, M., 2011. No child left behind: subsidized child care and children’s long-run outcomes. American Economic Journal: Economic Policy, 3(2), 97–129, https://www.aeaweb.org/articles?id=10.1257/pol.3.2.97.
HM Revenue and Customs, 2017. Impact assessment for Childcare Payments Act 2014. IA 01/2017, https://assets.publishing.service.gov.uk/government/uploads/system/uploads/attachment_data/file/652939/Tax-free_childcare_Impact_Assessment-March_2017.pdf.
House of Commons Treasury Committee, 2018. Childcare: ninth report of Session 2017–19. HC 757, https://publications.parliament.uk/pa/cm201719/cmselect/cmtreasy/757/757.pdf.
OECD, 2020. The OECD tax-benefit model for the United Kingdom: description of policy rules for 2020. https://www.oecd.org/els/soc/TaxBEN-United_Kingdom-2020.pdf.
Seely, A., 2021. Tax relief for childcare. Research Briefing SN00019, House of Commons Library, https://researchbriefings.parliament.uk/ResearchBriefing/Summary/SN00019.
Acknowledgements
This analysis forms part of IFS’s programme of research on education spending in England, funded by the Nuffield Foundation (grant number EDO/FR-000022637). The Nuffield Foundation is an independent charitable trust with a mission to advance social well-being. It funds research that informs social policy, primarily in Education, Welfare and Justice. It also funds student programmes that provide opportunities for young people to develop skills in quantitative and scientific methods. The Nuffield Foundation is the founder and co-funder of the Nuffield Council on Bioethics, the Ada Lovelace Institute and the Nuffield Family Justice Observatory. The Foundation has funded this project, but the views expressed are those of the authors and not necessarily of the Foundation. Visit www.nuffieldfoundation.org. The authors also gratefully acknowledge the support of the ESRC Centre for the Microeconomic Analysis of Public Policy (ES/T014334/1).
Endnotes
Authors

Christine Farquharson
Christine's research examines inequalities in children's education and health, especially in the early education and childcare sector.

More from IFS
Understand this issue


Policy analysis


Academic research


