Downloads
BN199.pdf
PDF | 480.23 KB
This briefing note provides background material for the 2017 General Election.
IFS Election 2017 analysis is being produced with funding from the Nuffield Foundation as part of its work to ensure public debate in the run-up to the general election is informed by independent and rigorous evidence. For more information, go to http://www.nuffieldfoundation.org.
Key findings
- The financial crisis led to a sharp reduction in national income. Even more striking is the weakness of the subsequent recovery. Official forecasts suggest that GDP per adult in 2022 will be 18% lower than it would have been had it grown by 2% a year since 2008 – broadly the expected rate of growth at that time. This downgrade in expected income has adversely affected the finances of households and of the government.
- The deficit has fallen considerably since its peak in 2009–10. It is now back to the level it was at prior to the crisis, although this is still above the UK’s pre-crisis average. Current forecasts imply the deficit falling in line with what was implied by Labour’s 2015 election manifesto. Eliminating the deficit before a May 2022 general election would require a combination of further net tax rises and spending cuts worth £15 billion on top of what is already planned.
- Both tax revenues and spending are slightly above their pre-crisis shares of national income. Revenues are forecast to continue growing to their highest level since 1986–87. Non-investment spending is forecast to continue being cut as a share of national income, while investment spending – which was cut during the first half of the 2010s – is forecast to increase.
- The UK’s public finances compare unfavourably with those of other advanced economies, although this is also the case for other very large economies such as France, Japan and the United States. In 2016, the UK had the fifth-largest deficit out of 35 advanced economies and the sixth-largest debt out of 26 advanced economies
- The increase in revenues as a share of national income since 2009–10 has been driven by tax rises announced since May 2010. Fiscal events in the 2010–15 parliament contained measures that had the net effect of boosting revenues in 2017–18 by an estimated £10 billion. This figure arises from £60 billion of tax rises being offset by £50 billion of tax cuts. The net effect of measures announced since May 2015 has also been to increase tax. They are estimated to raise £15 billion (in today’s terms) in 2021–22. This figure arises from tax-raising measures worth £35 billion being offset by tax cuts worth £20 billion
- On the spending side, the striking fact is that after seven years of austerity, public spending is only broadly back at pre-crisis levels as a fraction of national income. Cuts to large parts of government spending have only resulted in the size of the state being broadly unchanged for three reasons. First, the financial crisis pushed spending as a share of national income up sharply, and this increase has been undone. Second, continued weak economic growth in recent years has meant that a given real-terms cut to spending has delivered a smaller reduction in spending as a share of national income relative to both history and expectation. Third, some elements of spending have risen as a fraction of national income – most notably, spending on health, pensions and overseas aid – and so cuts have been required elsewhere.
A very weak recovery in GDP per adult, which is forecast to continue
Figure 1. GDP per adult since 2008Q1
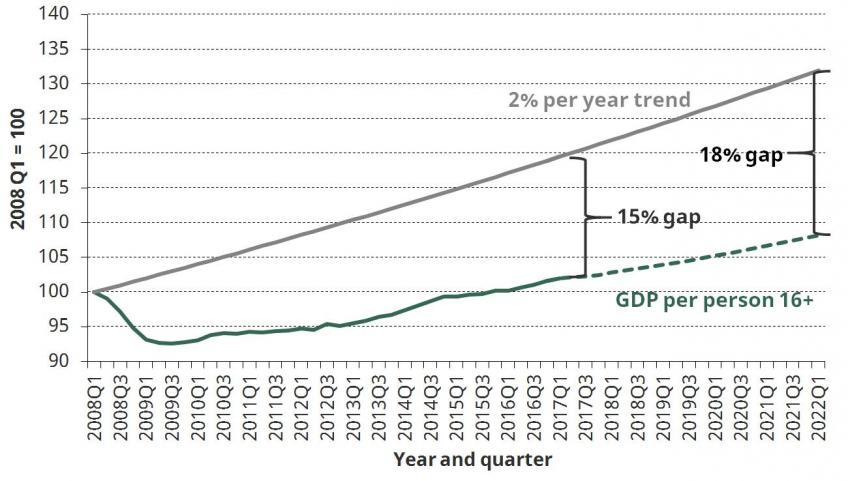
The financial crisis led to a sharp reduction in national income. But even more striking is the weakness of the subsequent recovery. National income per adult only returned to its pre-crisis level around the end of 2015, as shown in Figure 1. This is a huge reduction in the size of the economy – and therefore the average living standards of UK households – relative to what we would reasonably have expected prior to the financial crisis. National income per adult is currently around 15% lower than what it would have been had output per adult instead grown by 2% a year.
The latest official forecasts – from the Spring 2017 Budget – are for this period of weak growth to continue. If correct, then by the start of 2022 the gap between actual national income per adult, and where it would have been had it grown by 2% a year throughout the period, will have risen to 18%.
This downgrade in expected income has adversely affected the finances of households and of the government.
Deficit has fallen from its 2009–10 peak; further reductions – on top of those forecast – required if a rarely achieved surplus is to be realised
Figure 2. Deficit as a share of national income since 1948
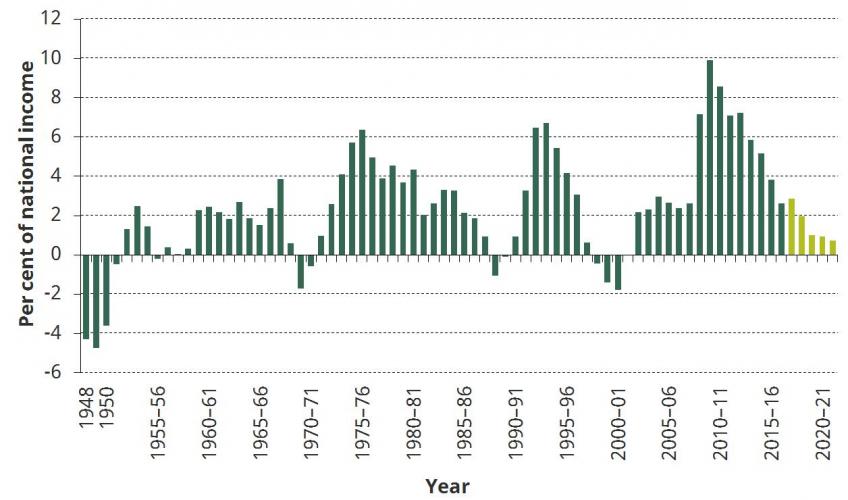
Government borrowing – that is, the difference between what the government spends and what it collects in receipts – is shown for each year since 1948 in Figure 2. The deficit peaked at almost 10% of national income in 2009–10 and fell to 2.6% of national income in 2016–17. This is the same level as it was in the last financial year prior to the crisis (2007–08) but is above the long-run UK average prior to that (1.8% of national income).
Last autumn, in his first fiscal statement, the new Chancellor Phillip Hammond chose to abandon the existing fiscal rules (which had only been put in place a year before) and instead committed the government to eliminating the deficit by the end of the next parliament. The UK has had short periods in which a budget surplus has been delivered, but these have been rare and short-lived, with the last ones occurring during the three financial years from 1998–99 to 2000–01 (inclusive).
The latest forecasts suggest the deficit will fall over the next five years. But even had the next parliament run from May 2020 to May 2025, eliminating the deficit would have been far from straightforward, with the forecasts implying a deficit in 2021–22 of 0.7% of national income, which is equivalent to £15 billion in current terms. Eliminating the deficit before a May 2022 general election would be even harder, requiring a combination of tax rises and spending cuts worth £15 billion on top of current plans.
Latest official forecast for borrowing in line with that implied by Labour’s 2015 general election manifesto
Figure 3. Deficit as a share of national income since 2009–10 peak
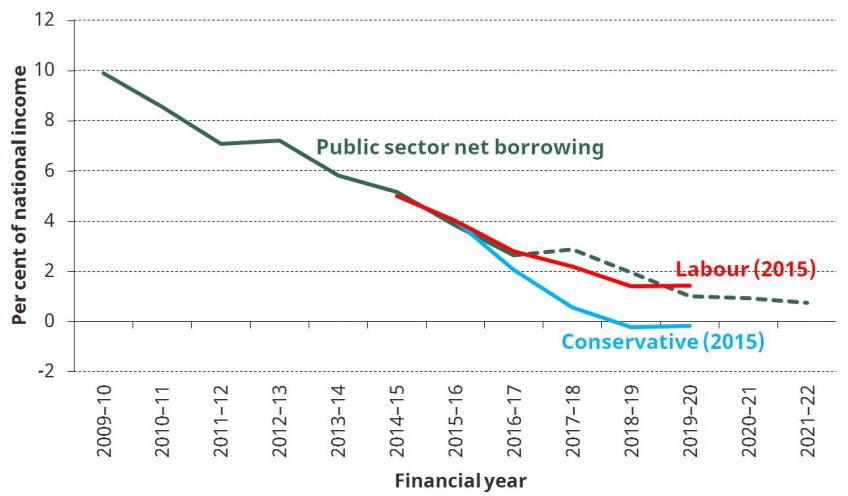
At the last general election, IFS researchers assessed the implications for the public finances of the plans set out in the main parties’ general election manifestos. The comparison between what the Conservatives and the Labour Party’s 2015 general election plans implied for government borrowing, alongside the latest official forecasts, is shown in Figure 3. At the time of the last general election, the Conservatives stated that they would eliminate the budget deficit by 2018–19, while our assessment was that under Labour’s plans borrowing would be on course to be 1.4% of national income in that year.
The latest official forecasts suggest that borrowing is on course to be roughly in line with our assessment of what it would have been under Labour’s plans, and significantly above that implied by the commitments made in the Conservative Party manifesto. There are two reasons for this increased level of borrowing relative to that implied by the 2015 Conservative manifesto. First, subsequent spending cuts have been lower than stated in the manifesto. The Conservative manifesto pledged to cut public spending in real terms by 1% a year in both 2016–17 and 2017–18, which would have implied spending being £15 billion lower in 2017–18 than in 2015–16. The latest forecast is for spending to grow by 1.3% a year over these two years, leaving it £21 billion higher in 2017–18 than it was in 2015–16. Second, there has been a significant downgrade in the outlook for the UK economy between the March 2016 Budget and the November 2016 Autumn Statement, in part due to the UK’s June 2016 vote to leave the European Union.
Deficit has been reduced by an increase in tax as a share of national income and, to a greater extent, a cut to public spending
Figure 4. Tax and spend as a share of national income since the turn of the century
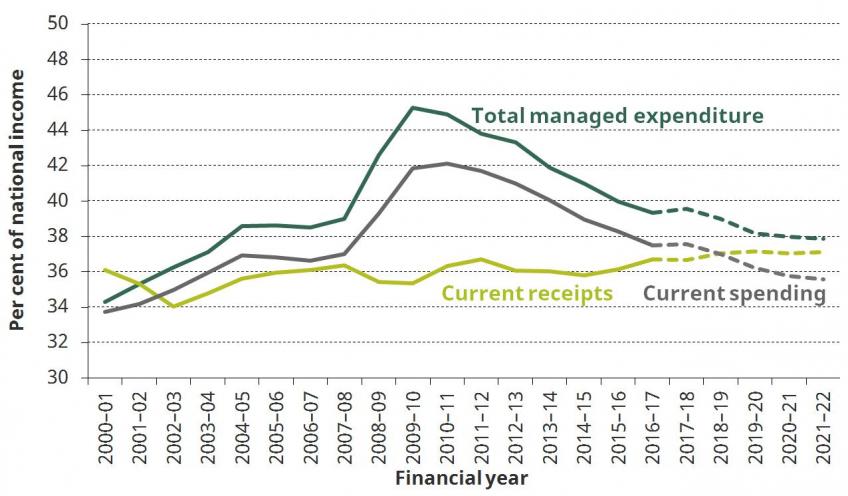
The enormous deficit caused by the financial crisis was due to tax receipts falling and – to a much greater extent – spending increasing, as a share of national income. The subsequent reduction in the deficit has come from increases in tax and a more significant reduction in spending. While in 2016–17 the deficit was at a similar level to that recorded prior to the crisis in 2007–08, both spending and receipts are slightly above their levels of a decade ago.
The latest forecasts imply revenues continuing to rise as a share of national income so that they reach their highest level since 1986–87. Current spending – that is, public spending excluding investment spending – is forecast to continue to be reduced as a share of national income. If correct, this implies revenues slightly exceeding current spending in 2018–19 (implying a current budget surplus), which would be the first time this had been achieved since 2001–02.
Investment spending (which represents the difference between total spending and current spending in Figure 4) is forecast to increase as a share of national income over the next five years, having been cut significantly during the first half of the 2010s.
Debt is forecast to remain above twice pre-crisis levels throughout the next parliament
Figure 5. Debt as a share of national income since the turn of the century
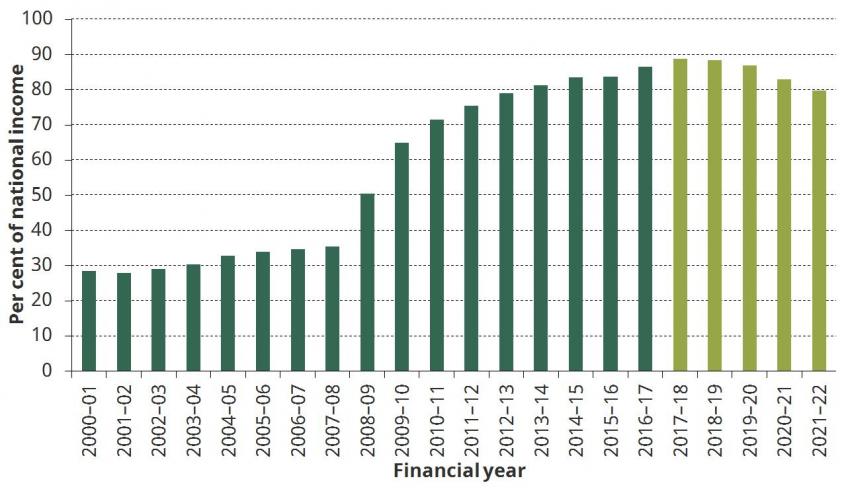
The large deficits recorded over the last few financial years have added considerably to the stock of public sector debt. Prior to the crisis, this was running at below 40% of national income. But, as shown in Figure 5, it has since doubled and is forecast to peak in the current financial year at 88.8% of national income before falling back to 79.7% of national income in 2021–22. By recent UK historical standards, this is a high level of debt – the last time it was above 85% of national income was in 1965–66. But going further back, the UK had extended periods with debt at even more elevated levels.
The UK has the fifth-largest budget deficit out of 35 advanced economies
Figure 6. General government borrowing, 2016
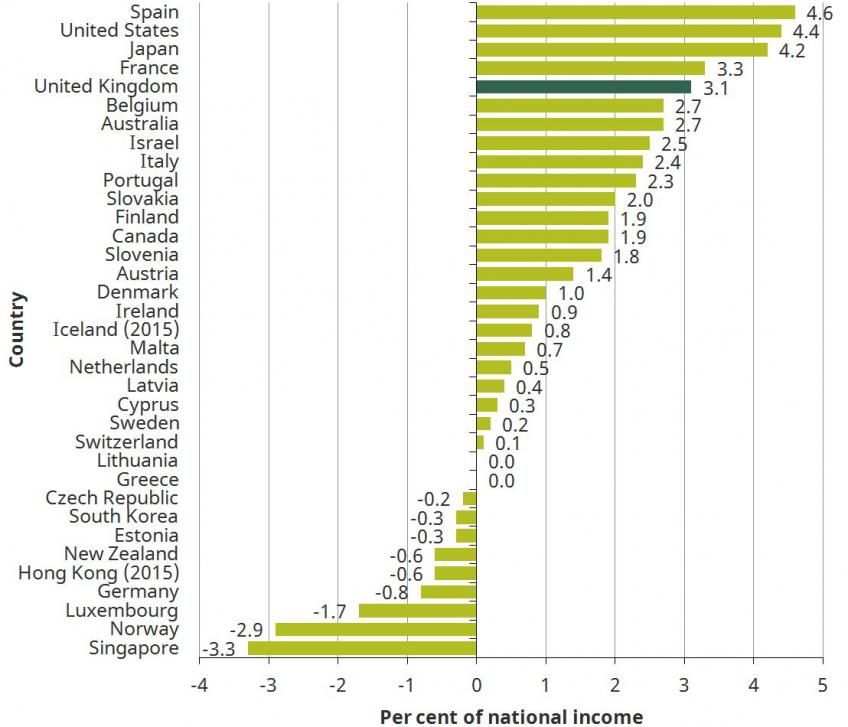
The International Monetary Fund (IMF) provides cross-country data on the public finances. Figure 6 presents the data on government borrowing for 35 advanced economies. It should be noted that these data are constructed, as far as possible, on a comparable basis and therefore do not match exactly the measures of borrowing that are typically used in the UK. They suggest that in 2016 the UK had the fifth-largest government borrowing out of these 35 countries. However it should also be noted that it is not uncommon for large economies to run larger deficits – the United States, Japan and France all had deficits larger than the UK. The notable exception from this pattern is Germany, which had a much lower level of borrowing (in fact, a surplus of 0.8% of national income).
The UK’s relatively large deficit in 2016 is despite a relatively large reduction over recent years. At its peak, the UK’s cyclically-adjusted deficit – that is, the deficit that is not thought to be explained by the ups-and-downs of the economic cycle – was larger than all but six other advanced economies. Since then, the UK has delivered the sixth-largest reduction in the cyclically-adjusted deficit (which is one measure of austerity). The IMF forecasts that only three other economies (Australia, Italy and France) will deliver a larger reduction in the cyclically-adjusted deficit over the six years from 2016 to 2022.
The UK has the sixth-largest government debt out of 26 advanced economies
Figure 7. General government net debt, 2016
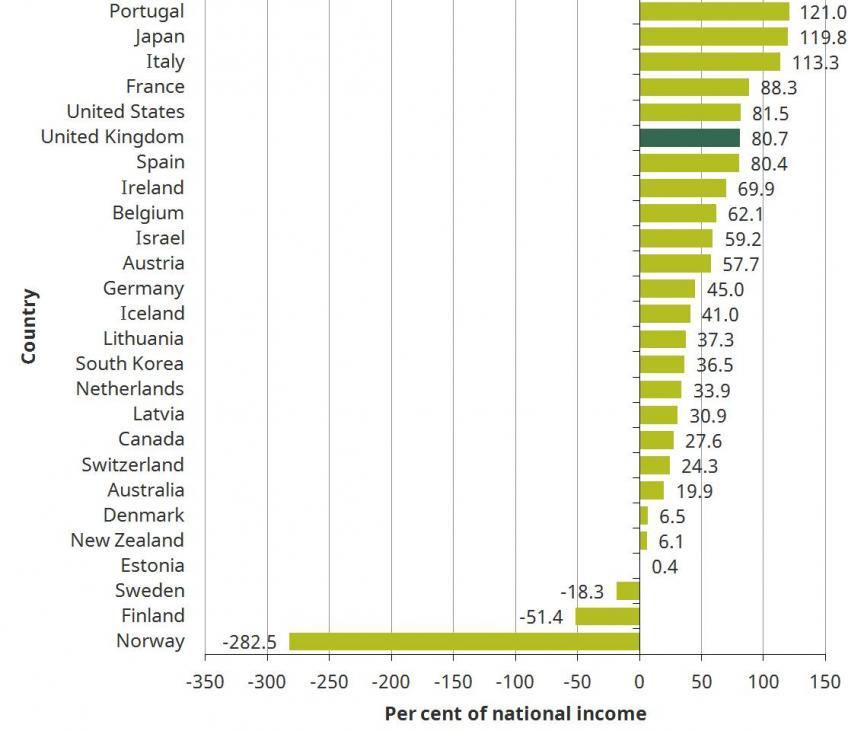
Compared with the other advanced economies, the UK also has a relatively high level of government debt. Of the 26 economies for which IMF data are available, only five had a higher level of debt in 2016, as shown in Figure 7. Similar to the picture for the deficit, there is a tendency for larger economies to have a weaker fiscal position: Japan, Italy, France and the United States all have a larger debt ratio than the UK. Again the outlier from this pattern is Germany, which has a significantly lower level of debt.
Increase in tax burden since 2009 driven by the net effect of a significant package of discretionary policy measures
Table 1. Change in tax revenues since 2009–10
2015–16 | 2017–18 | 2021–22 | |
% of GDP | |||
Increase in revenues | –0.2 | +0.3 | +0.8 |
Of which: | |||
Underlying increase in revenues | –0.5 | –0.4 | –0.4 |
Discretionary measures announced since May 2010 | +0.3 | +0.7 | +1.2 |
£ billion (2017–18 terms) | |||
Increase in revenues | –3.8 | +6.8 | +16.0 |
Of which: | |||
Underlying increase in revenues | –10.7 | –7.7 | –7.8 |
Discretionary measures announced since May 2010 | +7.0 | +14.5 | +23.8 |
Of which: | |||
Tax rises from 2010–15 parliament | +53.8 | +60.2 | +60.2 |
Tax cuts from 2010–15 parliament | –48.3 | –50.0 | –51.3 |
Total net tax rise from 2010–15 parliament | +5.6 | +10.3 | +8.9 |
Tax rises from 2015–17 parliament | +1.5 | +25.1 | +34.7 |
Tax cuts from 2015–17 parliament | –0.1 | –20.9 | –19.9 |
Total net tax rise from 2015–17 parliament | +1.4 | +4.3 | +14.9 |
As shown in Figure 4, tax revenues as a share of national income are increasing. In principle, this can arise because of growth in the economy, and therefore underlying tax bases, pushing up revenues or because of discretionary changes to the tax system that boost revenues. Table 1 decomposes the change in revenues as a share of national income since 2009–10 into that which is estimated to arise from budget announcements made since May 2010 and the remainder.
In the current financial year, revenues are 0.3% of national income higher than they were in 2009–10. This is equivalent to £6.8 billion in today’s terms. Of this, £14.5 billion is the estimated net impact of policy measures announced since the May 2010 general election, implying that absent these changes revenues would have fallen as a share of national income by the equivalent of £7.7 billion in today’s terms.
This net increase in tax from discretionary measures can be further decomposed into those announced in fiscal events in the last parliament under the coalition government and those announced under the Conservative government since May 2015. The estimated impact of measures from the 2010–15 parliament has been to boost revenues in 2017–18 by £10.3 billion. This is the net effect of a very large set of tax cuts (totalling £50.0 billion) and an even larger set of tax rises (totalling £60.2 billion). The largest tax rises announced in that parliament were the increase in the main rate of VAT, the introduction of the bank levy and the abolition of contracting out into defined benefit pension arrangements. The most significant tax cuts were increases in the income tax personal allowance, cuts to the main rate of corporation tax and cuts to the rates of fuel duties.
Measures announced since May 2015 are estimated to have had the net effect of boosting revenues by a further £4.3 billion, with £25.1 billion of tax rises being offset by £20.9 billion of tax cuts. The long-run impact of measures announced in the 2015–17 parliament is estimated to be larger. By 2021–22, these measures are estimated to have the net impact of raising revenues by £14.9 billion (again in today’s terms), with this arising from £19.9 billion of tax cuts being more than offset by tax rises of £34.7 billion. The largest tax-raising measures announced in this parliament are the increase in the rate of tax on dividend income, the new apprenticeship levy and the increases in council tax (intended to boost social care funding). The largest tax cuts announced in this parliament are a further reduction to the rate of corporation tax and increases in the income tax personal allowance and higher-rate threshold.
Overall departmental spending no longer being cut in total, though per-capita spending forecast to continue falling
Figure 8. Departmental expenditure limits since 2007–08
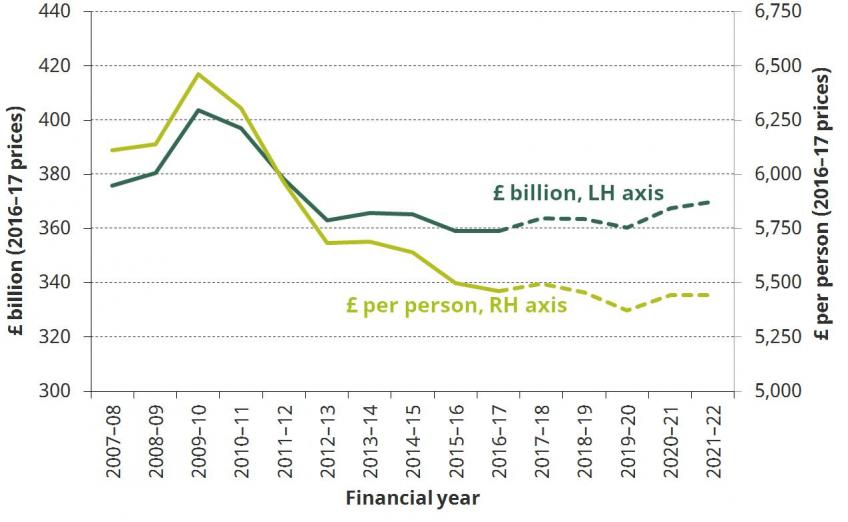
Part of the cut to public spending as a share of national income seen since 2009–10 has been brought by about by real-terms cuts to central government spending on the delivery and administration of public services. Between 2009–10 and 2012–13, this was cut by £41 billion, or 10.1%. Since then, as shown in Figure 8, overall departmental spending has been more stable with a further £4 billion being cut between 2012–13 and 2016–17. The latest forecasts are for overall departmental spending to be broadly flat between 2016–17 and 2019–20, before increasing in 2020–21 and 2021–22.
But since the UK population is forecast to grow, these spending plans still imply departmental spending per person continuing to fall in real terms. In 2009–10, departmental spending was equivalent to £6,460 per person. This had fallen to £5,460 per person in 2016–17 and is forecast to fall to £5,370 per person in 2019–20.
Cuts to departmental budgets since 2010 not shared evenly and some departments face further cuts
Figure 9. Planned real change to departmental expenditure limits, by department
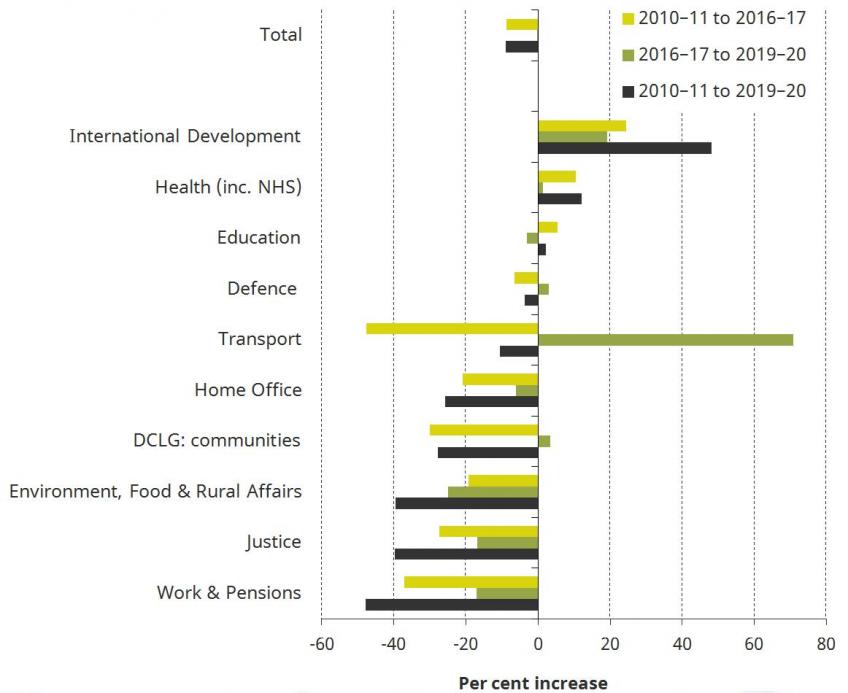
The cuts to departmental spending seen since 2009–10 have been far from equally shared across departments and, for some, further cuts are planned. Figure 9 shows the overall real increase in spending planned for the period from 2010–11 through to 2019–20 for a selection of departments, with the cuts that have already been delivered – and those planned for the next three years – being shown separately.
The Department for International Development, the Department of Health and the Ministry of Defence are all set to see their budgets rise in real terms over the period 2016–17 to 2019–20. In addition, while the Department for Transport is having its day-to-day budget cut, it has been allocated a significant increase in its capital budget, such that its overall budget is forecast to increase significantly over the next three years. In contrast, several other departments have spending allocations that imply deep cuts – for example, the Ministry of Justice and the Department for Environment, Food and Rural Affairs both have further deep cuts planned on top of those that they have already delivered since 2010–11.
Spending on working-age benefits forecast to fall to below pre-crisis levels as a fraction of national income
Figure 10. Outlook for spending on benefits and tax credits
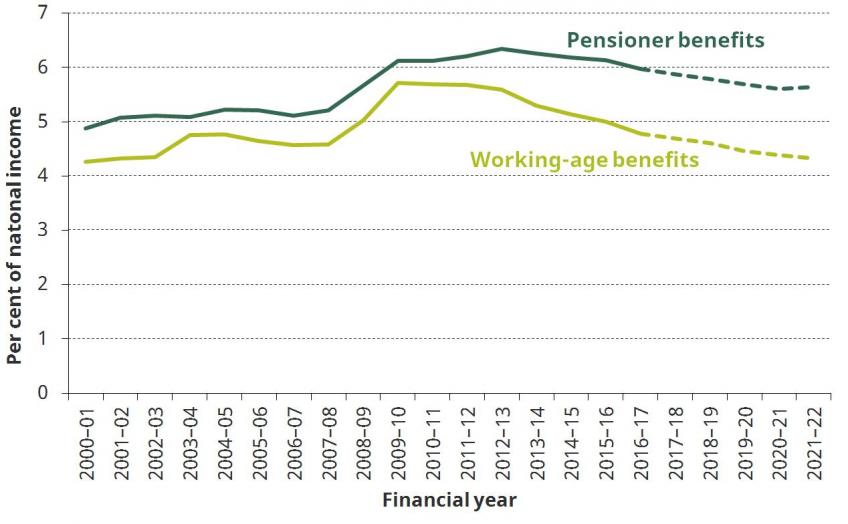
Cuts to working-age benefits have also contributed to the fall in public spending as a share of national income since 2009–10. Figure 10 shows spending on both pensioner benefits and working-age benefits since 2000–01, as a share of national income, with the latest forecasts running through to 2021–22. Spending on pensioner benefits has fallen slightly as a share of national income since 2012–13. While existing pensioners have benefited from the ‘triple lock’ on the state pension and have largely been protected from other benefit cuts, the rise in the female state pension age since April 2010 has helped to reduce spending. Further increases in the state pension age up to age 66 for both men and women by October 2020 will help restrain spending on pensioner benefits for the next three years.
Spending on working-age benefits has fallen more sharply since 2012–13, in part due to falling unemployment, but also due to measures that have made the benefits system less generous than it would have been for many working-age families. The latest forecasts imply that by 2021–22 spending on these benefits will have fallen to its lowest level as a share of national income since 2000–01.
Reduction in spending since 2009–10 is unevenly spread, with increased spending on pensioner benefits, health and overseas aid
Figure 11. Public spending as a share of national income, 2007–08 and 2016–17 compared
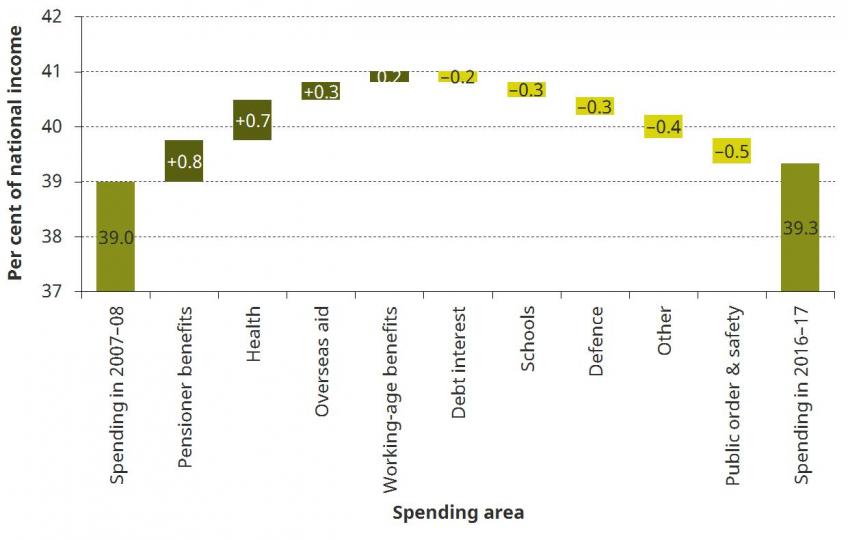
One result of choices over spending priorities made over the last decade has been to alter not just the level but also the make-up of public spending. Figure 4 showed that in the financial year before the financial crisis struck, 2007–08, total public spending was equal to 39.0% of national income. In the last financial year, this stood at 39.3% of national income. A decomposition of the change in public spending as a share of national income between these two years is shown in Figure 11. This shows that the overall increase in spending was not split evenly: spending has risen as a share of national income in some areas, such as pensioner benefits, health and overseas aid, and fallen in others, such as schools, defence and public order & safety.
By the last year covered by the current spending period (2019–20), spending is forecast to be 38.2% of national income, which is 0.8% of national income (equivalent to £16 billion in today’s terms) below its level in 2007–08 and 1.1% of national income (equivalent to £23 billion in today’s terms) below its level in 2016–17. The forecast reduction in spending as a share of national income between 2016–17 and 2019–20 is across a range of areas, including both health and pensioner benefits and also other areas where spending has been cut in recent years.
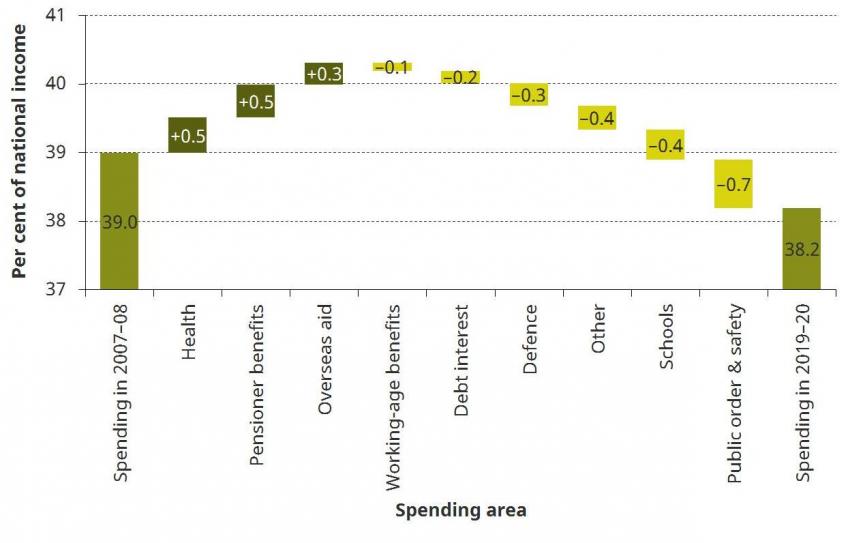
The resulting overall change in spending between 2007–08 and 2019–20 is presented in Figure 12. This shows that spending on health, pensioner benefits and overseas aid will all have increased as a share of national income since 2007–08 (by a total of 1.3% of national income). Despite the large increase in public sector net debt (shown in Figure 5), the fall in government borrowing costs will mean that debt interest payments are forecast to be a smaller share of national income in 2019–20 than in 2007–08. Spending on defence (notwithstanding the protection from cuts in the 2015–17 parliament), schools and (in particular) public order & safety, alongside other elements of government spending that don’t fall within these categories, are also forecast to be lower as a fraction of national income in 2019–20 than they were in 2007–08. The sizeable cut to spending on public order & safety is in large part due to the fact that a large portion of this spending is from the Home Office and the Ministry of Justice (three-quarters of the total in 2015–16, with the remainder coming from DCLG and the devolved administrations) and the budgets of those two departments are planned to be cut by one-third in real terms over the period from 2010–11 to 2019–20 (see Figure 9).
Figure 12. Public spending as a share of national income, 2007–08 and 2019–20 compared
Notes and sources
Figure 1
Source: Office for Budget Responsibility, Economic and Fiscal Outlook Supplementary Economy Tables, 8 March 2017 (http://budgetresponsibility.org.uk/efo/economic-fiscal-outlook-march-2017/).
Figure 2
Note: Official forecasts adjusted for the subsequent announcement that the planned increase in Class 4 National Insurance contributions would not go ahead.
Source: Office for Budget Responsibility, ‘Public finances databank’, 31 March 2017 (http://budgetresponsibility.org.uk/data/); Office for Budget Responsibility, ‘Policy measures database’, 8 March 2017 (http://budgetresponsibility.org.uk/data/); author’s calculations.
Figure 3
Note: Official forecasts adjusted for the subsequent announcement that the planned increase in Class 4 National Insurance contributions would not go ahead.
Source: Office for Budget Responsibility, ‘Public finances databank’, 31 March 2017 (http://budgetresponsibility.org.uk/data/); Office for Budget Responsibility, ‘Policy measures database’, 8 March 2017 (http://budgetresponsibility.org.uk/data/); R. Crawford, C. Emmerson, S. Keynes and G. Tetlow, ‘Post-election austerity: parties’ plans compared’, IFS Election Briefing Note 11, 23 April 2015 (http://election2015.ifs.org.uk/article/post-election-austerity-parties-plans-compared); author’s calculations.
Figure 4
Note: Official forecasts adjusted for the subsequent announcement that the planned increase in Class 4 National Insurance contributions would not go ahead.
Source: Office for Budget Responsibility, ‘Public finances databank’, 31 March 2017 (http://budgetresponsibility.org.uk/data/); Office for Budget Responsibility, ‘Policy measures database’, 8 March 2017 (http://budgetresponsibility.org.uk/data/); author’s calculations.
Figure 5
Note: Official forecasts adjusted for the subsequent announcement that the planned increase in Class 4 National Insurance contributions would not go ahead.
Source: Office for Budget Responsibility, ‘Public finances databank’, 31 March 2017 (http://budgetresponsibility.org.uk/data/); Office for Budget Responsibility, ‘Policy measures database’, 8 March 2017 (http://budgetresponsibility.org.uk/data/); author’s calculations.
Figure 6
Note: For Hong Kong and Iceland, 2015 figures are reported as the 2016 values are atypical and seem very likely to be the impact of one-off factors.
Source: Statistical annex table A1 of International Monetary Fund, IMF Fiscal Monitor: Achieving More with Less, April 2017 (https://www.imf.org/en/Publications/FM/Issues/2017/04/06/fiscal-monitor-april-2017).
Figure 7
Source: Statistical annex table A8 of International Monetary Fund, IMF Fiscal Monitor: Achieving More with Less, April 2017 (https://www.imf.org/en/Publications/FM/Issues/2017/04/06/fiscal-monitor-april-2017).
Table 1
Note: Official forecasts adjusted for the subsequent announcement that the planned increase in Class 4 National Insurance contributions would not go ahead.
Source: Office for Budget Responsibility, ‘Public finances databank’, 31 March 2017 (http://budgetresponsibility.org.uk/data/); Office for Budget Responsibility, ‘Policy measures database’, 8 March 2017 (http://budgetresponsibility.org.uk/data/); author’s calculations.
Figure 8
Source: Author’s calculations using data from table 2.17 of Office for Budget Responsibility, Economic and Fiscal Outlook Supplementary Fiscal Tables: Expenditure, 8 March 2017 (http://budgetresponsibility.org.uk/efo/economic-fiscal-outlook-march-2017/).
Figure 9
Source: Author’s calculations using table 1.10 of HM Treasury, Public Expenditure Statistical Analyses, 2015 and 2016 editions (https://www.gov.uk/government/collections/public-expenditure-statistical-analyses-pesa), tables 1.6 and 1.7 of HM Treasury, Spring Budget 2017 (https://www.gov.uk/government/topical-events/spring-budget-2017) and GDP deflators from Office for Budget Responsibility, ‘Policy measures database’, 8 March 2017 (http://budgetresponsibility.org.uk/data/).
Figure 10
Note: Great Britain only.
Source: Table ‘GB welfare’ of Department for Work and Pensions, ‘Benefit expenditure and caseload tables 2017’, 27 March 2017 (https://www.gov.uk/government/publications/benefit-expenditure-and-caseload-tables-2017).
Figures 11 and 12
Note: Figures decompose the change in total managed expenditure. Working-age and pensioner benefits refer to Great Britain spending only. Overseas aid spending figure for 2007–08 actually refers to 2007, and the figures for 2016–17 and 2019–20 are estimated assuming the UK spends 0.7% of GDP. Figures for defence, schools and public order & safety all refer to spending by function. Estimates for 2016–17 and 2019–20 obtained by assuming: defence – growth in line with the Ministry of Defence budget; schools – real freeze to total spending; public order & safety – growth in line with the aggregate budget of the Home Office and the Ministry of Justice.
Source: Author’s calculations using data from the Office for Budget Responsibility, ‘Public finances databank’, 31 March 2017 (http://budgetresponsibility.org.uk/data/), Department for Work and Pensions, ‘Benefit expenditure and caseload tables 2017’, 27 March 2017 (https://www.gov.uk/government/publications/benefit-expenditure-and-caseload-tables-2017), Department for International Development, ‘Statistics on international development 2016’ (https://www.gov.uk/government/statistics/statistics-on-international-development-2016) and HM Treasury, Public Expenditure Statistical Analyses, various years (https://www.gov.uk/government/collections/public-expenditure-statistical-analyses-pesa).
IFS Election 2017 analysis is being produced with funding from the Nuffield Foundation as part of its work to ensure public debate in the run-up to the general election is informed by independent and rigorous evidence. For more information, go to http://www.nuffieldfoundation.org.
Authors

Carl Emmerson
Carl, a Deputy Director, is an editor of the IFS Green Budget, is expert on the UK pension system and sits on the Social Security Advisory Committee.
More from IFS
Understand this issue


Policy analysis


Academic research


