Today, the government has published the provisional local government finance settlement for 2019–20, which sets out updated funding plans for English councils for this year and next. Funding plans were initially set in 2016, and in keeping with last year’s and this year’s settlements, extra money has been found: around £1.6 billion for 2019–20 compared to the plans originally set out. However, taken together, funding from government grants, business rates and council tax is still set to be 1.4% (£0.6 billion) lower in real-terms than in 2015–16, which is equivalent to 4.2% per person after accounting for forecast population growth.
In this observation we look at how the funding cuts made over the four years between 2015–16 and 2019–20 are set to vary around the country – which reveals that the extra funding found to ameliorate cuts has benefited councils serving richer areas more than councils serving poorer areas.
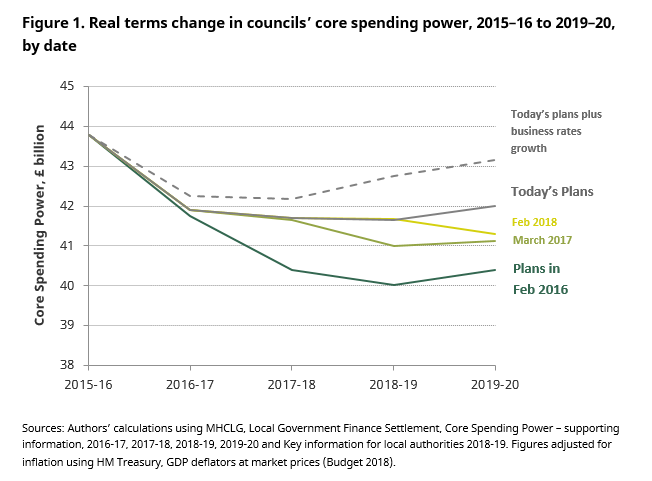
Funding has been found to ease but not undo planned cuts
Councils’ spending on services fell around 18% (or 22% per person) in real-terms between 2009–10 and 2015–16, as the then-coalition government substantially cut grant-funding, and encouraged councils to freeze council tax. The spending cuts during this period were significantly larger in more-deprived than more-affluent areas of the country, reflecting the way the government chose to cut grant-funding.
In December 2015, the new Conservative government set out a four year settlement for councils covering the period 2016–17 to 2019–20. There would be further large cuts in grant-funding but because the grants had been cut so much already, and councils were able to increase their council tax by up to 4% a year, these would translate into significantly smaller cuts in core spending power – the government’s measure of overall funding. Moreover, the way grants were allocated was changed so that they would not lead to such disproportionate impacts on the core spending power of deprived councils.
Figure 1 shows that the initial plans set out at the time of the 2016–17 settlement implied a 7.7% fall in core spending power between 2015–16 and 2019–20, amounting to 10.3% per person.
However, each subsequent year, additional money has been found for councils, reducing the scale of the cuts – in part by allowing bigger council tax increases, and in part by increasing grant funding. For instance, today’s announcements confirm £650 million of grant funding for adult and children’s social care in 2019–20 and cancel plans for ‘negative grants’ for the richest councils that can raise the most themselves via council tax at a cost of around £150 million.
The latest government plans published today imply that core spending power will be 4.0% (6.7% per person) lower in 2019–20 than 2015–16, which is around half of the reduction initially planned.
It is also worth noting that the government’s core spending power figures exclude any real-terms growth in business rates revenues that councils receive from the business rates retention system. Projecting forward business rates revenue figures for 2019–20 implies that councils could retain growth of £1.1 billion in 2019–20. Taking account of this revenue growth implies a cut in spending power of 1.4% (4.2% per person) since 2015–16.
Relatively more funding has been found for richer councils
Figure 2 shows that despite the reforms made by the government at the time of the 2016–17 settlement, it has always been the case that councils serving more deprived areas would continue to face slightly larger cuts, on average, than those serving richer areas. For example, the green bars show that back in 2016, the most deprived fifth of councils were projected to see a cut in core spending power of 8.6% over the four years to 2019–20, compared to 7.2% for the least deprived fifth of councils.
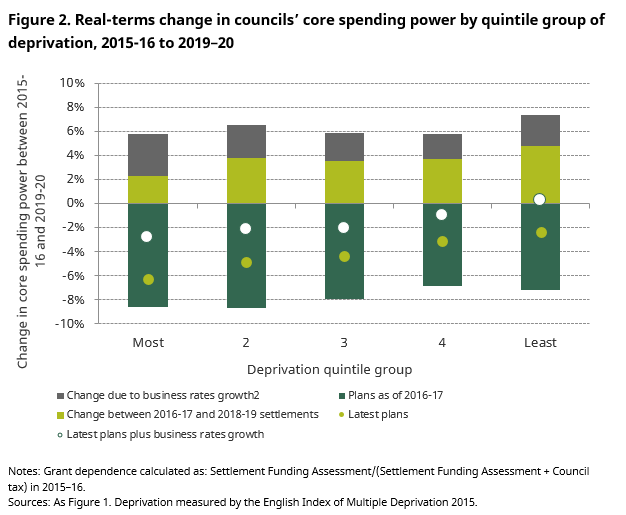
The figure also shows that the extra funding found since plans were initially set out, and growth in retained business rates, has benefited councils across the board.
However, the extra funding has benefited the richer, less grant-dependent councils more, on average, than the poorer councils with high grant-dependency. This is because those relying less on grant and more on their own tax revenues can raise relatively more from the 3% council tax increases in 2018–19 and 2019–20 for services other than adult social care than the 2% originally planned. And it is the same councils that capture almost all the benefit of cancelling plans for negative grants.
Overall, updates to funding plans since 2016 (including today’s) and growth in business rates revenues benefit the least deprived councils by the equivalent of 7.5% of core spending power, compared to just 5.8% for the most deprived. Taking this into account, we estimate that the least deprived councils have seen a small 0.3% real-terms increase in funding since 2015–16, compared to a cut of 2.8% for the most deprived councils (this is shown by the white circles).
Thus it continues to be the case that cuts to council funding have fallen heavier on poorer areas than richer areas of England.
Looking to 2020–21 and beyond, the government plans significant changes to the funding system. The remaining revenue support grant and a number of other grants, such as the public health grant, are due to be abolished, and instead councils will retain 75% of business rates, as opposed to the 50% retained under the standard scheme presently. Our next observation will look at these plans and what they may imply for council funding in the longer term.
Authors

David Phillips
David is Head of Devolved and Local Government Finance. He also works on tax in developing countries as part of our TaxDev centre.

Polly Simpson
Neil Amin Smith
More from IFS
Understand this issue


Policy analysis


Academic research


