All ethnic minority groups in England are now, on average, more likely to go to university than their White British peers. This is the case even amongst groups who were previously under-represented in higher education, such as those of Black Caribbean ethnic origin, a relatively recent change.
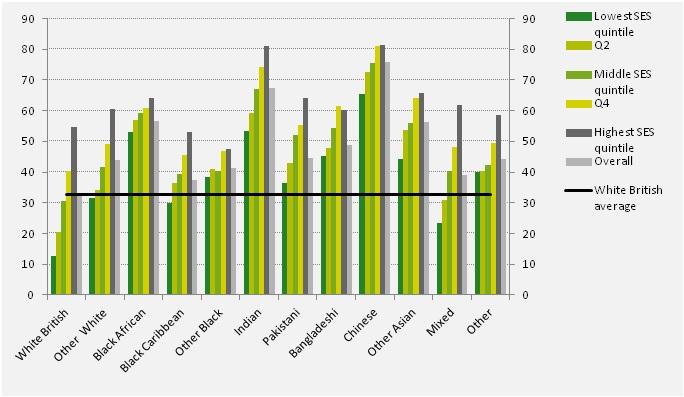
These differences also vary by socio-economic background, and in some cases are very large indeed. For example, Chinese pupils in the lowest socio-economic quintile group are, on average, more than 10 percentage points more likely to go to university than White British pupils in the highest socio-economic quintile group. By contrast, White British pupils in the lowest socio-economic quintile group have participation rates that are more than 10 percentage points lower than those observed for any other ethnic group.
These are amongst the findings of research undertaken by IFS researchers, funded by the Departments of Education and Business, Innovation and Skills (BIS), and published by BIS.
The report updates evidence on differences in higher education participation by socio-economic background, gender and ethnicity. It also explores the extent to which pupils’ performance in national achievement tests taken at age 11, and GCSE and A-level and equivalent exams taken at ages 16 and 18, can help to explain differences in the proportion of students going on to study at university.
The research used census data linking all pupils going to school in England to all students going to university in the UK, containing over half a million pupils per cohort. It focused on those taking their GCSEs in 2007-08, who could have gone to university at age 18 in 2010-11 or age 19 in 2011-12. (It therefore predates the large increase in tuition fees which occurred in 2012.)
Differences in progression to university between individuals from different ethnic groups were particularly striking. We find that school pupils from all ethnic minority backgrounds are now, on average, significantly more likely to go to university than their White British counterparts. That is, the proportion of students from an ethnic minority background getting a place at a UK university is higher than the proportion of White British students getting a place.
This is shown in Figure 1, which plots average university participation rates of pupils from 12 ethnic groups. The light grey bars on the right show the overall participation rates by ethnic group and the black horizontal line plots the White British average. For all groups, overall participation rates exceed the White British average. Some of these differences are very large indeed. For example, Indian and Chinese pupils are, on average, more than twice as likely to go to university as their White British counterparts.
Differences in how well pupils do at school can help to explain some but not all of these gaps. For example, pupils of Black, Pakistani and Bangladeshi ethnic origin tend to perform worse, on average, in national tests and exams taken at school than their White British counterparts. Accounting for the fact that individuals from these ethnic groups have lower prior attainment than their peers therefore increases the unexplained differences in participation between ethnic minorities and White British pupils. In other words, comparing pupils with similar school attainment but from different ethnic backgrounds actually makes it more difficult to explain why ethnic minorities are so much more likely to go to university than their White British peers.
Figure 1: Percentage of pupils taking their GCSEs in 2008 who go on to university at age 18 or 19, by ethnicity and socio-economic quintile group

Notes: figures reproduced in Table at end of observation.
The report also considers participation at 52 of the most selective universities, or “high tariff institutions” as we call them in the report. Most ethnic minority groups are, on average, more likely to attend such institutions than their White British counterparts, but the differences are smaller than for participation among all universities, and could generally be better explained by differences in school attainment.
Even so, we still found, for example, that 34% of Chinese pupils attend one of these selective institutions, higher than the proportion of White British students who go to any university, and more than three times higher than the proportion of White British students going to a selective institution.
These results do not necessarily contradict recent evidence suggesting that ethnic minorities are less likely to receive offers from selective institutions than their equivalently qualified White British counterparts. Our research focuses on those who go to university, while evidence on offer decisions is based on UCAS applications data. If ethnic minorities are even more likely to apply to university than their White British counterparts, then it would be possible for them to be offered proportionately fewer places on average than White British students, but still go on to be relatively more likely to attend.
This research has shown that university participation rates amongst ethnic minority groups are very high on average – much higher than for their White British counterparts. Only a small proportion of this relative over-performance can be explained by differences in how well pupils perform earlier in the school system. This means that there must be other factors that are more common amongst ethnic minority families than amongst White British families which are positively associated with university participation. Moreover, we find that these other factors appear to be more important for ethnic minorities for whom English is an additional language and for those living in London. Future research could usefully explore the source of these differences.
Table 1: figures underlying Figure 1
| Lowest SES quintile group | Q2 | Middle SES quintile group | Q4 | Highest SES quintile group | Overall |
White British | 12.8 | 20.5 | 30.5 | 40.2 | 54.8 | 32.6 |
Other White | 31.5 | 34 | 41.5 | 49.1 | 60.7 | 43.8 |
Black African | 53.1 | 56.9 | 59.1 | 60.9 | 64.1 | 56.6 |
Black Caribbean | 29.9 | 36.5 | 39.4 | 45.6 | 52.9 | 37.4 |
Other Black | 38.3 | 40.9 | 40.3 | 46.8 | 47.4 | 41.2 |
Indian | 53.3 | 59.4 | 67.1 | 74.2 | 81 | 67.4 |
Pakistani | 36.4 | 42.8 | 52.1 | 55.2 | 64.1 | 44.7 |
Bangladeshi | 45.3 | 47.9 | 54.5 | 61.4 | 60.3 | 48.8 |
Chinese | 65.5 | 72.6 | 75.6 | 81.1 | 81.5 | 75.7 |
Other Asian | 44.4 | 53.7 | 56.1 | 64.2 | 65.8 | 56.3 |
Mixed | 23.5 | 31 | 40.4 | 48.2 | 62 | 39.1 |
Other | 40 | 40.5 | 42.4 | 49.4 | 58.7 | 44.2 |


