Last updated: 01 October 2015
The recent financial crisis and associated recession meant that a significant fiscal consolidation was necessary to restore the public finances to a sustainable long-run path. Between 2010–11 and 2014–15, total public spending has been cut by 3.0% in real terms, resulting in a dramatic fall in public spending as a share of national income. Different areas of spending have fared very differently over this period of austerity. Between 2010–11 and 2014–15, departmental spending was cut by 9.1%, compared with a 2.4% increase in non-departmental spending. Within departmental spending, health, schools and official development assistance have been protected, while other areas have been cut dramatically.
The recent financial crisis and associated recession opened up a hole in the public finances. Without any policy action since the 2008 Budget, borrowing would have remained permanently around 10% of national income, which would not have been sustainable.1 A significant fiscal consolidation therefore became necessary to restore the public finances to a sustainable long-run path. Successive governments have increased taxes and cut spending in order to reduce public borrowing, and the vast majority of the consolidation is planned to come from spending cuts.2
Between 2010–11 and 2015–16, total public spending is planned to be cut by 3.0%. However, this overall change in total spending masks the very different experiences of different areas of spending. Figure 1 illustrates how departmental spending (DELs) – which includes the administration and delivery of public services – is planned to be cut by 10.2% over this period, while non-departmental spending (AME) – which includes spending on social security and debt interest payments – is forecast to increase by 3.2%.
Figure 1. Total managed expenditure (TME), split by departmental expenditure limits (DELs) and annually managed expenditure (AME), 1998–99 to 2020-21 (£ billion, 2015–16 prices)
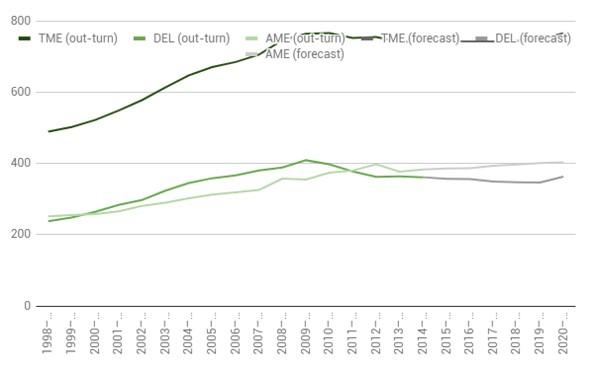
Note: DEL and AME are adjusted to offset the effects of council tax benefit localisation and the business rates retention policy. Historical DEL and AME (prior to 2010–11) are estimates. Forecasts for DEL (beyond 2015–16) are consistent with the July 2015 Budget plans. Figures are not adjusted to remove the effects of asset sales.
Source: TME and deflators are from the OBR Public Finances Databank; DEL and AME out-turns are taken from HM Treasury, Public Expenditure Statistical Analyses 2015 and estimated for years prior to 2010–11 using previous PESAs. Forecasts are from HM Treasury, July 2015 Budget.
Under the Conservative government's July 2015 Budget plans, total public spending will increase by 0.6% between 2015–16 and 2019–20. However, within that, departmental spending will be cut by 2.9%, taking the cut since 2010–11 to 12.8% and leaving departmental spending around the level it was in real terms in 2004–05.
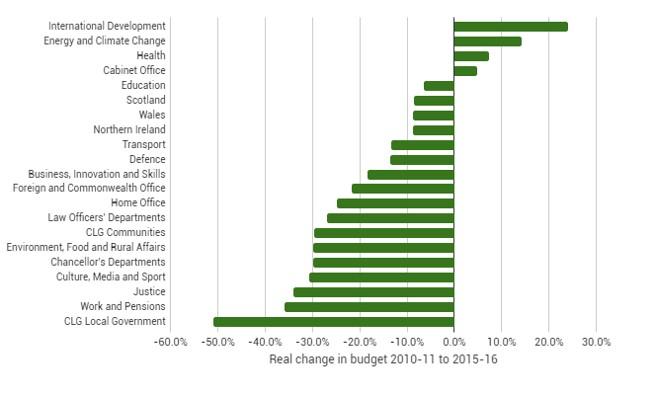
Within departmental spending (and within non-departmental spending), the cuts have also been highly uneven. Figure 2 shows how the cuts to departmental spending between 2010–11 and 2015–16 were allocated across departments. Spending on international development increased in order to meet the government’s international commitment to spend 0.7% of national income on overseas aid by 2013. The government also protected NHS spending and schools spending, and the Department of Energy and Climate Change saw an increase in its budget to increase investment in green technology. In stark contrast, the budget of the Ministry of Justice, the Department for Work and Pensions and the central government grant to local authorities (the 'CLG Local Government' budget) were cut by over a third, and several other departments saw their budgets cut by over 25%.
Figure 2. Real-terms % cuts in departmental expenditure limits, 2010–11 to 2015–16
The cuts to departmental spending in 2016–17 to 2019–20 will be allocated between departments in the Spending Review that will be published on 25 November 2015.
Useful resources
- This observation describes the composition of the planned fiscal consolidation as of the July 2015 Budget
- This report analyses how departments' budgets were cut over the 2010-11 to 2014-15 period, and how these cuts compared with those originally set out in the 2010 Spending Review
- This briefing note explores the outlook for the 2015 Spending Review