
Downloads
Download the report as a PDF
PDF | 612.28 KB
Executive summary
Key findings
- Council tax support (CTS) is a benefit that assists the poorest households in paying their council tax, by providing a reduction on their bills. It operates separately from universal credit (UC). In 2024–25, a total of £4.2 billion was spent on providing CTS to 3.7 million claimants in England, of which £2.5 billion went to families of working age. This report focuses on support for working-age households.
- In aggregate, the scheme is a small fraction of total working-age benefit expenditure, but it plays a significant role in supporting the poorest, on average contributing nearly £540 per year for the poorest tenth (5.5% of their income), and partially offsetting the regressivity of council tax.
- Local authorities both design and administer working-age CTS in England, after responsibility was devolved in 2013–14, whilst in Scotland and Wales the devolved governments have designed their own national schemes. Total working-age CTS entitlements have been cut by £630 million per year (14%) as a result of local reforms, following reductions in central government funding when the schemes were localised and devolved. Since CTS is tightly targeted at those on low incomes, these reductions in generosity have hit the poorest tenth of households the most, reducing their incomes by £106 per year (1%). These cuts occurred entirely among English councils – Scotland and Wales have maintained the generosity of their schemes. Local reforms have slightly strengthened incentives to work, principally because they have reduced the amount of CTS available to out-of-work households.
- Localisation provides opportunities for local democratic decision-making, to reflect local needs, priorities and constraints. At the same time, localisation means that similar families can get different support depending on where they live, and there are additional administrative burdens faced by councils. Moreover, interactions between UC and CTS create additional complexity and sometimes create strong disincentives to work for claimants.
- In England, many councils have moved to ‘banded schemes’, in which entitlement to CTS is determined by which of a set of income bands a household’s income falls into (rather than smoothly reducing CTS as income increases). The aim of these schemes is administrative simplification, though they add complexity to the work incentives faced by claimants: small increases in earnings – for example, from working an extra hour of overtime – may result in claimants being worse off as their CTS entitlements sharply fall.
- There are currently no plans to integrate working-age CTS and UC. However, integration would achieve substantial simplifications of the system for claimants and reductions in administrative costs. It could also strengthen work incentives, but straightforward options to achieve this entail either spending more or reducing the incomes of poorer households. Integration could come with other administrative and financial risks if not handled correctly. And it would necessarily mean reduced local control over the benefit system, though some local control could be retained, by allowing councils to determine the share of council tax that would be covered for each household when in receipt of full universal credit. Nevertheless, given the potential for administrative savings and transparency to claimants, the case for integration of CTS and UC in England, with an offer to include the devolved systems, remains strong.
1. Introduction
Universal credit (UC) is now the primary benefit available to support low-income working-age families in the UK. As part of a transition which is almost complete, UC has replaced six ‘legacy’ means-tested benefits, a reform aimed at simplifying the system and strengthening incentives to work. One of the goals of this reform was to ensure that earning an additional £1 of income from work never left claimants worse off (Department for Work and Pensions, 2010).
However, whilst UC certainly has removed some cases of strong disincentives to work, taking the benefit system as a whole it is still not true that earning more can never decrease a claimant’s income. There remain a range of other benefits that provide means-tested support on top of UC, at a UK, national and local level. The design of these schemes sometimes frustrates the ambition behind UC. This report will examine the role of the most widely received one of these – council tax support (CTS; also known as council tax reduction), focusing on working-age households.
CTS is administered by local authorities, and takes the form of a reduction in council tax bills for lower-income households. Prior to 2013–14, CTS was (in the form of council tax benefit) controlled by the Department for Work and Pensions, with the same scheme applying across the country. In 2013–14, the benefit was replaced by CTS in England, control over which was devolved to local councils for working-age people. In Scotland and Wales, the CTS schemes that replaced council tax benefit are designed nationwide by the respective devolved governments.1 Unlike the six ‘legacy’ benefits, working-age CTS has not been integrated into UC, and there are not currently any plans to do so.
The current working-age CTS system allows a degree of local or devolved control over part of the benefit system. By operating as a direct discount on council tax bills, it also reduces the risk of poorer households falling into council tax arrears, which would have knock-on costs for local councils as they had to pursue potentially expensive enforcement action. However, retaining a separate benefit adds complication to the system, and in some cases risks undermining the goal of UC in strengthening work incentives.
Both pensioner and working-age families can receive CTS, but localised control over CTS has not been extended to pensioner families. As a result, throughout this report we focus on CTS payable to working-age families. We will analyse the role of CTS in shaping working-age households’ disposable incomes and work incentives, examining how its effects differ by area, for different types of households and across the income distribution. We will consider the effects of various potential reforms to CTS. These will include analysis of the main policy levers local authorities have to reform the system and of options for fully integrating working-age CTS into UC.
Throughout the report, we model CTS, council tax, and the rest of the tax and benefit system using the Family Resources Survey and TAXBEN, the IFS microsimulation model. Using data from entitledto on CTS policies adopted by councils across England, TAXBEN is able to model the impact of CTS in each local authority, as well as in Scotland and Wales, on incomes and work incentives, although in some cases we have needed to make simplifications to the modelling. We model CTS and other benefits on an entitlement basis, and council tax and other taxes on a liabilities basis. Consequently, we do not account for non-take-up of benefits or non-payment of tax. (There is limited recent evidence on the take-up of CTS.) We also focus entirely on interactions with the UC system, ignoring legacy benefits which have now been (almost) entirely phased out.
The report proceeds as follows. In Section 2, we outline how CTS works, and the options local authorities and devolved governments have to vary their schemes. In Section 3, we discuss the arguments for having a benefit supporting council tax payments, assess the role it plays, and consider arguments for and against localisation. In Section 4, we briefly document the changes made to schemes across England and in Scotland and Wales. In Section 5, we model the impact of potential reforms to CTS on household incomes and on work incentives. In Section 6, we analyse options for integrating CTS into UC. In Section 7, we draw some conclusions.
2. What is council tax support and how does it work for working-age households?
What is council tax support?
Council tax support is a benefit targeted at poorer households which offsets some or all of their council tax liability. It is distinct from the set of discounts and exemptions in council tax – for example, those applying to people who live alone – which are not means-tested and for which there is limited local discretion.
Put very simply, the calculation for CTS is typically as follows:
- In the absence of any other income, a household on universal credit will receive an award of CTS equal to all or some proportion of their gross council tax liability.2 The remainder of their liability (if any), which they are still responsible for paying, is typically known as the ‘minimum payment’ and is set by the local authority or devolved government.
- This award is then reduced (‘tapered’) based on the amount of income a household has, in a way that depends on family size, housing costs and other factors.
- How rapidly the award is withdrawn, how much income can be received before withdrawal starts, and what counts as ‘income’ for this purpose vary considerably between schemes.
- The final benefit amount then takes the form of a reduction on the recipient’s council tax bill, rather than a direct cash payment.
Many councils, and the systems in Wales and Scotland, broadly follow a similar structure inherited from the former GB-wide council tax benefit system. Local authorities can opt to make use of a legislated ‘default scheme’ in England, and make changes based on that. We outline the nature of the default scheme when discussing each available parameter. Increasingly though, councils in England have shifted towards ‘banded schemes’, in which entitlement to CTS is determined by a household’s position within a set of income bands. The principle is very similar, but rather than CTS being withdrawn smoothly in step 2 as income rises, awards instead jump down in steps as income increases enough to pass over a threshold into a higher band. How banded schemes work is explained in more detail in Box 1 at the end of this section.
CTS is a relatively small benefit in total expenditure, though its reach is wide. Based on Resolution Foundation estimates (Clegg, 2025), CTS spending on all age groups across Great Britain was £4.9 billion in 2024–25. English local authorities accounted for £4.2 billion of this expenditure on 3.7 million claimants, of which £2.5 billion was on working-age families. By contrast, total spending on universal credit in Great Britain (the largest benefit for working-age families) was £68.7 billion (Department for Work and Pensions, 2026). Total expenditure is also lower than expenditure on council tax benefit for working-age families in 2012–13, which stood at £4.0 billion in today’s prices (Department for Work and Pensions, 2026).
When CTS was devolved to local authorities in England in 2013–14, they received less than equivalent funding, meaning councils were required either to reduce spending on CTS, to raise council tax revenues for properties more generally, or to cross-subsidise spending on CTS from elsewhere in their budgets. Since then, local authority reforms in England have significantly reduced the generosity of the system. Nevertheless, despite its small size, it remains the largest devolved means-tested benefit in the UK, and the only substantial benefit controlled by local authorities in England. When CTS responsibility was passed to the Scottish and Welsh Governments, both governments opted to make up the shortfall in consequential funding provided by the UK government.
What are the policy levers available to local authorities?
Local authorities and the devolved governments have a huge degree of flexibility to vary their schemes. Until recently, English councils generally retained schemes with a structure similar to the original council tax benefit scheme they replaced, tweaking certain policy parameters to reduce expenditure. Here, we briefly outline some of these key policy levers. In Box 1 at the end of this section, we explain how these policy levers approximately apply to the new ‘banded schemes’ mentioned above.
Figure 1. Example schedule for council tax support
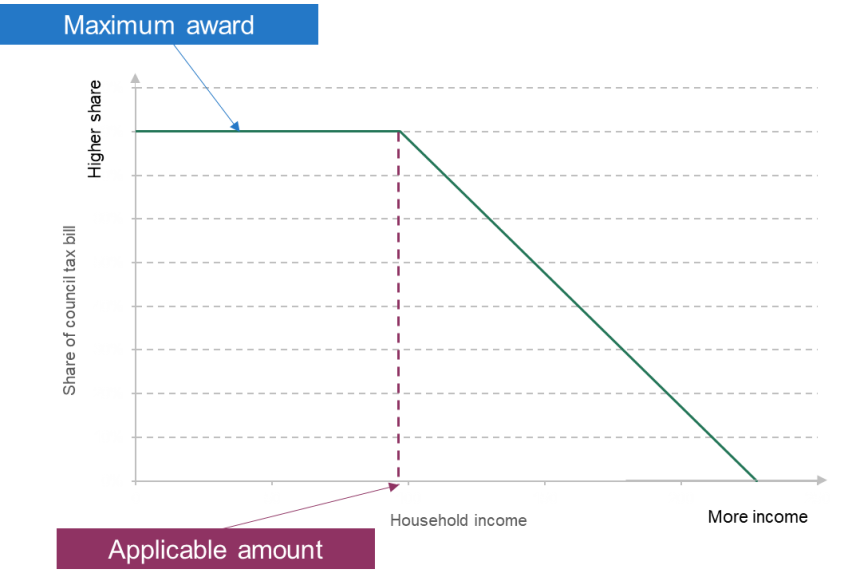
Maximum award
The first major parameter councils control is the maximum award paid to families who are out of work. The default scheme covers a family’s entire council tax bill, but many councils have chosen to reduce this level of support so that the local authority requires the household to make some contribution even if they are out of work.
Such policies can be implemented in a few different ways. One common choice is to implement a proportionate ‘minimum payment’, which typically means all households, even if out of work, must pay a fixed share of their gross council tax bill, with CTS covering some or all of the remaining share depending on how much they earn. Alternatively, councils could require households to pay a fixed cash contribution regardless of their income (which would reduce awards proportionately more for those in lower-banded properties), or cap the level of CTS available to them (e.g. the local band D rate of council tax). In non-banded schemes, the maximum award is tapered away as income increases, and so reducing the maximum award automatically reduces the amount of CTS available to those with some earnings, and takes some out of eligibility altogether.
Means-testing
CTS is a means-tested benefit, so the amount of CTS a household is eligible for will decrease as their income increases. There are a few ways in which councils can vary how this happens.
In the ‘default scheme’, for each additional £1 in income received by a household, including after-tax earnings, universal credit, and income from various other sources, the household loses 20p of its CTS, until it becomes ineligible for any award. This 20% rate at which CTS is withdrawn as income rises is known as the ‘taper rate’. One way councils can reduce expenditure on CTS is tightening means-testing by increasing this rate, thereby reducing the amount of award for those in paid work while leaving the award for those out of work unchanged.
Similarly, councils can vary the applicable amount, the amount of income a family can receive before tapering starts.3 Reducing the applicable amount will cut CTS entitlements for those in work. In the ‘default scheme’ in England, the applicable amount for claimants under the universal credit system is equal to the maximum award for UC, i.e. the amount of UC that households with no other income receive. Consequently, a family’s UC award alone does not trigger tapering of CTS, but any additional income does.
Alternatively, councils can vary the measure of income used in means-testing – for example, excluding UC and other benefits from the calculation entirely, or excluding particular elements of UC, such as the housing element which contributes to renters’ housing costs. Changes in the measure of income affect the effective rate of tapering. We discuss the consequences of changes to measures of income and other parameters in more detail in Section 4.
Other levers
English local authorities and devolved governments can also make other changes to schemes, which we will not discuss in detail in this report but which are mostly accounted for in our modelling. These include:
- Protecting some groups of claimants, generally based on receipt of certain (mostly legacy) benefits, from local policy changes and offering them a higher level of support, closer to that offered under the default scheme that is available to pensioners. This has been a very common mechanism which local authorities have used to avoiding creating large losses for particularly vulnerable groups, though with the shift to banded schemes, and the transition to UC, this is becoming less widespread.
- Varying asset limits (the thresholds of savings above which households become ineligible for CTS).
- Excluding certain households from the scheme entirely based on other conditions – for example, households living in higher-banded properties.
- Varying deductions for non-dependants, which in some cases reduce the awards given to claimants living in multi-family households.
- Varying earnings disregards, which allow claimants to receive a small amount of earnings from work before becoming subject to means-testing (similar to the applicable amount, except applying only to earnings from work rather than all sources of income).
Box 1. How do banded schemes work?
Under non-banded schemes, CTS is withdrawn smoothly as income increases above the applicable amount. This is illustrated in Figure 2, which shows in yellow a scheme with a 20% taper rate (meaning that for every additional £1 of income a household receives, its CTS is reduced by 20p). The green line shows an approximately equivalent banded scheme. Here, small changes in income do not usually result in any change in CTS, but when income rises enough to tip households into a higher band, entitlement jumps down. This means that some workers will become worse off by increasing their earnings by a small amount, raising questions of fairness between claimants, disincentivising some claimants from increasing their earnings by a small amount, and making it difficult for households to plan.
Figure 2. Illustration of banded schemes
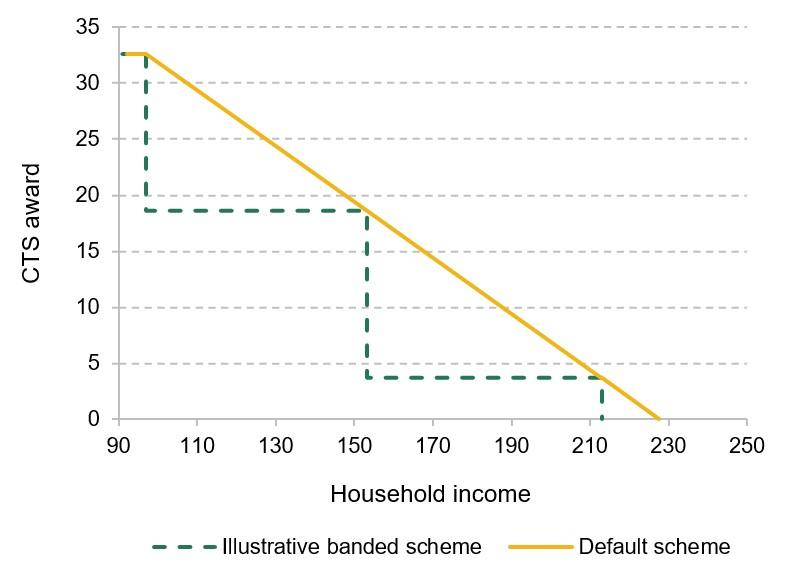
Local authorities generally have a different set of income bands for different family types (e.g. single adults or couples with two children). The award levels are, most often, proportions of the total council tax award, meaning that the difference in income that households face when moving from one income band to another is different for families with different gross council tax liabilities.
We discuss the consequences of banded schemes, and the choices local authorities have made while implementing them, in more detail in Sections 4 and 5.
3. What is the role of council tax support, and who should run it?
The purpose of council tax support
Should the benefit system provide support for payment of council tax?
Gross council tax bills (i.e. council tax liabilities before taking account of CTS) are a large proportion of the incomes of poorer households, as shown in Figure 3 later. They also vary considerably between different households at any given income level, depending on which local authority they live in and the historical value of their property. The government may therefore regard households with higher council tax bills as being more in need of support from the benefit system than others with the same level of income and lower council tax bills.
There are arguments that could be made against the benefit system providing full support for council tax bills. People have some control over the location and value of the property they choose to live in. It is also plausible that higher council taxes in certain areas may, in part, reflect a higher quality or quantity of local provision of services, offsetting the additional needs faced by claimants in areas with higher council tax bills (though in practice differing levels of demand for particular services, or differences in the local tax base, may be a more likely explanation).4 These arguments are weakened by the fact that council tax rates are based on property valuations from 1991 in England and Scotland, and 2003 in Wales, creating large and arbitrary differences in the council tax rates applying to now similarly-valued properties in different areas. This is a problem which itself needs fixing, but is beyond the scope of this report. In any case, the benefit system must balance sometimes competing considerations of generosity to benefit claimants, costs to the taxpayer, and fairness in light of the choices made by those paying for and benefiting from the system.
How does the council tax support system shape household incomes?
To understand the role of CTS, we first examine how it contributes to disposable household income across the income distribution and for different types of families. Figure 3 shows CTS entitlements in green, and council tax liabilities net of CTS in yellow, both in cash terms and as a share of income. The sum of the bars therefore shows gross council tax liabilities. CTS is relatively narrowly targeted at lower-income households and is more targeted than UC. Only a tiny amount of CTS is paid to the richest half of the income distribution. For the poorest tenth of households, entitlements to CTS constitute 5.5% of their disposable income.
Figure 3. Council tax support entitlements, and council tax liabilities (net of council tax support), by equivalised household income decile
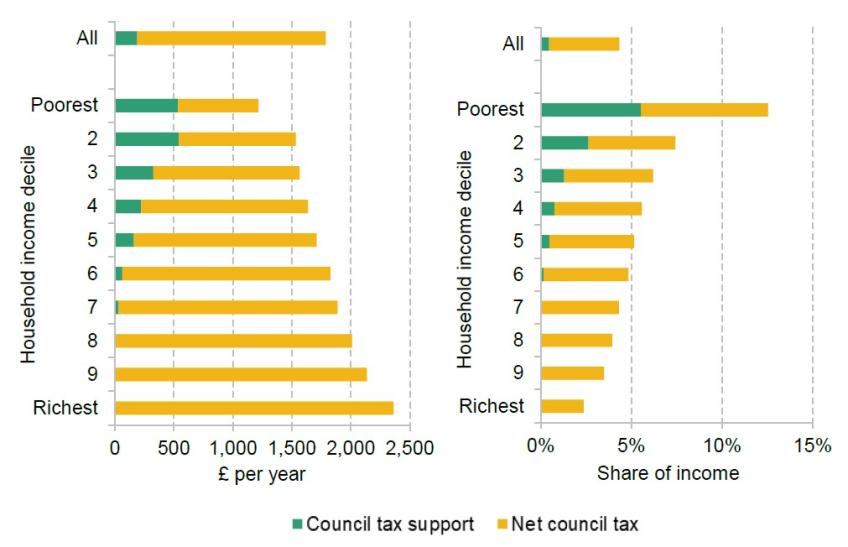
Note: Working-age households in Great Britain.
Source: TAXBEN, the IFS tax and benefit microsimulation model. Family Resources Survey 2022–23, uprated to 2025–26.
One important role of CTS is to substantially reduce the regressivity of council tax with respect to income. In the absence of CTS, council tax would be highly regressive: gross council tax liabilities are, on average, over 12% of income for the poorest decile (tenth) of the income distribution, compared with 5.1% for the fifth decile and only 2.4% for the richest. CTS substantially reduces, but does not eliminate, this regressivity: it halves council tax bills for the poorest tenth on average, leaving them at 7.0% of net income. However, this is still higher than the proportions seen further up the income distribution.
As shown in Figure A1 in the appendix, CTS is a larger proportion of income for lone parents and for single adults living alone than for other households. It is also a larger proportion of income for households out of paid work and for those with very low earnings, given it is tightly targeted at low-income households.
Should council tax support be localised?
Currently, rather than the UK government making judgements on the various trade-offs involved to determine the design of CTS, the decision has been devolved to local authorities in England and to the devolved governments of Scotland and Wales.
One argument in favour of localisation (made by the UK government in 2013–14 when the decision was made) is that it promotes local decision-making and accountability. This argument is more compelling if people in different areas have different opinions on how generous the system should be, or if differing local economic objectives point to different trade-offs between targeting and work incentives. However, in so far as local needs differ simply due to differences in local employment rates and earnings, family composition, health or housing costs, these differing needs can be addressed by a national benefits system without requiring local variation in system design – UC already takes account of all these factors on a claimant-by-claimant basis.
A second argument in favour of localisation (again appealed to by the UK government in 2013–14) is to give local authorities a greater incentive to encourage local economic growth, and to themselves incentivise local benefit claimants into work. The current set-up also seems poorly suited to achieving these goals. The main factor in the benefit system influencing a claimant’s decision to seek work is UC, which councils do not control. Furthermore, most of the savings that would be generated by a claimant entering work would also be in the form of reduced UC payments.
There are clear disadvantages of localisation. First, it increases the complexity of the benefit system for claimants, as they need to apply to different bodies to receive their full support and because it is harder to find information about a system that applies only in a single local authority. Second, differences in the level of support available across areas can be perceived as unfair from claimants’ perspectives, with some accusing the system of becoming a ‘postcode lottery’ (Weakley, 2022; Rose, 2023). Third, localised systems result in complex systems of local bureaucracy, and place substantial burdens on councils to not only administer the scheme, but also to design it effectively, taking account of the broader policy environment. To take one example, the UK government’s recent decision to reverse the two-child limit in UC will have knock-on consequences for claimants’ CTS entitlements, increasing entitlements on average in some areas and decreasing them in others, depending on the types of CTS scheme local authorities have chosen (Charlesworth, 2026). It is burdensome for councils to have to consider whether interactions between their own schemes and national policy developments such as these mean they want to change their schemes, or even need to out of financial necessity.
Wherever one lands on these issues, questions on the degree of localisation can, to some extent, be separated between scheme design and administrative issues. A nationally designed scheme could be administered locally, as is the case with housing benefit, while a partially locally designed scheme could in theory be administered nationally, as we briefly discuss in Section 6 which considers integration with UC.
4. What policy changes have English councils, and the Scottish and Welsh Governments, made?
Councils have increasingly diverged from the council tax benefit scheme that was operated prior to devolution. Here, we briefly summarise some of the key policy choices made among English councils, and in Scotland and Wales. We then discuss the consequences of these choices in the next section.
Policy changes made by English councils
Adoption of banded schemes
In recent years, the adoption of banded schemes has become one of the key forms of deviation from the default system of CTS for England.5 In 2025, 140 councils, or nearly half of those in England, had adopted a banded scheme, at least for new claimants.
Banded schemes were introduced to ease the administrative burden on councils, which must reissue council tax bills every time a respondent’s assessed income, and therefore CTS entitlements, change. Since the introduction of UC, councils have had more frequent and timely information on claimants’ earnings (Bahia and Walker, 2025). Consequently, unless councils choose to use out-of-date information about claimants’ income, they need to send new council tax bills with new amounts of CTS every month. Under banded schemes, if these changes in income are sufficiently small, no rebilling or recalculation of CTS is needed.
In principle, banded schemes could have been introduced that broadly mirrored the schemes they replaced in terms of generosity and targeting. In practice, however, they have coincided with a range of other changes to the maximum awards received by those out of work, and to means-testing, as we discuss below.
Some councils have addressed the issue of frequently changing CTS amounts by changing the assessment period for CTS, or introducing tolerance rules whereby small changes in CTS entitlement do not result in a change in CTS award. Changing the assessment period is likely to be a less disruptive option for claimants, but does reduce the responsiveness of the system to recent changes in circumstances. Tolerance rules risk having some of the same adverse effects on work incentives and fairness between claimants that we discuss in Section 5, but require less wholesale design of the system from a local authority’s perspective.
Reductions in the maximum award
Reductions in the maximum award of CTS, available to claimants with no earnings, are one of the most popular choices among councils to cut the costs of their schemes, achieved mainly through proportionate minimum payments, which require claimants with no income to pay a certain share of their council tax liability. Minimum payments are common among non-banded and banded schemes. In total, 190 local authorities have a minimum payment, of which 63 have banded schemes and 127 have non-banded schemes.6
The average minimum payment among local authorities is 13%. This is a relatively large shift compared with before CTS was devolved, when the minimum payment was zero (in other words, claimants with no other income all received 100% reductions in council tax). Notably, many households that became newly liable to pay some council tax fell into arrears after minimum payments were introduced (Adam, Joyce and Pope, 2019).
Another popular means of reducing the maximum award is capping support at a particular council tax band. Around one in four councils currently have such a cap, which is typically set at the band D rate. This means that households that live in higher-banded properties do not receive additional support beyond that given to a claimant living in a band D property.
Changes to means-testing
Many councils have implemented changes to means-testing. Among non-banded schemes, a large majority of councils have a 20% taper rate, matching the old council tax benefit system. A new rate has been implemented by 30 councils, of which 10 have increased it and 20 have decreased it.7
How does means-testing differ under banded schemes?
Most changes to means-testing have in fact occurred alongside the introduction of banded schemes. The different structure of banded schemes makes it challenging to summarise these changes in a single parameter such as the taper rate. But the varying sizes of the widths of the income bands, and the corresponding drops in CTS awards, mean claimants subject to these schemes now face a wide range of effective taper rates. Unlike in non-banded schemes, the effective taper rate now often varies by family size, since this affects which income bands a family is assessed against, and by council tax band, since households in higher council tax bands face the same proportional drop, and therefore a larger cash drop, in their CTS when moving up a band.
The introduction of banded schemes has also tended to coincide with changes in both the applicable amount (the width of the first band) and the measure of income used for means-testing. Councils have adopted a range of approaches, including means-testing based on a fairly expansive measure of income (UC plus earnings plus some smaller income sources), on a measure excluding particular elements of UC and other benefits, or on earnings only. These choices implicitly change the average withdrawal rate faced by claimants, and mean that claimants receiving different sources of income face different reductions in CTS as their earnings rise. Excluding a means-tested benefit from the measure of income means that when a household’s earnings rise, their true income rises by less than their assessed income, which makes the effective taper rate higher.
Exclusions of (particular elements of) UC are motivated by the fact that local authorities typically set income bands that are invariant to factors such as housing and disability. For example, were housing support not excluded, an out-of-work household with higher rent, and thus higher UC and higher income, would receive less CTS than an otherwise-identical owner-occupier household. Under non-banded schemes, housing support is typically included in the means test, but renters have a higher applicable amount allowing them to receive more income before means-testing begins, preventing such situations from occurring.
However, these approaches are not equivalent for working households with sufficiently high earnings. When local authorities exclude a given element of UC, they simply deduct this from the assessed income of the household, unless tapering means the excluded element is greater than the family’s total UC award. In that case, they assume zero UC is received. Consequently, once a family’s UC award is less than the excluded element, withdrawn UC as their earnings rise further is no longer reflected in their assessed income for CTS means-testing. This makes their effective taper rate higher.
This is most easily explained with an illustrative example. Consider an example local authority that operates a 20% taper and excludes the housing element from UC for the purpose of means-testing (i.e. both from the measure of income used for tapering and from the personal allowance, roughly analogous to the approach taken by many banded schemes). In this local authority, consider two example households, who are earning the same. Assume that if they were out of work, they would both receive the same maximum UC award, but composed of different elements. For the renter, this would include £250 of UC housing element to cover their rent. The earnings of each household mean their UC award has been tapered to £300. Table 1 illustrates how, if their earnings increased, disregarding the value of the housing element in the UC award would result in the renting family seeing their CTS award being withdrawn more quickly, and therefore facing a higher effective marginal tax rate.
Table 1. Illustrative example of tapering of council tax support, in a local authority that excludes the housing element of universal credit from the means test
|
| Owner-occupier example | Renter |
A | Initial UC award | £300 | £300 |
B | Housing element | - | £250 |
C | Initial UC award, excluding housing element (maximum of A – B and 0) | £300 | £50 |
D | Earnings increase | £200 | £200 |
E | Withdrawal of UC | (£110) | (£110) |
F | New UC award (A – E) | £190 | £190 |
G | New UC award excluding housing element (maximum of C + E and 0) | £190 | 0 |
H | Withdrawal of UC excluding housing element (G – C) | (£110) | (£50) |
I | Change in income (D + E) | £90 | £90 |
J | Change in income excluding housing element (D + H) | £90 | £150 |
K | Withdrawal of CTS | (£18) | (£30) |
L | Final increase in income | £72 | £60 |
M | Effective marginal tax rate | 64.0% | 70% |
This means that working renters will receive less support than working non-renters, relative to their assessed needs, if the housing element is simply excluded from income bands and the measure of income. Similar examples could be constructed in the cases of all excluded UC elements. For banded schemes, the point at which CTS is reduced as earnings rise can now therefore depend, even within a local authority and among claimants with the same earnings, on council tax band, family size, housing costs, disability and other factors. It seems unlikely that this complicated picture for work incentives is optimal, or indeed deliberate.
A simpler approach to implementing banded schemes, which still reflects differing needs arising from housing costs, ill health and other factors, is to keep including all of UC in the income measure, but have a starting band that varies based on the width of each household’s UC maximum award (the amount of UC to which they would be entitled if out of work). A small number of councils have opted to base means-testing on excess income in this way. This type of banded scheme is the closest approximation to the old council tax benefit system that was in place before 2013–14. Another option is to use income bands based only on earnings, but to reduce the effective taper rate so that the effective marginal tax rate for people having both UC and CTS withdrawn does not increase. This would be roughly equivalent to the excess income approach in many cases, but would mean more generous treatment for those with unearned income (e.g. from savings).
Policy changes made by the Scottish Government
The Scottish Government has retained a system of CTS broadly mirroring in structure the Britain-wide system of council tax benefit that applied previously, but applying throughout the country. However, there are a few key deviations.
One important difference is that, unlike in most English non-banded schemes, the ‘applicable amount’ is not calculated directly based on the maximum award for UC. In particular, the applicable amount for CTS increases more per child than it does in UC, and is increased for third and subsequent children (which will also by default be the case in England and Wales following the reversal of the two-child limit from April 2026). This increases the generosity of the system in Scotland for some in-work families with children.
Another key difference is that the applicable amount does not vary with housing costs, although for households in receipt of a full award, this is cancelled out by the fact that the housing element of UC is not included in means-testing. This is a somewhat similar choice to that made by some English councils with banded schemes. In fact, in Scotland, all elements of UC except the child element, childcare element and child disability element are excluded.8 Excluding elements of UC in the way Scotland has done means the lowest-income households effectively face a higher taper rate as their earnings increase.
The Scottish Government has also made smaller changes, including to the rates of non-dependant deductions.
Beyond these changes to CTS, there is also a separate system of rate reliefs, which low-income households in properties of bands E to H can apply for instead of CTS. We do not model this scheme here.
Policy changes made by the Welsh Government
The scheme operating in Wales broadly mirrors the default structure of the system in England, but has one set of rules applying through the country. There is no minimum payment in Wales. The applicable amount is based on the maximum award of UC, and income includes all UC. Wales has increased its non-dependant deductions which reduce entitlements for multi-family properties.9
5. What has been the impact of reforms to council tax support on incomes and work incentives?
How have reforms affected incomes?
In almost every local authority in England, reforms to CTS schemes have reduced the generosity of the system. In aggregate, across the UK, entitlements have been cut by around half a billion pounds per year relative to the default scheme. Figure 4 shows that poorer households have been particularly affected by these reforms. The poorest tenth have lost £106 a year on average in entitlements, and the second-poorest tenth £96 a year. This pattern arises simply because CTS was narrowly targeted at the poorest households to begin with, making them more exposed to cuts to the scheme. Again, we note that all analysis here is on the basis of entitlements, and does not account for non-take-up of CTS.
Figure 4. Effect of local and devolved reforms to council tax support, by equivalised household income decile

Note: The figure shows the effect of all local and devolved reforms, relative to the default scheme as would exist in England in the absence of any local decisions to deviate, and which applies to pensioners.
Source: TAXBEN, the IFS tax and benefit microsimulation model. Family Resources Survey 2022–23, uprated to 2025–26.
As shown in Figure 5, the largest reductions in average CTS awards have been seen in Yorkshire, the North West, London, the South West and the Midlands. Scotland has seen an increase in the generosity of its scheme due to changes made around the roll-out of UC, and Wales has seen little change. These patterns partly reflect differences in the design of schemes, but also again the relationship between council tax bills and the income distribution. The average impact of an equivalent reduction in CTS will be greater in more deprived areas, where there are more claimants. Figure A3 in the appendix shows that lone parents and single adults without children have been particularly affected by cuts, again reflecting the fact that they are more likely to be on CTS in the first place. Figure A2 in the appendix shows the distribution of average changes in generosity across local authorities.
Figure 5. Effect of local and devolved reforms to council tax support, by region
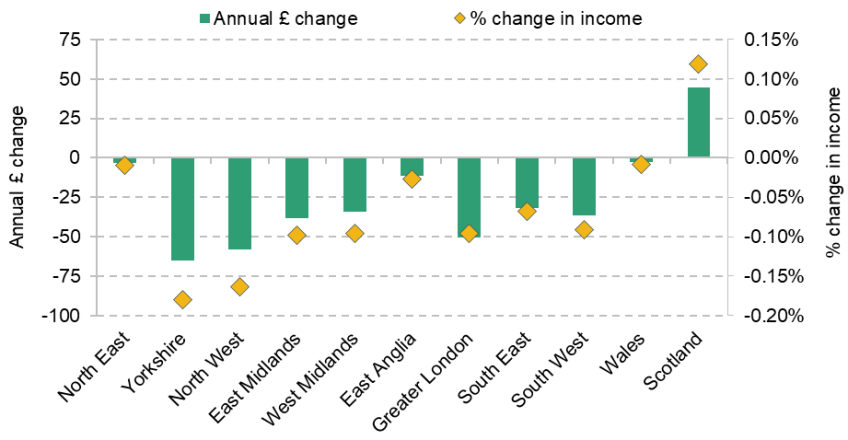
Note: The figure shows the effect of all local and devolved reforms, relative to the default scheme as would exist in England in the absence of any local decisions to deviate, and which applies to pensioners.
Source: TAXBEN, the IFS tax and benefit microsimulation model. Family Resources Survey, 2022–23, uprated to 2025–26.
How does council tax support interact with tax and other benefits to shape work incentives?
Decisions on the generosity and targeting of CTS must reflect trade-offs between several related factors, including the needs of claimants, costs to the taxpayer and effects on claimants’ work incentives, as well as administrative factors.
Providing a more generous level of any means-tested benefit for households on lower incomes typically weakens incentives to enter work, or increase hours and earnings, because doing so will result not only in increased income tax and National Insurance liabilities, but also the loss of more benefit income. This can be mitigated by providing more support for households in paid work – for example, by reducing the rate at which benefits are tapered away as earnings rise – but doing so comes at additional cost and increases the number of people subject to tapering.
Layering CTS as a separate benefit on top of UC adds to the disincentive to increase earnings, because as claimants increase their earnings, as well as paying more tax, they see both benefits withdrawn simultaneously. For example, consider an employee receiving UC and CTS. Suppose their earnings are low enough that they do not pay tax, but they are receiving UC and CTS (in a council that implements a 20% taper rate). Then if they increase their earnings by £100, they may see £55 of that clawed back in reduced UC and a further £9 (20% of their rise in earnings, net of UC withdrawal) clawed back in reduced CTS. This is an effective marginal tax rate of 64%. If their earnings are high enough that they pay National Insurance and basic-rate tax – a comparatively less common scenario, since those poor enough to qualify for CTS are most often not taxpayers – then following a £100 increase in gross earnings, they will see £28 clawed back in tax and National Insurance, then £40 in reduced UC (55% of their net earnings) and a further £6 in reduced CTS. This leaves them with only £26, an effective marginal tax rate of 74%.
Figure 6 summarises the work incentives of workers in households entitled to means-tested benefits. It uses two key summary measures. The participation tax rate (PTR) gives, as a share of gross earnings, the amount lost through tax or withdrawal of benefits, from working compared with being out of work entirely. It summarises how much the system disincentivises having a job at all. The marginal tax rate (MTR) as defined here gives the amount lost through tax or withdrawal of benefits when increasing earnings by £10 a week, and summarises how much the system disincentivises people to increase their earnings incrementally.10 The PTR is the most important factor in influencing workers’ behaviour (Meghir and Phillips, 2010). Very high PTRs are also particularly distortionary, meaning reducing the dispersion of PTRs (cutting the highest PTRs but increasing lower PTRs) can have a positive effect on employment.
Figure 6. Participation tax rates and marginal tax rates for earners in receipt of universal credit
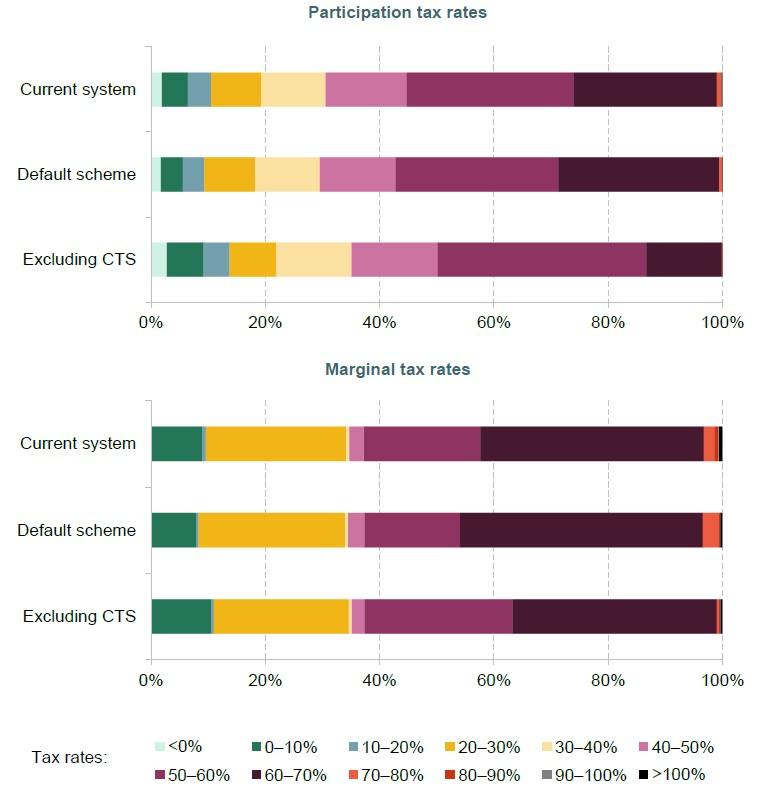
Note: Calculated only for earners. The sample is defined more precisely in the note to Figure 9.
Source: TAXBEN, the IFS tax and benefit microsimulation model. Family Resources Survey 2022–23, uprated to 2025–26.
The figure shows MTRs and PTRs under the existing set of CTS systems, under a counterfactual where all councils adopted the ‘default scheme’ and under a counterfactual where there was no CTS.
Local reforms to CTS have slightly decreased claimants’ participation tax rates, as cuts to the generosity of support for households with no income have strengthened incentives for households to remain in work. When examining marginal tax rates, a slightly more complicated picture emerges. General reductions in the generosity of CTS have reduced the number entitled to it, and therefore subject to tapering. This means fewer claimants with marginal tax rates in the 60–70% band, where most claimants receiving both CTS and UC would sit. On top of this, the introduction of banded schemes has meant that CTS recipients in areas with such schemes are now more likely to face either a 0% MTR, meaning they lose no CTS by working a little more, or a very high MTR (even in some cases in excess of 100%, meaning they are worse off by increasing their earnings by a small amount).11 Figure A4 in the appendix shows work incentives only among local authorities that have adopted banded schemes.
What trade-offs do English councils and devolved governments face when making reforms?
Given the plethora of reforms to CTS enacted across Great Britain, here we isolate the effect of two key reforms local authorities can make: changes in the taper rate, and changes in the maximum award (enacted through minimum payments). If councils wish to vary the generosity of their system, rebalance support to strengthen work incentives or increase targeting at the poorest households, these are the two key policy options available to them.
Cutting maximum awards reduces entitlements for out-of-work households. This leaves CTS somewhat less targeted at the lowest-earning households, though there are also knock-on consequences for in-work households, who receive lower awards and in some cases become ineligible for CTS entirely. Increasing the taper rate cuts entitlements for households in work (or with income from other sources beyond UC), while leaving entitlements for those with no other income unchanged.
To illustrate the effects of these two policy levers on work incentives, we take the English default CTS system (which has a taper rate of 20% and a minimum payment of 0%), and simulate households’ entitlements if it applied throughout Great Britain. We then model two alternative scenarios: (1) increasing the taper rate to 100% (the tightest form of means-testing possible without creating cliff edges in support – an admittedly extreme option which we use for exposition) and (2) reducing the starting award by imposing a minimum payment of 10%. These values have been chosen as they deliver aggregate cuts to the GB-wide CTS entitlements bill approximately equal to the aggregate cut resulting from the reforms that have in fact taken place (where cuts have occurred entirely among English councils).
Figure 7 summarises the effect on work incentives of these two reforms, again focusing on those in receipt of UC. The figure shows, as expected, that minimum payments slightly increase incentives to work, as measured by the participation tax rate, since they reduce the total CTS payment claimants can receive when out of work. Increasing the taper rate creates a more complex picture. For single claimants, the incentive to work is unambiguously weakened, since they lose their CTS more quickly as income rises. For those with working partners, the opposite effect can sometimes be seen, since the increased taper may reduce their household income when their partner is working but they themselves are out of work. This is the most important measure in understanding effects on work incentives.
Figure 7. Participation tax rates and marginal tax rates under counterfactual reforms, for earners in receipt of universal credit
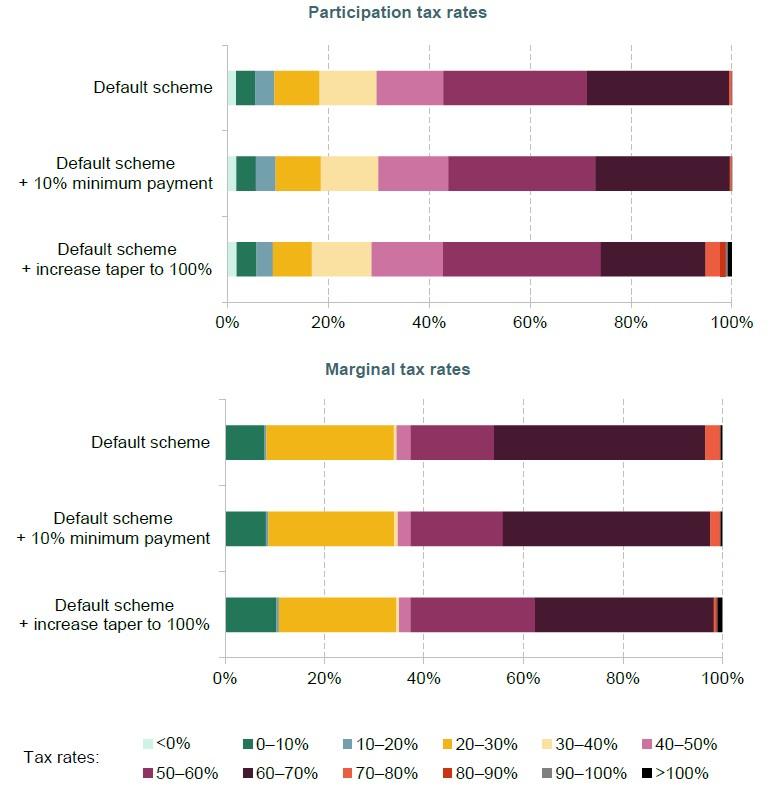
Note: Calculated only for earners. The sample is defined more precisely in the note to Figure 9.
Source: TAXBEN, the IFS tax and benefit microsimulation model. Family Resources Survey 2022–23, uprated to 2025–26.
Turning to the incentive to increase earnings by a small amount, we see that minimum payments slightly strengthen such incentives (as measured by lower marginal tax rates), because minimum payments result in fewer households being eligible for CTS, and therefore subject to tapering. The average marginal tax rate is virtually unchanged, from 48.4% to 48.5%. The increase in the taper to 100% has a more complicated effect – fewer households are subject to means-testing since awards are withdrawn more quickly, but the small number that are still entitled find themselves with marginal tax rates of 100%, since all of a rise in earnings is clawed back in tax, withdrawn UC and/or withdrawn CTS. The average marginal tax rate falls to 47.6%.
Councils and devolved governments can also pull these two policy levers to vary CTS generosity to target different objectives in the trade-off between means-testing and work incentives. For a council looking to make savings, decreasing maximum awards leaves CTS relatively less targeted at households on the lowest earnings but strengthens incentives to work, while increasing the taper rate leaves CTS more targeted at households with the lowest earnings but weakens incentives to work.
6. How could working-age council tax support be integrated into universal credit?
Our analysis to this point has considered the reforms councils have, and could, make to their CTS systems. An alternative that the central government could pursue would be to integrate working-age CTS into UC. The principle behind such a reform could be straightforward. Rather than receiving support through a separate benefit which interacts with UC in varying and complicated ways, households could have their total gross council tax amount covered by a new ‘council tax element’ included in their maximum award of UC (i.e. the amount of UC they would receive if they had no other income) – to be added to the amounts they already get for rent, children, disability and so on. Then, their total UC would be tapered away as their income increased in the usual way.
Integration of working-age CTS into UC with no other changes would make the benefit system as a whole more costly, increasing entitlements by £5.0 billion per year. A key determinant of the impact of integrating in this way is the differing distributional profiles of UC and CTS. Because they are withdrawn at the same time but CTS is a much smaller benefit, it is much more tightly targeted on the poorest households. Therefore, integrating the two results in many people who receive UC but not CTS benefiting. In addition, it would entail eliminating any minimum payments, increasing the cost of the system on average. So, carrying out the above modification and making no other changes would make the benefit system as a whole more costly. If CTS take-up rates are lower than UC take-up rates, integration would probably cause take-up to increase. This may be a benefit of integration, but means it is plausible that the cost would be higher than the total increase in entitlements.
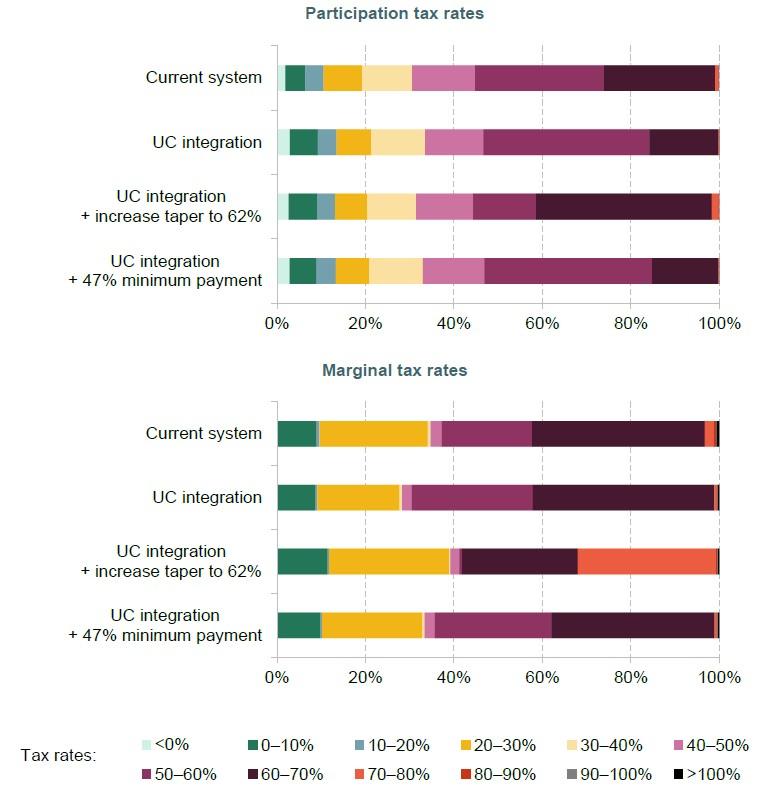
If the government wanted to integrate working-age CTS in UC without increasing overall benefit entitlements, it could, alongside integration, vary either the parameters of UC or the size of the council tax element. Two possibilities would be to raise the UC taper rate by 7 percentage points to 62%, or to have a council tax minimum payment of 47% so that the new UC council tax element only covers 53% of claimants’ gross council tax liabilities. These represent two simple illustrative scenarios – in reality, the government might wish to pick an intermediate option.
The impact of these three models of integrating working-age CTS into UC on disposable incomes is shown in Figure 8. The figure assumes CTS is integrated into UC across Great Britain, though in practice the Scottish and Welsh Governments might wish to retain control of their local systems. Introducing a full council tax element with no further changes would mostly benefit households in the poorest half of the income distribution. The cash gains for those in the poorest tenth would be lower than those for other households in the poorest half. This is mainly because working-age households in the poorest tenth are likely to be out of work, and therefore see no benefit from the effective cut in the combined UC + CTS taper rate. In addition, integration would interact with the government’s benefit cap, which limits the total amount a family can receive in UC under certain circumstances. The benefit cap would affect more households, since currently CTS is out of its scope. Even in the richer half of the income distribution, there would be some cash gains, as integrating working-age CTS into UC without increasing the UC taper would push UC entitlement further up the income distribution.
Figure 8. Impact of options for integrating working-age council tax support into universal credit, relative to current system
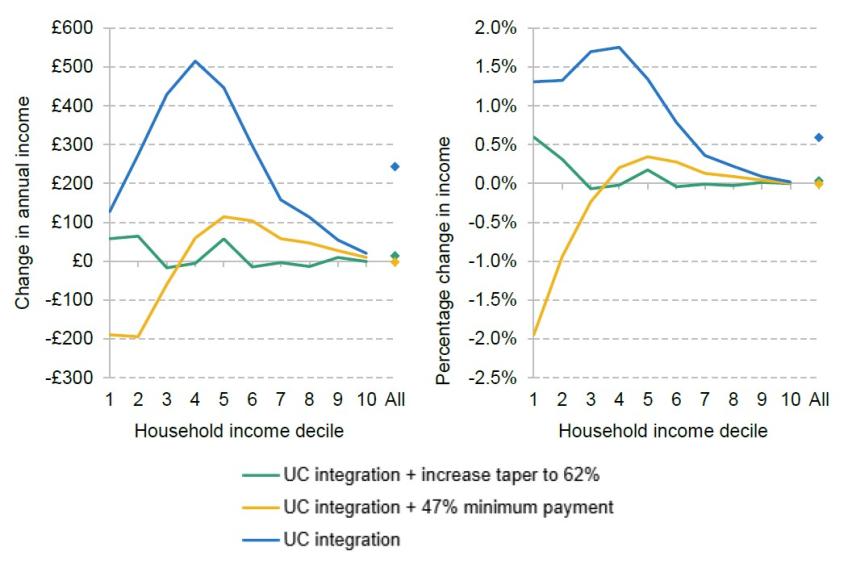
Source: TAXBEN, the IFS tax and benefit microsimulation model. Family Resources Survey 2022–23, uprated to 2025–26.
If the government attempted to make integration revenue-neutral by adopting a 47% minimum payment, this would result in a substantial cut in income for the poorest tenth of working-age households. In some cases, we would expect this to result in increases in arrears on bills, with consequent collection and enforcement costs. For low-income working-age households, a minimum payment of this magnitude would more than offset the gains from integration, whereas for richer households it would only partially offset the gains – they are generally not entitled to CTS under the existing system, so it is difficult for them to lose out from integration. On the other hand, an increase in the UC taper rate would on average offset the gains from integration across the income distribution. If the government wanted to maintain the targeting of CTS at the poorest households whilst limiting the cost of integration, raising the taper would be the most effective choice.
However, the government would also need to consider the impact on work incentives of the various integration options, as illustrated in Figure 9. Fully integrating CTS into UC would increase the incentive to enter work at all, captured by the participation tax rate. The average participation tax rate decreases from 46.3% to 43.8%. Meanwhile, the marginal incentive to earn an additional pound falls on average, with effective marginal tax rates increasing from 48.4% to 50.2%. However, this average masks a decline in both the lowest and highest MTRs.
Figure 9. Impact of integrating working-age council tax support into universal credit on work incentives
Note: Calculated only for working-age earners. In all cases, we restrict to households entitled to universal credit under the ‘UC integration’ scenario without further adjustments to taper rates or minimum payments.
Source: TAXBEN, the IFS tax and benefit microsimulation model. Family Resources Survey 2022–23, uprated to 2025–26.
Reducing the cost of integration by introducing a 47% minimum payment would provide a further strengthening of work incentives, since this cut to generosity would fall more on out-of-work households. On the other hand, raising the UC taper to offset the cost of integration would more than undo the strengthening of work incentives brought about by integration. More households earning enough to pay income tax would be brought into UC means-testing, raising their marginal tax rates, whilst the higher generosity of CTS they could receive when out of work (explained largely by the removal of minimum payments) would mean their participation tax rate increased. The pattern we see on marginal tax rates is explained by the fact that CTS is currently much more tightly targeted at the poorest households than UC is, and so integrating working-age CTS into UC while increasing the UC taper has the effect of shifting means-testing for CTS further up the income distribution than is currently the case. There is a set of households who would see marginal work incentives strengthened – some working households on very low earnings would see their marginal tax rates fall, if they were currently on the CTS taper but within their UC work allowance. But seeking to entirely offset the costs of integration with lower taper rates would largely result in weakened work incentives relative to the status quo.
Within the existing parameters of UC, it is not possible to substantially strengthen work incentives without either spending additional money or reducing generosity for the poorest households. Here, we have analysed three separate models of integration, which are effectively three extreme options prioritising one of three plausible end goals – minimising cost, minimising losses for the poorest households, and strengthening work incentives. In reality, the government may wish to choose an intermediate option between two or three of these goals if it decides to embark on integration.
If the government wished to use UC integration as a means of tidying up the system, while broadly leaving the targeting of support for council tax unchanged, it would be unable to do so within the existing structure of UC. This is principally because CTS is currently more targeted at poorer households than UC – in other words, it is tapered away earlier. To replicate that within the UC system would require UC to have a higher taper rate for lower-income households – something the government is unlikely to find attractive, not least because of the reduction in transparency. But the very fact that this is what the existing system approximates highlights its deficiencies.
What are the advantages and disadvantages of integration?
As shown above, integrating working-age CTS into UC could help to mitigate some of the more extreme cases of adverse work incentives arising from interactions between the two separate schemes at present, depending on how much money the government was willing to spend. Potential benefits extend beyond this, however.
Integrating the two systems would represent a substantial simplification of the benefits system, helping claimants to better understand their total benefit entitlement and how this would change as their circumstances change. By making it easier to access their full support, integration could also increase take-up rates among claimants. Such a simplification could also significantly reduce administrative burdens for local authorities, as we discuss in Section 3.
There are a number of possible problems, or at least complications, associated with integrating working-age CTS into UC. One cause for concern is risks to local authority finances. Presumably, central government taking responsibility for working-age CTS and integrating it into UC would be accompanied by a reduction in local authority funding. This need not result in a greater funding squeeze for local authorities in aggregate, since they would lose both some funding and a spending obligation. Of course, local authorities may fear that integration would be accompanied by outsized cuts to local authority funding (Bahia and Walker, 2025). In addition, individual councils may lose out, if they have made cuts to working-age CTS to cross-subsidise other services.
Another issue, raised by local authorities, is that integrating working-age CTS into UC would increase rates of council tax arrears (Ollerenshaw, 2016). The high rate of arrears arising after many poorer households had to start paying council tax due to minimum payments suggests this is a legitimate fear (Adam, Joyce and Pope, 2019). The most straightforward implementation of integration would see claimants responsible for paying their entire gross council tax bill using the additional UC they received, raising the risk of non-payment. This would harm local authority finances not only directly where taxes could not be eventually recovered, but also through an increase in collection and enforcement costs.
This risk would of course need to be carefully considered were integration to be pursued, but in principle could be overcome by the Department for Work and Pensions collecting council tax from claimants through deductions to their UC – in other words, taking part of the claimant’s UC (equal to their council tax amount) and sending that directly to local authorities. Similar deductions can already be made to pay landlords directly where renting claimants fall into rent arrears, and are made to repay advance UC loans or overpayments of tax credits, so such mechanisms are not without precedent.
Another drawback would be the loss of local control over working-age CTS, with many councils previously expressing concern that integration would coincide with further cuts to generosity, which they would oppose (Ollerenshaw, 2016). A straightforward integration of households’ full council tax liability into the UC award would indeed sacrifice some local control of the system. But it is also plausible that working-age CTS could be integrated into UC while still maintaining some localised control.
Local authorities (and devolved governments if they wished to see their own systems integrated into UC) could be allowed to vary parameters such as minimum payments, maximum council tax bands supported, or exemptions from these limits for particular groups. For example, councils could specify the share of a family’s gross council tax liability that should be added to their UC needs, which would then be tapered away as part of their overall UC award as usual. If the government allowed local authorities this freedom, it would have to recoup any differences in generosity via local authority grant funding, so that more generous councils bore the additional cost of their schemes. Such a system would not allow total flexibility – for example, it is difficult to see how local authorities could adjust the taper rate or other aspects of the means-testing mechanism. But they would still have a great deal of flexibility to decide the overall generosity of the system, and some degree of flexibility to target more support at particular groups.
Finally, given in particular the administrative difficulties encountered in initially rolling out UC, many local authorities have in the past expressed scepticism over the government’s capacity to integrate CTS (Ollerenshaw, 2016). However, UC has come a long way since the technical problems of the early roll-out, with quick implementation of the £20 COVID uplift, for example, demonstrating that quick and effective reforms can be made to the system.
7. Conclusion
Council tax support is a relatively small benefit, but it plays an important role in topping up the disposable incomes of the poorest households, by supporting them to pay their council tax. However, it is a complicated system, both due to the complex structure of work incentives it creates for individual households in any part of Great Britain and because of the huge variation in scheme choices across the English local authorities and the national systems of Scotland and Wales.
Localisation and devolution of the working-age CTS system provides English local authorities and the Scottish and Welsh Governments with the power to vary the generosity and targeting of the benefits system. But retaining CTS as a separate system on top of universal credit means that households must account not only for tax and National Insurance, but also for the withdrawal of both UC and CTS, when trying to understand how much they stand to gain by increasing their earnings.
In the White Paper setting out the government’s first plans for UC in 2010, the then Work and Pensions Secretary Iain Duncan Smith said that ‘Universal Credit will mean that people will be consistently and transparently better off for each hour they work and every pound they earn’ (Department for Work and Pensions, 2010). This goal has still not been achieved. CTS is not the only culprit,12 but it plays a non-trivial role in weakening work incentives, and is one of the main hindrances to improving the transparency of the system for claimants.
Local reforms have had a mixed impact on work incentives, but on the whole have strengthened claimants’ incentive to work, due to the reduction in the generosity of CTS. They have certainly added to the complexity of the system, with variation in how generous schemes are, how rapidly they are means-tested away, and what measures of income means-testing is based on – variation which is now seen both between local areas and in some cases between different families living in the same local authority.
In light of this, and the significant administrative burden created by localisation of administration and scheme design, the UK government should consider integrating working-age CTS into UC in England, and giving the Welsh and Scottish Governments the option to be part of such an integration. This would mean working-age CTS ceased to exist as a separate benefit, and instead UC claimants would receive an additional element to cover (a portion of) their council tax bills. Whilst integration into UC without changing its existing structure would not deliver easy and costless options to strengthen work incentives or to increase support for poorer households, it would certainly provide opportunities both for simplification from claimants’ perspectives and for reducing administrative costs. It could even be done in a way that allows some degree of local decision-making to persist. Any attempt at integration would create winners and losers, both among claimants and between local authorities. It would also have other administrative and political risks. However, a system allowing councils to collect council tax from claimants via UC deductions could be implemented, to ensure higher UC awards following integration were still spent on council tax.
On the other hand, working-age CTS is the main policy lever available to English local authorities, and to Wales, to directly redistribute to lower-income working-age households, and some may be reluctant to see this control lost. If there is a desire for significant local control of benefits to be retained, the complex patchwork of reforms that has emerged suggests there are at least merits to more coordination between local authorities and central government – to create schemes that are as simple and consistent in structure as possible. This would ease bureaucratic pressures for councils and make the system easier to understand for claimants. Local decision-making could be effectively exercised through a few key parameters, rather than through complex changes to hundreds of parameters, or overhauls of the system that come with unintended or opaque consequences. More generally, local support for poorer households need not be attached at all to council tax collection, which constrains the targeting of the support and increases its administrative cost. Other schemes of local support such as discretionary housing payments or the household support fund already exist, and could play an expanded role in allowing local authorities to support those struggling in their area, though this would come with its own challenges for design and implementation.
Appendix. Additional figures
Figure A1. Council tax support entitlements, and council tax liabilities (net of council tax support), by family type
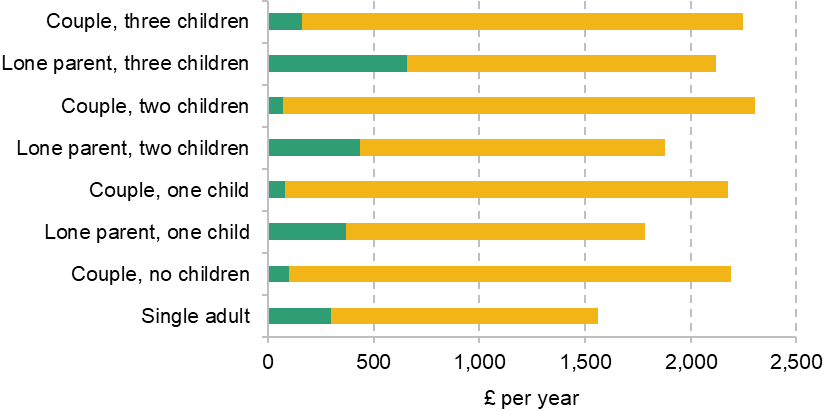

Note: Working-age households in Great Britain.
Source: TAXBEN, the IFS tax and benefit microsimulation model. Family Resources Survey 2022–23, uprated to 2025–26.
Figure A2. Average change in household council tax support by local authority, due to local and devolved reforms
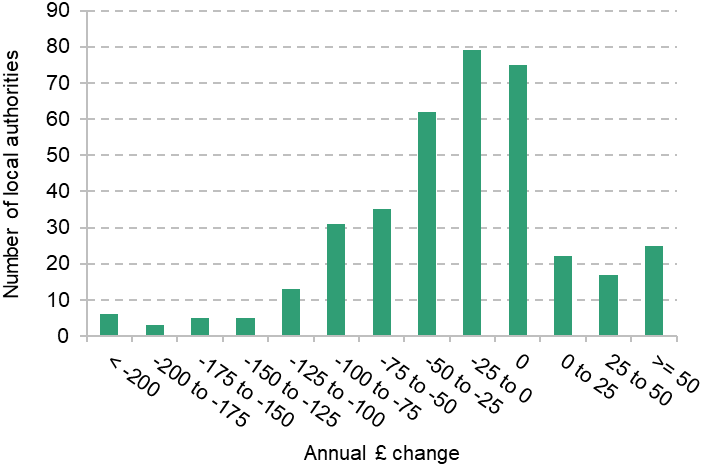
Note: Working-age households only.
Source: TAXBEN, the IFS tax and benefit microsimulation model. Family Resources Survey 2022–23, uprated to 2025–26.
Figure A3. Effect of local and devolved reforms to council tax support, by family type

Note: The figure shows the effect of all local and devolved reforms, relative to the default scheme as would exist in England in the absence of any local decisions to deviate, and which applies to pensioners.
Source: TAXBEN, the IFS tax and benefit microsimulation model. Family Resources Survey 2022–23, uprated to 2025–26.
Figure A4. Participation tax rates and marginal tax rates for earners in receipt of universal credit living in councils that operate banded schemes

Note: Calculated only for earners who live in local authorities that operate banded schemes. Restricted to those who would receive UC under CTS-UC integration.
Source: TAXBEN, the IFS tax and benefit microsimulation model. Family Resources Survey 2022–23, uprated to 2025–26.
References
Adam, S., Joyce, R. and Pope, T., 2019. The impacts of localised council tax support schemes. IFS Report, https://ifs.org.uk/publications/impacts-localised-council-tax-support-schemes.
Bahia, I. and Walker, R., 2025. A path to better council tax support schemes. Policy in Practice, https://policyinpractice.co.uk/wp-content/uploads/2025/05/Report_A-path-to-better-Council-Tax-Support-schemes_Apr25-.pdf.
Charlesworth, Z., 2026. Council tax reduction schemes in 2027: the factors to consider. Policy in Practice, https://policyinpractice.co.uk/blog/council-tax-reduction-schemes-in-2027-the-factors-to-consider/.
Clegg, A., 2025. The localisation era: assessing the post-2013 rise of localised social security. Resolution Foundation, https://www.resolutionfoundation.org/app/uploads/2025/11/The-localisation-era.pdf.
Department for Work and Pensions, 2010. Universal credit: welfare that works. Cm 7957, https://assets.publishing.service.gov.uk/media/5a79581640f0b63d72fc4fd9/universal-credit-full-document.pdf.
Department for Work and Pensions, 2026. Benefit expenditure and caseload tables 2025. https://www.gov.uk/government/publications/benefit-expenditure-and-caseload-tables-2025.
Hatfield, D. and Clegg, A., 2021. New analysis: council tax support scheme costs rise by 16% as London boroughs struggle to meet Covid-driven demand. Policy in Practice, https://policyinpractice.co.uk/wp-content/uploads/2025/03/New-analysis_-Council-tax-support-costs-rise-by-16-as-London-Boroughs-struggle-to-meet-Covid-driven-demand_30Jun21.pdf.
Meghir, C. and Phillips, D., 2010. Labour supply and taxes. In Dimensions of Tax Design: The Mirrlees Review, Oxford University Press for the Institute for Fiscal Studies. https://ifs.org.uk/books/labour-supply-and-taxes-0.
Ollerenshaw, E., 2016. Three years on: an independent review of local council tax support schemes. Department for Communities and Local Government, https://assets.publishing.service.gov.uk/media/5a80ae5b40f0b62302694e71/Local_Council_Tax_support_schemes_-_review_report.pdf.
Rose, M., 2023. It’s time to rethink council tax support. We Are Citizens Advice, https://wearecitizensadvice.org.uk/its-time-to-rethink-council-tax-support-9786330eff8f.
Weakley, K., 2022. Council tax support postcode lottery prompts reform call. Local Government Chronicle, https://www.lgcplus.com/finance/council-tax-support-postcode-lottery-prompts-reform-call-31-05-2022/.
Data
Department for Work and Pensions, NatCen Social Research. (2021). Family Resources Survey. [data series]. 4th Release. UK Data Service. SN: 200017, DOI: http://doi.org/10.5255/UKDA-Series-200017
Acknowledgements
The authors gratefully acknowledge the support of the ESRC Centre for the Microeconomic Analysis of Public Policy (ES/Z504634/1). They also gratefully acknowledge comments from Stuart Adam, Jonathan Cribb, Helen Miller and Tom Waters, as well as advice from an expert group consisting of representatives from the Department for Work and Pensions, entitled to, HM Treasury, the Local Government Association, the Scottish Government and the Welsh Government.
Endnotes
Authors

Matthew Oulton
Matthew is a Research Economist in the Income, Work, and Welfare sector. His research focuses on the UK tax and benefit system.

Tom Wernham
Tom's main research areas are living standards and poverty, the benefits system, and its interactions with the labour market.
More from IFS
Understand this issue


Policy analysis


Academic research


