Twenty years ago only 1 in 20 men aged 25 to 55 with low hourly wages worked part-time. Today 1 in 5 of this group work part-time: a four-fold increase (see Figure). This is the result of a steady trend – not just the recent recession. Meanwhile the proportion of middle- and high- wage men working part-time remains extremely low, at less than 1 in 20.
Hence, for men low hourly wages and low hours of work increasingly go together. This has become an important driver of inequality in their pay.
These are among the findings from new IFS analysis on inequality in Britain over the past two decades, which forms part of a forthcoming article in the journal Economica, published today as an IFS Working Paper and summarised in a short accompanying Executive Summary.
Key findings on pay inequality among those in work include:
Weekly earnings inequality among men has risen significantly. This is partly because the hourly wages of high-earners grew faster than those of middle-earners, and partly because men with low hourly wages are now working fewer hours per week (as highlighted above): for example, men in the second decile (tenth) of hourly wages work, on average, 5 fewer hours a week than they did 20 years ago.
The rise of part-time work among men on low hourly wages far predates the recession and is widespread. The trend has been occurring consistently for 20 years and is observed for low-wage men across the age spectrum, for single men and men in couples, and for those with and without children.
In contrast, inequality in women’s weekly pay fell. At the 10th percentile, weekly earnings rose by 60% between 1994-95 and 2014-15; at the 90th percentile they rose by 29%. This is because the proportion of women working part-time has fallen, especially among those with low hourly wages (the opposite of the trend for men).
Combining the pay of men and women who live together, inequality in total earnings across working households has risen. At the 10th percentile, household earnings rose by 20% between 1994–95 and 2014–15, while at the 90th percentile, household earnings rose by 32%. This is primarily because of the rise in male earnings inequality, since male earnings remain the largest income source for working households on average.
But trends in inequality have been different if we look at total net household incomes (including benefits and after taxes) across the whole population, rather than looking specifically at pay among working households:
Despite rising earnings inequality among working households, inequality in total net household incomes (including benefits and after taxes) across the vast majority of the population is actually lower than 20 years ago. Key reasons for this include tax credits boosting the incomes of low earners, a catch-up of pensioners with the rest of the population, and falling rates of household worklessness.
However, the top 1% have been different: their share of net total household income increased from 6% in 1994-95 to 8% in 2014-15.
Jonathan Cribb, an author of the report and a Senior Research Economist at IFS, said,
“The number of low-wage men working part time has increased sharply over the last twenty years. To understand the drivers of inequality in the UK it is vital to understand the growing association between low hourly wages and low hours of work among men.”
Chris Belfield, another author of the report and a Research Economist at IFS, said,
“In the last twenty years, the incomes of the top 1% have pulled further away from the rest. But across the vast majority of the population income inequality has actually fallen. However, in large part this is because the tax and benefit system has worked increasingly hard to offset disparities in the pay brought home by working households, and because of the catch-up of pensioners with those of working age, as well as falls in worklessness.”
Proportion of men aged 25-55 working part-time, by hourly wage level
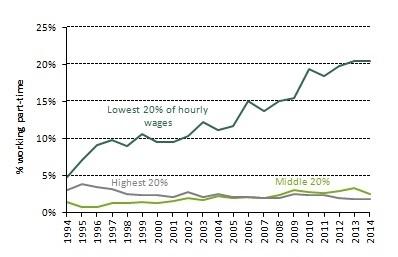
Note: ‘Part-time’ defined as working less than 30 hours a week. Sample is male employees aged 25 to 55, excluding those with hourly pay in the bottom 5% or top 5% of the overall hourly pay distribution. To be in the lowest-paid group requires being in the lowest quintile (fifth) of hourly wages: equivalent to an hourly wage of less than £7.60 in 2014-15.The middle group are the those in the third quintile of hourly wages, and the highest-paid group are those in the top quintile of hourly wages. Hours are those in main job, and include paid but not unpaid overtime. Years are financial years.
Source: Labour Force Survey.
Notes to editors
- The working paper and an accompanying executive summary is available here on the IFS website.
- Please contact Bonnie Brimstone (020 7291 4818, 07730 667013 or [email protected]) if you have any queries.
- Funding for the research from the ESRC-funded Centre for the Microeconomic Analysis of Public Policy at IFS is gratefully acknowledged ,as is support from the Joseph Rowntree Foundation (JRF), who have funded a series of projects on poverty and inequality at the IFS since 2010.
Authors

Robert Joyce
Robert is a Deputy Director. His work focuses on primarily on the labour market, income and wealth inequality, and the design of the welfare system.

Jonathan Cribb
Jonathan is an Associate Director and Head of Retirement, Savings and Ageing sector, focusing on pensions, savings and later-life economic activity.

Andrew Hood
Chris Belfield
More from IFS
Understand this issue


Policy analysis


Academic research


