Gordon Brown's eighth Budget signalled that Labour will go into the next election offering voters a rising tax burden and much slower growth in public spending than we have seen in recent years. Not necessarily what the spin-doctor ordered. The Chancellor hopes to sweeten the pill by identifying 7.5% of efficiency savings from departmental spending by 2007-08, to keep the growth in spending on service delivery in line with recent trends. He demonstrated his intent by announcing a plan to cut a net 40,500 jobs from the tax collection and work & pensions departments.
Although the public finances are in good shape by international standards, Mr Brown needs to restrain spending and collect more tax to reduce government borrowing and thereby stick to his fiscal rules. Borrowing is significantly higher now than the Chancellor forecast a year ago, even though the economy has grown as strongly as he expected.
Setting out the envelope for this summer's Spending Review, Mr Brown announced that total public spending would rise by an average of 2.7% a year in real terms in 2006-07 and 2007-08, probably the first two full years of the next parliament. This is markedly lower than the average real increase of around 4% a year seen since April 1999.
Public sector investment and spending on the NHS and education will both grow more quickly than spending overall, squeezing other Whitehall budgets. On our estimates, total spending outside that on the NHS and education is set to rise by only 1.4% a year in real terms over the same two years - falling as a share of national income. This includes spending on defence, law & order and transport, although the Chancellor promised that spending in these three areas would continue to grow in real terms.
Following the decline Labour chose to inherit from the Conservatives, public spending overall has risen from 37.4% of national income in 1999-2000 to 41.2% in the financial year just ending. Over the next four years it is planned to increase much more modestly, to 42.2% of national income, with non-investment spending virtually static.
To meet the fiscal rules and pay for the increase in spending we have already seen, Mr Brown wants to see current receipts (mostly tax revenues) rising from 37.8% of national income this year to 40.5% in 2008-09, the highest level since the boom of the late 1980s. This relies in part on revenues generated by a more buoyant financial sector and also on "fiscal drag", as real earnings growth pushes more people into higher tax brackets.
The specific measures announced in the Budget will do little to affect the path of the public finances over the next few years. The Chancellor's eye-catching ñ00 payment for all households containing someone 70 or over will cost ô75m in 2004-05, but - for now at least - this expense will last for only one year.
Over the longer term, he has had to find òbn to put in his reserve for unexpected spending needs. In effect he has recouped some of this with a package of anti-tax avoidance measures and a new 19% minimum corporation tax rate on distributed profits. The Chancellor's revenue projections are also slightly higher than those in the Pre-Budget Report because of forecasting changes: a reasonable but less cautious assessment of prospective VAT revenues, the impact of higher share prices on receipts from corporation tax, stamp duty and capital taxes, and higher consumer spending.
The Chancellor's golden rule says the government should only borrow to invest and that other spending should therefore be covered by tax revenue over the ups and downs of the economic cycle. This means the current budget balance - tax revenues minus non-investment spending - should be in balance or surplus.
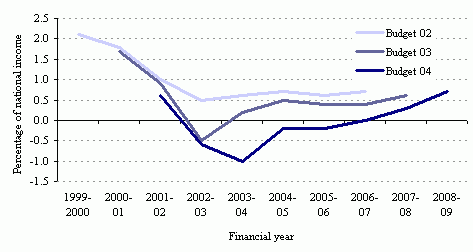
The Chancellor forecasts that the current budget will move from a deficit of 1.9% of national income in 2003-04 to a surplus of 0.7% of national income in 2008-09. This implies that he would meet the rule over the current economic cycle (which runs from 1999-2000 to 2005-06) with an average surplus of just 0.1% of national income to spare. This is equivalent to just over øbn - a smaller amount than the ñ4bn he predicted just three months ago. With two years of the cycle still to go, this leaves little margin for error.
Indeed, on the method the Chancellor used in assessing whether the golden rule would be achieved in last year's Budget speech - adding together the cash values of the surpluses and deficits over the cycle - his forecasts now imply that he would be on course to break the rule by ñ.1bn. The measure the government currently focuses on gives greater weight to a pound of surplus at the beginning of the cycle than to a pound of deficit at the end.
Mr Brown has insisted he will meet the golden rule over this period and it would be a blow to his credibility if he did not. But more important in assessing the long-term health of the public finances is to ask whether his spending plans and tax decisions are consistent with meeting the rule looking forward. We can get a snapshot by asking what path the current budget would take if you removed the impact of the economic cycle.
Mr Brown believes that national output is running around 1.4% below its trend level and that the economy can therefore sustain two years of above-trend growth as the slack is used up. This would help to shrink the deficit by increasing tax revenues and restraining social security spending.
Adjusting for this cyclical effect, Mr Brown predicts that the underlying current budget balance will improve from a deficit of 1% of national income this year to a surplus of 0.7% in 2008-09. This is a slightly larger swing into the black than Mr Brown was expecting in December.
But it remains doubtful whether the bounce-back in revenues - above and beyond any bounce-back in the economy - will be large enough to turn the public finances around in quite this dramatic a fashion. If not, to maintain the credibility of his rules Mr Brown may find himself having to announce further measures to bring about the increase in the tax burden he needs. Whether he would do so before an election remains to be seen.
Figure 1. Predictions of the cyclically adjusted current budget balance from 1999-2000 to the end of the forecasting period, taken from recent Budgets

Source: HM Treasury, various Budgets.
Public Spending
On the public spending front, the Budget announced small increases in the spending totals that were pencilled in for 2006-07 and 2007-08. These totals will be allocated among departments in this summer\'s spending review. However, the Chancellor has already committed himself to both substantial real increases in spending on the NHS until 2007-08 and an increase in net investment to 2ܥ of national income by the same year. In addition, he pre-announced his spending plans for education in 2006-07 and 2007-08. These promises will limit considerably the amount that is available for spending on other areas.
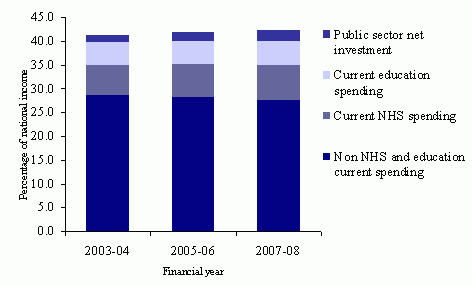
Figure 2, below, illustrates that total public spending will rise between this year and the end of the 2004 Spending Review period from 41.2% of national income to 42.2%. Within this total the following changes will occur:
- The composition will shift in favour of spending on the NHS and education. These two areas will increase their share of national income from about 6.7% and 5.3% respectively this year, to 8.0% and 5.6% by 2007-08.
- Spending on other departments and functions will therefore decline from 29.1% to 28.6%. This still represents a real terms increase of 2.3% per year on average as national income grows in real terms. It is from within this increase that the Chancellor will allocate spending on remaining departments and functions.
- There will also be a shift away from current spending towards investment spending. Some of this increase in investment spending will be on NHS or education investment, so this corresponds to an overall shift in favour of current spending on the NHS and education, and on public sector net investment. Assuming that the spilt between current and capital spending on the NHS and education in the UK mirrors the split that the Chancellor announced for the totals for England, current NHS and education and overall investment will increase their share of national income from about 12.5% this year to 14.6% in 2007-08.
- Based on the same assumptions about the current capital split for the NHS and education, other current spending, both that within Departmental Expenditure Limits and that planned on an annual basis, will decline from 28.6% to 27.6% over the same period.
The growth rates in non-NHS, non-education and non-investment areas are relatively low compared both to spending growth during the 2002 Spending Review period and to expected real growth in national income during 2006-07 and 2007-08. They will grow at an average annual real rate of 1.4%, corresponding to a fall as a percentage of national income. Within this total the Chancellor has committed himself to increasing spending on defence, the home office and transport in real terms and to increase spending in housing, local government, children and the elderly in nominal terms. This could constrain the allocations to remaining departments.
Figure 2. Budget 2004's planned public spending as a share of national income, by component, 2003-04 compared with 2005-06 and 2007-08

Notes: The calculations made to produce this graph assume that the ratio of capital to current spending on the NHS and education across the whole UK will be the same in future years as the ratio of spending on the NHS and education in England alone.
Source: HM Treasury, Spending Review 2002 and Budget 2004.
The Chancellor will have a difficult job this summer reconciling the squeeze in non-NHS and education current spending with his policy aspirations and priorities. The biggest remaining spending areas are social security benefits, transport, defence and law and order. He has already made commitments on most of these areas and social security benefits are not a tempting target for spending cuts for a Chancellor who aims to eliminate both child and pensioner poverty.
Both of the main opposition parties had already outlined their public spending stances and priorities in advance of the Budget. Figure 3 shows how their proposals for total public spending compare to the Chancellor's public spending record since 1997 and his plans until 2007-08.
The Liberal Democrats have broadly endorsed Mr Brown's planned public spending totals for the next few years. Thereafter they have argued that over the medium term public spending should not change as a share of national income. However, within those totals, they would like to reshuffle spending, diverting at least 1% of Total Managed Expenditure a year away from areas they consider less beneficial to their five policy priorities. Sources of cuts include the abolition of the child trust fund, mergers and abolitions of eight government departments, privatisation of some nationally owned corporations and the relocation of civil servants to areas outside London. Mr Brown will, presumably, indicate this summer the extent to which he wants to reallocate spending in a similar fashion. The Liberal Democrats also propose to spend an extra óbn on replacing tuition fees and providing free personal care to the elderly. These would be paid for by a higher tax on incomes above £100,000.
Figure 3. The three main parties' projected paths for public spending in the next Parliament

Source: HM Treasury, various Budgets, and the Conservative and Liberal Democrat parties.
The Conservatives, by contrast, want to reduce the size of public spending relative to national income so that it has returned by 2011-12 from 41.9% of national income back to the 39.9% it accounted for in 2002-03. Within this smaller total, they want to spend liberally on the NHS and schools. So the Conservatives' plans imply a more significant change in the composition of public spending - and bigger cuts in other (as yet unspecified) departmental budgets. The large areas of spending that have not been protected include higher education, transport, law and order and defence.
If our forecasts for the public finances prove to be correct, and if the Chancellor after the next election wants to continue to expect to meet the golden rule in the future, then a Labour or Liberal Democrat chancellor would probably have to announce fresh tax increases. A Conservative Chancellor, by contrast, might be able to avoid having to announce any further tax increases - the planned increase in the tax burden between now and the middle of the next parliament would be sufficient to finance their spending plans. But the price of avoiding new taxes would be having to make even tougher spending decisions than those Mr Brown now faces in the Spending Review.
Distributional Analysis
The pre-announced budget changes, which included the earnings indexation of both the Pension Credit and pensioner tax allowances, were mildly progessive. However, the absolute magnitude of these changes upon the distribution of incomes were small. The poorest decile group gained by 1.3%, with the second and third decile groups gaining by 0.7% and 0.4% respectively. Across the entire income distribution, these changes averaged at just 0.2%. The impact of changes by decile is shown in Figure 1.
Figure 4: % change in disposable income per week
Family type | New | Pre-announced |
Poorest | 0.40 | 1.30 |
Decile 2 | 0.20 | 1.10 |
Decile 3 | 0.20 | 0.70 |
Decile 4 | 0.20 | 0.40 |
Decile 5 | 0.10 | 0.20 |
Decile 6 | 0.10 | 0.10 |
Decile 7 | 0.10 | 0.00 |
Decile 8 | 0.00 | 0.00 |
Decile 9 | 0.00 | 0.00 |
Richest | 0.00 | 0.00 |
Total | 0.10 | 0.20 |
Note:To see the amount of disposable income someone would need to be in a certain decile, download decile points spreadsheet.
Very few of the new announcments in Gordon Brown\'s eighth budget will impact upon the distribution of household disposable incomes.
While the duties on beer, bottled wine and cigarettes all rose in line with inflation, there were freezes for spirits, sparkling wine and cider. These freezes correspond to real decreases, so that households who consume these products, will be gaining in real terms. However, the gains for such groups are small relative to their incomes, so that the effect of these upon the income distribution is negligble.
At an estimated cost of ô75 million to the exchequer, the Chancellor announced a one off payment of ñ00 for households containing at least one pensioner aged 70 or over. Single pensioners gain by an average of 0.6% this year, while pensioner couples gain by 0.3%. These gains are spread across the income distribution, and are slightly more concentrated in the poorer decile groups. The impact by changes by family type is shown in Figure 2. The cost of this change is around two-thirds of the estimated value of council tax benefit that pensioners fail to claim.
Figure 5: % change in disposable income per week
Family type | New | Pre-announced |
Single unemployed | 0.10 | 0.10 |
Single employed | 0.00 | 0.00 |
Single parent family | 0.00 | 1.40 |
NE couple w/o kids | 0.10 | 0.10 |
NE couple with kids | 0.00 | 1.60 |
SE couple w/o kids | 0.00 | 0.00 |
SE couple with kids | 0.00 | 0.40 |
TE couple w/o kids | 0.00 | 0.00 |
TE couple with kids | 0.00 | 0.10 |
Single pensioner | 0.60 | 0.40 |
Couple pensioner | 0.30 | 0.20 |
Total | 0.10 | 0.20 |
Note: NE = no earners; SE = single earner; TE = two earners.
| Ends |
Notes to editors
- A briefing covering our Budget analysis will be held at IFS on Thursday 18th march at 1pm. Please contact Bonnie Brimstone if you would like to come.
- A spreadsheet with the figures from the two tables above can be downloaded here.
- 3. The estimated take-up of Council Tax Benefit amongst pensioners in 2001/02 was 60%, with around £680m of support unclaimed.


