Key findings
- The global growth outlook has deteriorated. Having grown by an above-average 3.2% in 2018, world output growth looks set to fall to a below-average 2.8% in 2019 and stay there in 2020. The downturn is spread across advanced economies and emerging markets, but focused on the manufacturing hubs so far.
- China’s rebalancing hurts its supply chains. Export- and investment-led growth allowed China to become the world’s second economy, but reached financial and environmental limits. The inevitable shift towards domestic consumption and innovation slows growth in China and its supply chains, including Germany and Japan.
- US trade wars compound China’s troubles and sow uncertainty. US President Donald Trump’s administration is imposing tariffs, hurting exports in the targeted economies and raising prices at home. More importantly, business investment suffers globally as uncertainty about supply chains spreads.
- In the medium term, we forecast that US growth will remain strong, China’s growth rate will slow, and parts of Europe will flirt with recession. While global trade and manufacturing are in recession, domestic demand remains resilient. The US still enjoys large fiscal stimulus, but as the boost from this winds down its growth rate will slow to potential soon. Chinese growth is falling gradually. In Europe, Germany and Italy are close to recession, but France and Spain are more resilient.
1.1 Introduction
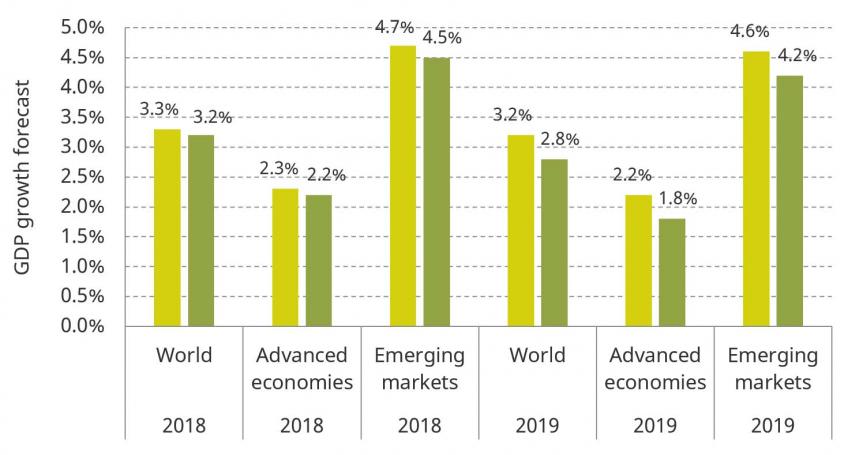
The phase of synchronised growth the world enjoyed in 2017 and early 2018 has come to an end. Following two years when the global economy finally expanded faster than its long-run average of 3.0%, growth looks set to slow to 2.8% in 2019. That is a significant disappointment compared with our expectations a year ago in the 2018 Green Budget, where we had expected 2018 global growth in the economy (gross domestic product, GDP) of 3.3%, followed by 3.2% in 2019.
As Figure 1.1 shows, the disappointment has come in equal measure from advanced economies (AE) and emerging markets (EM). A year ago, we expected stable above-average AE GDP growth of 2.2% in 2019, followed by a return to trend levels mainly as the impact of the fiscal stimulus in the US was expected to fade. Emerging markets were expected to expand at a steady rate of 4.7% in 2018, 4.6% in 2019, rising to 4.9% in 2020. According to the latest data, EM expanded by only 4.5% in 2018, are on course to experience a slowdown to around 4.2% this year and are expected to return to only 4.5% next year – and even that is subject to downside risks.
Figure 1.1. GDP growth forecasts in Green Budget 2018 versus latest actual and projections, 2018 and 2019
Source: IFS Green Budget 2018 and Citigroup Global Economic Outlook and Strategy (July 2019).
While idiosyncratic developments played a role in the slowdown in some economies (especially in emerging markets such as Turkey and Argentina), in our view the key drivers of the downturn are China’s rebalancing and US trade wars.
The global downturn has also changed the policy narrative again. After years of gradual ‘normalisation’, with fading asset purchases and rising interest rates, central banks are cutting interest rates again; on 18 September, the US Federal Bank cut its key interest rate by 25 basis points (0.25 percentage points), only the second cut since 2008. And because government borrowing costs are so low at the moment and the effectiveness of yet more central bank intervention to combat an economic downturn is in doubt, fiscal policy trends could also move to a more expansionary setting.
In this chapter, we set out the factors driving this across-the-board downgrade to growth prospects. Section 1.2 outlines the influence of two big forces buffeting the global economy: a slowdown in the Chinese economy as it weathers the disruption caused by rebalancing towards a consumption-led model for growth, and the trade wars the US has started with China and the rest of the world. We also discuss the role of fiscal and monetary policy in addressing this slowdown. Section 1.3 presents our forecasts for the US, China and the eurozone for the next three years. Finally, Section 1.4 concludes.
1.2 Drivers of the global slowdown
China’s rebalancing
Since the 1980s, China has grown by leaps and bounds to become the world’s second-largest economy and one of its largest trading blocs. For decades, this growth model was based on low labour and other factor costs, as well as rapid investment and export growth. Growth was funded by many years of household saving rates of close to 40% of disposable income, compared with around 10% or less in most advanced economies, which depressed private consumption below its potential. This allowed China to fund a credit boom without having to import capital and run a current account deficit. However, it leaves household savings exposed to a potentially fragile financial system, and probably drives further precautionary household saving to offset the risks.
While successful in delivering growth, this model had many side effects, including a large credit expansion, spiralling real estate prices and environmental pollution. Chinese non-financial sector debt rose from 150% of GDP at the time of the global financial crisis to 250% of GDP in 2016, a level at which advanced economies with arguably more sophisticated macro-prudential oversight such as the UK and the US succumbed to financial crises (see Figure 1.2). Chinese debt is not far below the levels at which the Spanish banking crisis in 2011–12 erupted, and is much higher than the debt levels that contributed to the Asian crisis in 1997 – for example, in Thailand.
As the economy matures and the gains to be had with the old growth model are increasingly outweighed by their negative side effects, Chinese authorities decided to begin rebalancing away from investment and exports and towards domestic consumption and innovation. Part of this process was curbing credit growth and some of the excess in the financial system – for example, by reining in the shadow banking system – as well as reducing environmental pollution. These policies should yield some results – for example, by stabilising China’s non-financial debt ratio (see Figure 1.2).
Rebalancing any economy often comes at a short-term cost. Depending on the size of the imbalances that need correcting and the pace of adjustment, domestic demand can suffer for a few years. Such reforms are thus most easily done during a period of strong external demand. Hence, the start of China’s rebalancing process conveniently fell into the globally synchronised upswing of 2017. While much of the official economic growth data remained steady, some more specific indicators such as purchasing managers’ indices (PMIs, which survey companies’ purchasing managers about their activity, including new orders, factory output, supplier delivery times, prices and employment) or the Li Keqiang Index (which combines measures of electricity consumption, railway freight and loans growth) peaked and have since started to decline.
Figure 1.2. Credit to the non-financial sector from all sectors in selected countries

Source: Bank for International Settlements and Citi Research.
Figure 1.3. The Ifo manufacturing index (Germany) and year-on-year growth in the Li Keqiang Index (China)

Note: The Li Keqiang Index measures electricity consumption, railway freight and loans growth in China and so provides an indicator of economic growth. The Ifo manufacturing index is a leading indicator for economic activity in Germany. The figure plots the Ifo index over time against the annual growth rate of the Li Keqiang Index from six months earlier.
Source: Ifo Institute, Bloomberg and Citi Research.
Figure 1.4. Year-on-year growth in industrial orders in the US, Germany and Japan

Source: US Census Bureau, Germany Destatis, Japan Machine Tool Builders’ Association and Citi Research.
For some time, China’s domestic slowdown went more or less unnoticed. However, the world economy has become so dependent on China as a source of demand growth that by later in 2017, the Chinese slowdown started to leave a mark on global manufacturing powerhouses such as Japan and Germany.
This reflects the already-big and growing importance of China to other manufacturers’ economies. For example, China is not only the largest single-country trading partner for Germany, accounting for 7% of its exports; it has also been the fastest-growing one. In the 2000s, China accounted for about 2% of German exports. This share has since quadrupled, so companies may well extrapolate that China will account for more than 10% of their external sales on average in the next cycle, even accounting for slower growth rates.
That means China matters more than stable large markets such as the US and Europe when companies plan new investment into additional capacities, and thus weighs significantly in manufacturing sentiment. In fact, as Figure 1.3 shows, Germany’s Ifo manufacturing index seems to echo turns in Chinese growth momentum reliably, with a six-month lag. From Japan, Germany and others, the downturn then also spread to the manufacturing sectors in other economies, including the US (see factory orders in Figure 1.4).
Since the US administration started announcing and imposing tariffs on Chinese exports from January 2018 (starting with washing machines and solar panels) onwards, China’s economy has been experiencing an additional downward draught. In response, Chinese authorities tried to provide monetary and fiscal stimulus, but perhaps not as decisively as in previous downturns due to the financial stability constraints posed by the rebalancing. In particular, Chinese authorities had to contend with rising US interest rates and a strengthening US dollar, which put strain on China’s capital account. Most Chinese growth data suggest that the slowdown is continuing and thus continues to weigh on global manufacturing.
US trade wars
Rebalancing the US external trade account was one of US President Donald Trump’s key pledges during the 2016 election campaign and one of his priorities when he took office in 2017. The new administration swiftly began by reopening existing trade deals, such as NAFTA (with Canada and Mexico) and KORUS (with South Korea), in 2018.
The administration also began introducing trade barriers, starting with tariffs on Chinese solar panels and washing machines in January 2018. On 1 March 2018, Trump announced 25% extra tariffs on all steel imports and 10% on aluminium imports (from around the world) under the pretext of national security concerns (USTR section 232) and later in the month tariffs on $50 billion worth of annual imports from China (USTR section 302). That opening salvo quickly triggered retaliatory tariffs, in particular from China and the EU, which then started a tit-for-tat escalation to a multi-front US trade war. By July 2018, President Trump had announced 25% tariffs on an additional $200 billion worth of Chinese imports and – despite some delays and negotiation tactics – is currently on track to have imposed at least 15% tariffs on almost all of China’s more than $500 billion worth of annual exports to the US by the end of 2019.
In May 2018, the Trump administration also started the process of imposing penalty tariffs on car imports. As Figure 1.5 shows, this would hit European economies hard – Germany, the UK and – as a share of GDP – Slovakia would be especially affected. The EU got at least a temporary reprieve in July 2018, when President Trump agreed with EU Commission President Jean-Claude Juncker to suspend any new announcements of tariffs while the two sides negotiated a relatively narrow agreement on non-auto industrial goods and regulatory cooperation. However, no progress has been made since then as the talks have stalled over debates on their scope: the US wants to include agricultural goods in the talks, while the EU wants to also include cars. President Trump effectively delayed the imposition of car tariffs to November 2019.
Increased protectionist measures on such a scale clearly depress global trade growth and thus demand and output across the world. However, the current unprecedented scale and scope of US trade wars has consequences well beyond their direct impact on global trade – namely, their impact on economic sentiment. The global manufacturing PMI has plunged from a cyclical peak of 54.5 in December 2017 to 49.5 in August 2019, below the 50.0 mark which separates expansion from contraction. The hit to business sentiment resulting from the Sino-US trade conflict is likely particularly large for three reasons:
- The scale of the bilateral economic relationship. The importance of the US and Chinese economies both to each other and to the global economy as a whole essentially means no economy in the world is isolated from the trade wars, since all likely have some exposure either to flows of goods and services between the two economies directly or to the economies themselves (or both).
Figure 1.5. Car exports to the US (€ billion and % of GDP), 2018

Note: Major car producers in the eurozone plus UK and Sweden.
Source: Eurostat and Citi Research.
- The nature of the strategic conflict between the two countries. The US has branded China a ‘strategic competitor’, meaning that – rather than reflecting a specific issue of economic policy – it takes broader issue with China’s growth and development, likely making the subsequent conflict difficult to reconcile. Couching the conflict in geopolitical terms also increases the risk that the economic conflict spreads beyond trade into other areas, including finance. This increases the risk of further escalation, via both intensification in existing areas and extension to new ones, depressing domestic and cross-border investment1.
- The explicit rejection of past multilateral norms by the Trump administration increases the risk that such actions are extended to other regions and countries, including Europe. The US has traditionally played a particularly essential, central, role in these global economic institutions (such as the World Trade Organisation and the Paris Climate Accord) which Europe and its trade rely on. Its withdrawal may also reduce confidence among third countries in their dealings with one another, especially given the disruptive trends in national politics in several global regions.
As a result, escalations in Sino-US trade conflicts have had a particularly severe impact on global economic uncertainty. Recent measures suggest a synchronised increase in uncertainty across the advanced economies in recent months. The Global Economic Policy Uncertainty Index, which tracks the coverage of policy uncertainty in selected newspapers in 20 countries, reached all-time highs (see Figure 1.6).
As a result, across the G7, business confidence has fallen sharply since 2017; levels now – for example, on the purchasing manager indices – appear to be at their lowest since the European sovereign debt crisis aftermath in 2013. This has had – as one would expect – a detrimental effect on business investment. Across the G7, as business sentiment has deteriorated, the average weight of gross fixed capital formation in growth has declined, reversing the growth seen in 2016–17.
Figure 1.6. Global Economic Policy Uncertainty Index

Note: The Global Economic Policy Uncertainty Index measures the coverage of policy rated uncertainty in selected newspapers in 20 countries.
Source: Economic Policy Uncertainty and Citi Research.
For Europe and the UK specifically, US trade wars present two major downside forces:
- The direct confrontation over steel and potentially cars is already hitting manufacturers and their supply chains. Car tariffs could shave up to 0.3% off EU GDP over a year or two, with the effect on the UK equal to the EU average and the impact on Germany above it. If this morphs into a broader conflict similar to the US trade war with China, the impact would grow. In 2018, eurozone and UK goods exports to the US were worth 2.8% and 2.3% of GDP, respectively, according to IMF Direction of Trade data.
- The collateral damage of the US–China trade war is already harming European economies, including the UK’s. China has become the single largest trading partner for important European economies such as Germany and – more importantly – has been by far the largest source of external demand growth over the last two decades. Slowing Chinese economic growth associated with the trade war is likely reducing demand for EU exports. In addition, some of the value added exported by the EU to the US is also via Chinese exports (1.2% of the total value added exported by the UK to the US is via Chinese exports according to 2015 OECD data, 2.8% for Germany). This is more directly affected by increased tariffs. Finally, European companies export to the US directly from China. That is becoming less competitive and thus weighing on these companies’ cash flows and their capacity to invest, including in their home markets.
On the other hand, the trade wars also present one major opportunity for Europe and the UK specifically: trade diversion from US trade wars can benefit European companies. For example, European competitors to Chinese companies can benefit in US markets and European rivals to US companies have a relative advantage in China now. That could be a lasting advantage, even if future US administrations return to more conventional trade policies. In addition, US trade tactics may already have made the EU a relatively more attractive partner for free trade agreements, as witnessed by recent trade agreements with Canada, Japan, Singapore and, most recently, potentially Mercosur (whose full members are Argentina, Paraguay and Uruguay).
The prospect of the US stopping its trade wars is declining as the country heads into the 2020 presidential elections. A US–China trade deal is no longer our base scenario before the election. Pew polls suggest that American voters have an unfavourable opinion of China and, since even the opposition Democrats have issues with trade in general and Chinese competitive practices specifically, President Trump is unlikely to see much pushback from Congress on his current policies towards China. Even if a veneer of a deal did emerge before then – for example, because President Trump’s re-election prospects decline – the level of uncertainty would remain high across global trade links and supply chains. This uncertainty could push the global economy into recession as defined by real growth rates below 2%.
Sea change: central banks pivoting, fiscal policy too?
The shift from globally synchronised growth in 2017 and 2018 to a broadening slowdown in 2019 has also triggered a marked shift in the outlook for monetary policy and, by extension, for global financial markets. For several years, central banks began to ‘normalise’ policy. The European Central Bank (ECB) phased out its asset purchase programme, the Bank of England raised interest rates twice (albeit to a peak of just 0.75%) and the Fed even got its main policy rate to 2.5% in late 2018. However, financial markets appeared to think that the Fed in particular had gone too far. There was a sell-off in the equity market in late 2018, while the yield curve inverted as longer-term interest rates fell below short-term ones (a rare occurrence which often predicts imminent recession).
The Fed and the ECB quickly changed their tone as signs of an economic slowdown became undeniable. The Fed cut interest rates in July and September (so that they now stand at 1.75–2.0%), while the ECB announced a package of a 10 basis point (bp) policy rate cut to –0.5% and open-ended asset purchases of €20 billion per month in September. Other central banks across the world also cut interest rates. The Bank of England has not followed suit so far, largely because its policymakers believe that their policy rate is low enough for an economy with a tight labour market and rising wage growth that does not appear to be matched by rising productivity growth. The threat of a supply-side shock following departure from the EU may also warrant keeping the powder dry for the time being.
Most central banks have only limited policy space, i.e. they are not far away from the effective lower bound for their conventional policy tools. A deeper downturn could, given already low long-run borrowing rates, easily exhaust even the set of unconventional tools, such as quantitative easing, that they have used in recent years. In addition, policymakers are increasingly concerned by the potential side effects of these unconventional tools, such as financial markets that worry more about central bank intervention than the fundamentals of the assets they are buying or the side effects of negative interest rates on bank profitability and households’ saving behaviour. Some central bankers may also worry about the distributional effects of their policy tools.
Limited policy space for central banks has in many cases led to a renewed call for more fiscal support, in particular in the direction of current account and fiscal surplus countries such as Germany and the Netherlands. The experience of the US with the large-scale tax cuts and spending increases under President Trump highlights that stimulus can be effective in providing at least a short-term growth boost, even with already high public debt levels (and even in the context of an economy operating at around its potential level). Low borrowing costs create fiscal space, in particular in those countries with the soundest public finances such as Germany or the Netherlands. In the UK and in Italy (whose fiscal position is weaker), proposals for tax cuts and spending increases abound across the political spectrum. While fiscal easing may be fading in the US in the election year 2020, next year could be the beginning of a trend towards looser fiscal policy and higher government borrowing in Europe.
Whether central banks and governments will be successful in extending the cycle or only delay and perhaps worsen the inevitable reckoning will depend in part on the choice of fiscal tools. Allowing automatic stabilisers to work, for example, would already be of some help. Discretionary fiscal stimulus has a more mixed record and can have a delayed effect; this applies particularly to public investment when there are no ‘shovel-ready’ projects. But public investment can have a positive impact, if surplus countries contribute to a more structural rebalancing in the global economy.
1.3 Economic outlook by region
United States
Thanks to the growth-stimulating measures adopted since 2017 and despite the intermittent monetary tightening by the Federal Reserve, the US remained a relative growth outperformer among advanced economies until the first half of this year. After growing at 2.9% in 2018, we expect real GDP to advance at a still well-above-potential 2.6% year-on-year in 2019. Transitory drag from the government shutdown, tighter financial conditions and delayed tax returns (due to the government shutdown) caused consumption to slow between December and February before accelerating in recent months. We expect near-term US growth to remain above potential for the rest of the year. However, going forwards, the effect of last year’s tax cuts and spending increases will fade (see Figure 1.7) and the deterioration of global growth will creep into US momentum by putting downwards pressure on exports. In the election year 2020, the economy will probably revert to its potential GDP growth rate of around 2% or slightly below as the fiscal stimulus unwinds further.
Figure 1.7. Estimates of real GDP growth and the impact of fiscal measures

Note: BBA = Bipartisan Budget Act 2018, which brought forward significant government spending from 2020 to 2019.
Assumptions
Final $1.5 trillion tax cut. Trump administration tax cuts remain in effect: cuts to personal income tax (leaving rates at 10%, 12%, 22%, 24%, 32%, 35% and 37%); larger standard deduction and fewer itemised deductions; corporate tax cut remains in effect (21%); income deductions for pass-through entities (20%); immediate investment expensing; repatriation and territorial tax. Obamacare individual mandate repealed. More spending on discretionary defence, veterans and infrastructure; less spending on discretionary non-defence items; hurricane relief from 2017 storms; discretionary budget caps by combined $300 billion in financial years 2018–19 and 2019–20.
Source: Congressional Budget Office and Citi Research ‘Buy now, pay later – fiscal policy outlook for 2019 & beyond’, 6 December 2018.
While growth in the US remains robust, the composition of growth has changed since the start of 2019. Business equipment investment slowed in the first quarter (Q1), which is likely to persist as manufacturers work off an inventory overhang. However, in keeping with the global trend, consumption has clearly rebounded in Q2. This, as in the UK, has been powered by strong job growth and wage growth running above inflation.
Employment growth may have slowed somewhat, but at 150,000–175,000 per month it remains well above the 75,000 per month necessary to avoid rising unemployment (average labour force growth is 120,000 per month, and the employment rate is just over 60%). Wage growth has reached a range of 3–3.5% year-on-year (YY), although it seems stuck there for the moment.
A subdued outlook for inflation means that this cash-terms wage growth will translate into real-terms earnings increases. Core inflation, as measured by the Personal Consumption Expenditure Price Index, is projected to spend the majority of the year below 2% YY, held down in part by a handful of transitory factors. Although wage growth is running above this level, stronger labour productivity growth and room for firms to compress profit margins should limit pass-through into price inflation, keeping inflation broadly at target.
So far, trade wars do not seem to have affected US headline economic growth very much and even trade with China remains generally robust. The main impact on the US economy so far appears to have been via manufacturing confidence, which Figure 1.8 shows has fallen into contraction territory on the Institute for Supply Management’s measure. This is backed up by durable goods orders falling into negative territory this spring. Sentiment in the more domestic-oriented non-manufacturing sector has so far held up better, but may come under downward pressure if the manufacturing weakness persists.
Figure 1.8. ISM manufacturing versus ISM non-manufacturing

Source: Institute for Supply Management (ISM) and Citi Research.
This risk explains why the Fed turned dovish earlier this year and cut rates by a total of 50bp from 2.5% to 2% in July and September, despite the current robust domestic economic environment. Chair Jerome Powell has consistently emphasised risks to the domestic outlook stemming from slowing global growth and rising tensions over global trade, including in his congressional testimony in July and his speech at Jackson Hole over the summer. Further rate cuts are a possibility, but not our base case at the moment.
China
A year ago, we expected Chinese GDP growth to slow from 6.9% in 2017 and 6.6% in 2018 to 6.4% in 2019 and 6.3% in 2020. Indeed, China’s GDP growth started 2019 with a 6.4% YY growth rate, but the fall in the rate of expansion to 6.2% YY in the second quarter triggered a downwards revision of our 2019 growth forecast. We therefore now expect official GDP growth to come in at 6.3%. Tighter financial and regulatory conditions due to the rebalancing of the economy and severe external headwinds from the US actions against Chinese exporters are only insufficiently counterbalanced by monetary and fiscal easing as well as the depreciation of the yuan.
Recent Chinese data have remained weak, suggesting that after a bit of a break over the summer, the easing bias of the policy stance may return. Headline fixed asset investment growth has been hovering around 6% YY (5.5% YY on average January–August 2019) since the middle of 2018, down from double-digit growth rates until 2016. In July, industrial production growth fell to 4.8% YY, the first sub-5% growth in over 15 years. And although the new focus on consumption has contained the slowdown of retail sales somewhat, their 7.5% YY growth in August this year was the lowest since 2003.
Survey data and unofficial growth data hardly paint a brighter picture. Following a temporary respite in late winter, China’s official manufacturing PMI stayed in contraction territory below 50 from May onwards. The non-manufacturing PMI, at 53.8 in August, looks more robust, but is also at the lower bound of its range over the last two years. The unofficial Caixin data paint a similar picture. And, as mentioned in Section 1.2, the Li Keqiang Index also confirms an ongoing slowdown.
China’s authorities will probably continue to do what they can to support the economy during US trade wars. The focus will be on infrastructure investment and the renovation of old urban residential communities. Monetary policy will be accommodative. However, we do not expect policymakers to drop their bias towards financial stability entirely, which limits chances for large-scale stimulus. That probably constrains how much further the yuan can depreciate, having broken through the symbolic threshold of seven per dollar in August 2019.
As a result, we expect the Chinese growth slowdown to continue, with official GDP growth likely slowing to 6.0% in 2020. Sub-6% growth rates are then likely from 2021 onwards.
Europe
In the 2018 Green Budget, we forecast eurozone GDP growth of 1.9% in 2018 and 1.7% in 2019 and 2020 each. That turned out to be too optimistic. On current data, the economy expanded by 1.8% in 2018, but for 2019 it is on track for only 1.0% growth. For 2020, our latest forecast is for growth of just 1.2%.
Figure 1.9. Year-on-year GDP growth in selected economies (actual and forecast)

Note: Dashed lines show forecasts.
Source: Eurostat and Citi Research.
The slowdown in euro-area GDP growth is almost exclusively driven by the drag from falling net exports and manufacturing output, and is concentrated in Germany and (to a lesser degree) Italy. In the case of the former, the above-mentioned dependence on China plays a great role and the exposure to US trade wars is also considerable. However, Figure 1.9 highlights a bigger slowdown in Germany than in the rest of the eurozone, and points to some home-made problems in Germany, too. That may mean Germany’s weakness lasts longer, but also that the German economy could recover by fixing these idiosyncratic problems, even without relying on a Chinese growth recovery or an end to the US trade wars.
Italy’s slowdown is partly a function of Germany’s manufacturing recession, but partly also the result of tightening financial conditions. Following the formation of a populist coalition government with strong Eurosceptic leanings and rhetoric, the spread between Italian and German government borrowing costs widened to around 300bp, punishing Italian businesses as well as the government in Rome. Lately, this divergence has subsided as the most Eurosceptic coalition partner, Lega, catapulted itself out of government this summer.
In contrast to the manufacturing recession, final domestic demand growth in the eurozone edged up this year, including business investment; service sector sentiment remains robust; and countries such as Spain and France have hardly experienced any slowdown at all between 2018 and 2019, at least so far.
In the current global environment, the euro area is being somewhat penalised for its greater openness; European manufacturing firms have arguably been more successful than US firms in developing a presence to China and other emerging markets and selling goods made in Europe there. Also, some European economies have been more successful in retaining a manufacturing base than countries such as the US. This past success means more exposure to the current global hit to manufacturing and so is now becoming a weak spot, especially for Germany.
Looking ahead, the key question for the euro area – but not just there – is whether and for how long domestic demand can be resilient to the external downturn. Fluctuations in the manufacturing cycle are not unusual. Unexpected adverse demand shocks create a capacity overhang, which then triggers the production downturn. Once capacity has been adjusted, production can rebound, often in combination with even just a small positive demand shock. However, with the unholy trinity of China’s rebalancing, US trade wars and Brexit potentially not fading any time soon, risks that the manufacturing recession spreads to the rest of the economy are growing. Mass manufacturing layoffs could reverse the downwards trend in unemployment and would depress consumer confidence. Precautionary saving could rise with the associated fall in household spending, putting the economy at risk of a downward spiral.
The risk of a self-fulfilling downward spiral highlights the need for a circuit breaker, which is normally the role of the central bank. The ECB acted on 12 September, cutting its deposit rate by 10bp to –0.5% and restarting asset purchases. However, with eurozone interest rates already so low, the effectiveness of further ECB stimulus is highly questionable.
That puts the onus of being the circuit breaker on fiscal policy. The eurozone, as a whole, does indeed have a much better fiscal position than the US and the UK. However, there is no mandate for a joint fiscal policy. On the contrary, the distribution of fiscal space is lopsided, between surplus countries such as Germany (which could run a looser fiscal policy without pushing debt to worrying levels) and the highly indebted periphery. What is more, the fall in interest rates during a downturn creates extra fiscal space for Germany, while the experience of Italy in 2018 shows that under certain circumstances, interest rates rise in a downturn in the periphery, giving a pro-cyclical fiscal shock. This is because eurozone members effectively borrow in a foreign currency and their debt is thus not risk-free. The ECB (in combination with the European Stability Mechanism via the Outright Monetary Transactions facility) can be a lender of last resort, like central banks in other economies. However, at least since the 2011/12 sovereign debt crisis, the probability that a weak member state exits the currency rises in a downturn for economic and political reasons, leading investors to demand a higher risk premium.
The fact that the current downturn in the euro area is focused on Germany raises the chances that some pro-growth measures – whether outright stimulus or pro-growth structural reforms – will be forthcoming. In an optimistic scenario, that would also lead to some fiscal coordination in the eurozone which creates fiscal space across the currency area. However, we do not expect a large-scale stimulus and are thus sceptical that the eurozone economy can return above trend growth of 1–1.25% before 2021.
1.4 Conclusion
Global economic growth has taken a turn for the worse since the Green Budget 2018. China’s rebalancing and US trade wars have triggered a global manufacturing downturn and a sharp slowdown in global trade. In particular, the new protectionist measures have triggered a degree of uncertainty which impacts the economy more than a normal mid-cycle manufacturing downturn and weighs on business investment. The slowdown has triggered new monetary policy support, but with many central banks at or close to their effective lower bounds, central banks alone may struggle to extend the cycle. Fiscal policy could play a bigger part, as indeed it does already in the US, which stands apart with still strong growth. For the time being, however, our global growth forecasts – set out in Figure 1.10 – are more subdued than they were a year ago.
Figure 1.10. Year-on-year GDP growth in selected economies (actual and forecast)

Note: Dashed lines show forecasts.
Source: National statistical offices and Citi Research.