Income tax explained
Income tax is the single most important source of revenue for the UK Treasury, accounting for about a quarter of total tax revenue.
It is levied on most forms of personal income, but each individual has a personal allowance of income that can be received tax-free, and only around three-fifths of adults have income high enough to pay income tax. Above the personal allowance, income is split into bands that are taxed at different rates. The chart below shows the rate of tax paid on an additional £1 of income at different income levels. Some powers to adjust income tax are devolved to Scotland and Wales, and income tax rates in Scotland now differ slightly from those in the rest of the UK.
Savings, dividends and pensions are taxed less heavily than ordinary income. And income from employment and self-employment is subject to National Insurance contributions as well as income tax.
What incomes attract tax?
Most income is subject to income tax, including income from employment, self-employment, private and state pensions, investments and property rental. Income from certain savings products, and many state benefits, is not subject to income tax.
Money contributed to a private pension or donated to charity can be deducted from an individual’s income for income tax purposes. For example, if an individual earns £30,000 but puts £5,000 of it into a pension, then they will only be taxed on £25,000 of income (though the income later received from the pension will be taxed at that stage). The tax treatment of private pensions is discussed in more detail below.
Income tax rates, bands and allowances
The table below shows income tax rates and thresholds in England, Wales and Northern Ireland (they are different in Scotland – see below).
Each individual has a personal allowance, which is the amount of income that they can receive tax-free. Only those with incomes in excess of the personal allowance pay income tax.
Above the personal allowance, different bands of income are taxed at different rates.
For historical tax rates, bands and allowances, see IFS Fiscal Facts.
The table above also shows the number and share of adults in each band (including Scottish taxpayers). Only around three-fifths of the adult population have incomes high enough to pay income tax. Despite being far fewer in number, higher-rate taxpayers provide more income tax revenue than basic-rate taxpayers, and additional-rate taxpayers more than higher-rate taxpayers – a reflection of the concentration of income in the hands of the better-off as well as the higher tax rates they face.
The personal allowance is gradually withdrawn from individuals with incomes over £100,000 a year, creating an effective 60% tax rate on incomes between £100,000 and £125,140. In a similar fashion, families receiving child benefit have it withdrawn when the highest-income parent’s income exceeds £50,000.
If a person’s income is below the personal allowance, they can choose to transfer 10% of the full allowance (rounded to the nearest £10) to a spouse or civil partner who is a basic-rate taxpayer.
Most income tax bands and allowances increase automatically at the start of each tax year (in April) in line with inflationInflation is the change in prices for goods and services over time.Read more (as measured by the Consumer Prices Index, CPI), unless parliament intervenes. This mitigates a phenomenon known as fiscal drag, whereby income growth pulls ever more taxpayers into higher tax bands. However, a number of new thresholds introduced since 2010 do not increase with inflationInflation is the change in prices for goods and services over time.Read more in this way: these include the £100,000 threshold at which the personal allowance starts to be withdrawn and the £50,000 threshold at which child benefit starts to be withdrawn. As a result, the number of people affected by these high effective rates of tax has grown rapidly since their introduction.
One big change to income tax in recent years was the large increase, over the 2010s, in the level of the personal allowance. In the second half of the 2010s, there was also a large rise in the higher-rate threshold, albeit following an even larger real-terms reduction earlier in the decade. However, the government changed direction in 2021. All income tax thresholds, including the personal allowance and the higher-rate threshold, will be frozen in cash terms at their 2021–22 levels up to and including 2027–28. This is forecast to result in a substantial reduction in the real-terms value of both.
Savings, investments and pensions
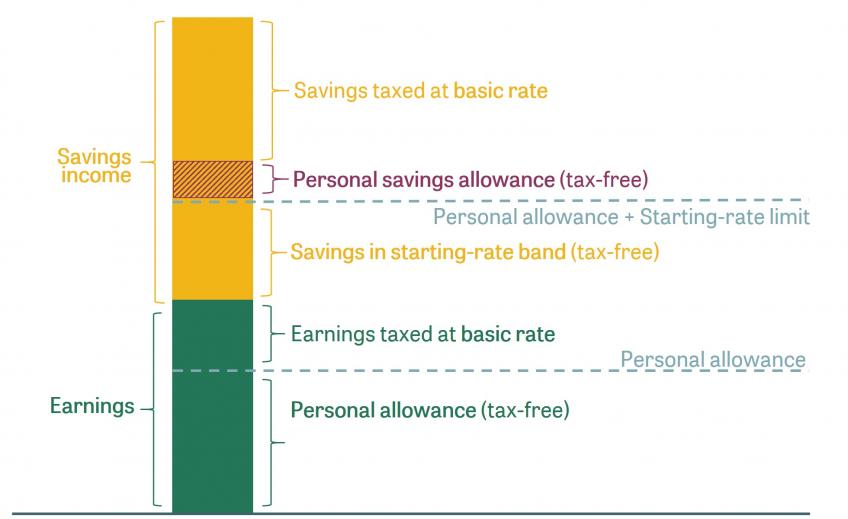
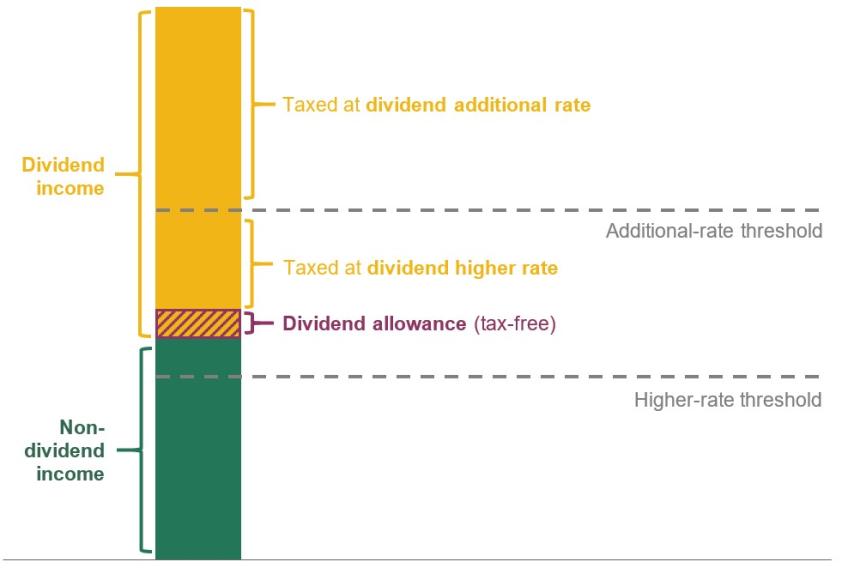
Income from savings and investments is taxed differently from other income. Income from savings and investments held in an Individual Savings Account (ISA) is completely exempt from tax. Each individual is also allowed to receive certain amounts of interest income and dividends outside ISAs free of tax. And dividends that are still subject to tax are taxed at reduced rates. When calculating which income falls into which tax band, dividends are treated as the top slice of income, followed by interest income.
Pension income is treated as (deferred) earnings for tax purposes. Broadly speaking, income that is paid into a pension is exempt from tax, income earned within the pension fund is also exempt, but money received from the pension is taxed instead (although 25% can be taken free of tax). There is an annual cap on the amount that can be saved in a pension. This cap has been reduced significantly in recent years – although it saw a (relatively modest) increase in April 2023. Prior to April 2023, there was also a lifetime cap, but this has now been abolished.
Devolution
The Scottish and Welsh parliaments both have the power to make certain changes to the rates of income tax within their jurisdictions. These powers do not apply to savings and dividend income, which continue to be taxed on a consistent basis across the UK.
So far, only the Scottish Parliament has chosen to use these powers, creating a separate system of rates and bands for Scottish taxpayers.
Administration
Most income tax is deducted from income ‘at source’ by employers and pension providers through the Pay-As-You-Earn (PAYE) system and passed on to the government by them. Only a minority of taxpayers must fill in a tax return at the end of the year.
Who pays income tax?
This section shows changes in the number of people paying any income tax and paying higher rates, sets out that income tax is progressiveA tax is progressive if tax liability increases more than in proportion to the tax base, or to income.Read more and shows how much revenue comes from different parts of the income distribution.
Only about three-fifths of adults have income high enough to pay income tax. More people than this are affected by income tax, because a higher proportion live in a family in which someone pays income tax, and a higher proportion still will pay income tax at some point in their lives. But even so, income tax reductions are poorly targeted as a way to help the poorest in society.
The charts below show that the proportion of the population paying any income tax rose steadily through most of the 1990s and 2000s but fell from the late 2000s onwards as a result of the big increases in the personal allowance (described above). The trend has reversed again in the early 2020s thanks to a cash freeze in the personal allowance, undoing the reductions seen after 2007–08. The share of adults paying higher rates of income tax, meanwhile, has risen sharply since the early 1990s and is currently increasing particularly rapidly as a result of the cash freeze to the higher-rate threshold.
The schedule of rates and allowances makes income tax progressive, meaning that people with higher incomes pay a larger share of their income in income tax. This can be seen in the following chart, which shows that the average tax rate is rising at all levels of income.
Despite being far fewer in number, higher-rate taxpayers provide more income tax revenue than basic-rate taxpayers, and additional-rate taxpayers more than higher-rate taxpayers – a reflection of the concentration of income in the hands of the better-off as well as the higher tax rates they face.
The chart below is another way to see the concentration of income tax payments among those who pay income tax. It shows, for example, that in 2023–24 the top 1% of taxpayers (that is, those with incomes exceeding £214,000) received 13% of taxpayers’ pre-tax income and provided 29% of all income tax revenue.
The chart below shows that income tax payments have become increasingly reliant on a small group of taxpayers. The top 10% of taxpayers paid 60% of all income tax in 2023–24, up from 35% in 1978–79. The share of income tax revenue contributed by the top 1% of taxpayers rose from 11% in 1978–79 to 29% in 2023–24, despite big cuts in top rates of tax in the first 10 years of that period.
The reasons for the increase have changed over time: before 2007 it was driven mainly by rising income inequality, whereas since then it has been driven more by policy choices.
Some care is needed in interpreting these figures since, as discussed above, income tax payers have been a changing proportion of the population over time. For example, during the 2010s, the proportion of adults paying income tax fell as the personal allowance rose – so the top 1% of taxpayers constituted a shrinking share of the population even as they provided a rising share of the revenue.
Income tax is not the whole story, of course. While it is by far the UK’s biggest tax, it still only accounts for a quarter of tax revenue. The next two biggest taxes, National Insurance contributions and VAT, are much less progressiveA tax is progressive if tax liability increases more than in proportion to the tax base, or to income.Read more , while some smaller taxes such as capital gains tax and inheritance tax fall even more heavily on a small group of the very well-off.

