Downloads
BN279-Household-spending-and-coronavirus-2.pdf
PDF | 311.97 KB
Many households are experiencing falls in their income as a result of the economic and health policy responses to the coronavirus crisis – often sharp falls. What they normally spend their money on will matter for how well they can weather this storm. If a household typically spends much of its budget on essential or inflexible items, it has less scope to adjust to a lower income by reducing spending without incurring relatively severe hardship. Hence it is relatively likely to run down savings, miss bill payments or go into debt. At the other extreme, if a large fraction of a household’s budget goes on the kind of social and recreational activities that are now prohibited, or on commuting, which is now unnecessary for many workers, it may require little – or even no – further adjustment to cope with a fall in income.
Figure 1 shows the average composition of household spending prior to the coronavirus crisis. We look at households where the household head is working, since we are interested in their ability to withstand income shocks. We group spending into three broad categories:
- Essential spending that is hard to adjust in the short run (coloured green): groceries, utility bills, mortgage costs (including repayments), council tax and rent. Together, these account for around 47% of total expenditure on average.
- Spending on goods and services now prohibited or discouraged due to social distancing (coloured red): travel, leisure and eating out. Together, these account for around 25% of household spending on average.
- Other spending (coloured grey): for example, clothing and shoes, and household goods. These account for around 28% of total household spending on average.
Households spend on average a quarter of their budget on goods and services that are currently being prohibited or strongly discouraged. Domestic spending on these items amounted to 15% of GDP in 2019 – or £325 billion.[1] Not all of this spending will completely stop. For example, some people still commute to work, whilst some of it may be replaced by additional spending on groceries and utilities as people spend more time, and eat more meals, at home.
Nevertheless, the large share of household spending that usually goes on these prohibited or discouraged areas is an indication of the scale of the economic shutdown currently taking place. There is a clear ‘cost’ to households of not being able to spend money on things they normally choose to spend on; spending in restaurants may be ‘non-essential’ but people spend money there because they value it. On the other hand, since many households will find that their spending falls in a fairly automatic way during the period of social distancing, some of those experiencing moderate falls in their income may feel those reductions less sorely than they would in normal times. If income recovers when more normal times return, this would make weathering the financial storm of the crisis easier, and those who do not see a reduction in income may even accumulate additional savings.
On the other hand, an even larger proportion (47%) of households’ spending goes on essential goods and services that will be difficult to adjust if their incomes fall.
Figure 1: Average share of spending on different categories for working households
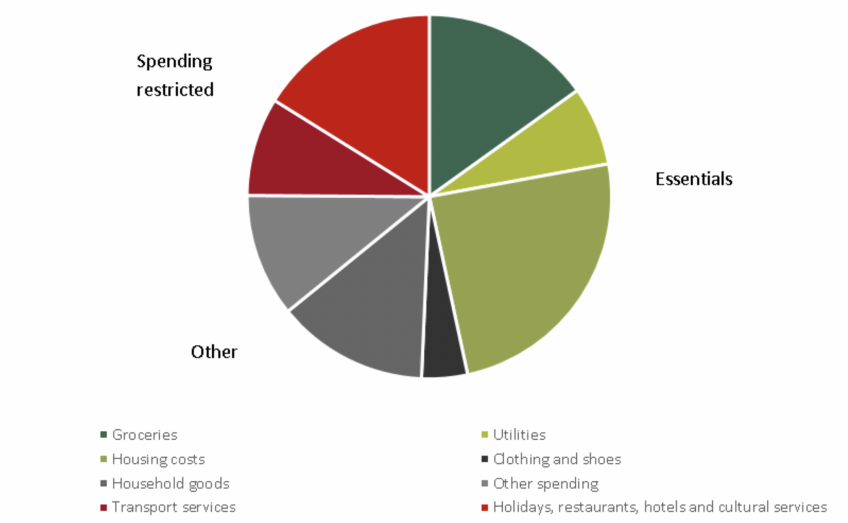
Note: Authors’ calculations using the ONS Living Costs and Food Survey, 2017. Figures are given as a share of total household spending including mortgage interest and capital costs. Calculations are restricted to households where the household head is working. All figures are weighted using LCFS survey weights. ‘Groceries’ includes food and drinks consumed at home, tobacco and personal care goods. ‘Utilities’ includes rent, maintenance, water and sewerage, gas, electricity and fuel (excluding vehicle fuel). ‘Housing costs’ includes rent, mortgage interest and capital costs, and council tax. ‘Household goods’ includes furniture, textiles, appliances, tableware, tools, vehicle purchases, personal effects, audiovisual equipment, recreational goods, personal care appliances, phone equipment and newspapers/books. ‘Other spending’ includes social protection, education, health spending, phone services, insurance, financial services and postal services. ‘Holidays, restaurants, hotels and cultural services’ also includes personal care services such as hairdressing.
Different kinds of households tend to spend very different proportions of their budgets on different items. Figure 2 shows how the average share of households’ budgets devoted to each category of spending compares for the richest and poorest fifths of households.[2] (Spending categories are grouped as in Figure 1, with ‘essential’ spending on the left and ‘discouraged’ spending on the right.)
The share of spending accounted for by ‘essentials’ is much higher for poorer households than richer households. The poorest fifth of households direct 55% of their budgets on average to essentials, compared with just 39% for the richest fifth. For the bottom fifth of the income distribution, around 9% of spending goes on utilities, 27% on housing costs and 18% on groceries. By contrast, households in the top fifth spend 6% of their budgets on utilities, 22% on housing costs and 12% on groceries. Within the category of housing costs, mortgage payments were more important for the richest households and rental payments more important for the poorest. 17% of the average budget of the richest fifth of households went towards mortgage payments, compared with 11% for the poorest. By contrast, rent accounted for 16% of the average budget of the poorest households, compared with 5% for the richest.
Figure 2: Average share of spending on different categories for the poorest and richest working households
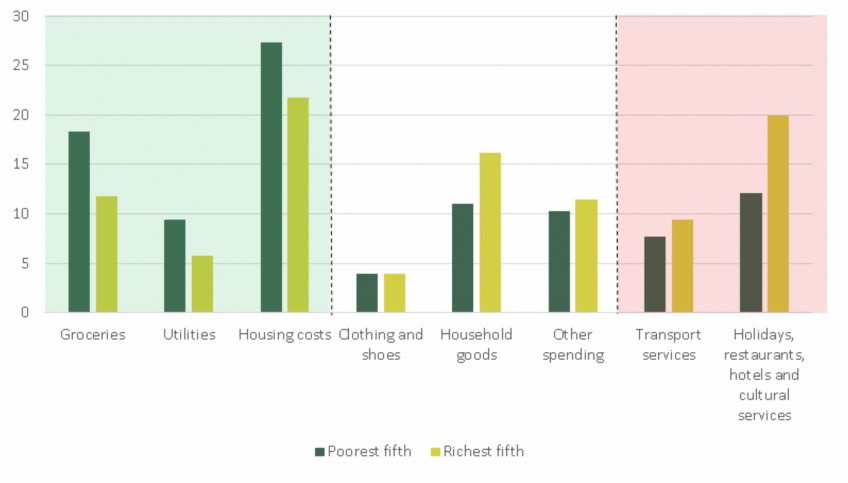
Note: Authors’ calculations using the ONS Living Costs and Food Survey, 2017. Figures are given as a share of total household spending including mortgage interest and capital costs. Calculations are restricted to households where the household head is working. All figures are weighted using LCFS survey weights. Spending categories are as defined in Figure 1. Income quintiles are defined using household income equivalised using the adjusted OECD equivalence scale.
The opposite is true in areas of spending more likely to be affected by social distancing. The richest fifth of households spend on average 29% of their budgets on these areas against just 20% for the poorest fifth on average. Much of this is due to differences in the amount the rich and poor spend on ‘experiences’ such as holidays and eating out. Around 20% of the spending of the richest households goes on these areas, compared with just 12% for the poorest households.
Of course, these are just ‘on average’. Within income groups, there is lots of variation in spending on different goods and services. Around a quarter of households in the richest fifth direct over half of spending to ‘essentials’ (compared with 60% of households in the poorest fifth). Likewise, spending on ‘experiences’ such as eating out and holidays accounts for over a quarter of total spending for around 31% of households in the poorest fifth (compared with 57% of those in the richest fifth).
However, these differences in spending patterns reiterate the point that – on average – lower-income households will tend to find it harder to weather any income shocks that the crisis will bring: a greater proportion of their spending goes towards essentials and bills that will be harder to cut if they experience income falls.
[1] Authors’ calculations from Office for National Statistics, ‘Consumer trends in the UK: October–December 2019’, 2020 and Office for National Statistics, ‘Gross domestic product at market prices: October–December 2019’, 2020. This figure is the sum of COICOP spending categories 7.2, 7.3, 9.4, 11 and 12.1.1. We include spending on category 9.6 (package holidays) in our category of spending that is prohibited and discouraged, but it is split among several categories in the National Accounts (so some of this spending may not be included in the 15% figure). This includes spending in the UK by UK-resident households as well as spending in the UK by tourists and travellers from abroad. According to the National Accounts, 23% of total household spending in the UK goes on these spending categories.
[2] We rank households by income. Ranking households by spending generates very similar results. Spending shares decline steadily between the top and bottom fifths of income, so we report only the top and bottom fifths.
Authors

Rowena Crawford

Robert Joyce
Robert is a Deputy Director. His work focuses on primarily on the labour market, income and wealth inequality, and the design of the welfare system.

Peter Levell
Peter joined in 2009. He has published several papers on the microeconomics of household spending and labour supply decisions over the life-cycle.
Alex Davenport
More from IFS
Understand this issue


Policy analysis


Academic research