
Yesterday, the International Monetary Fund (IMF) released its new medium-term forecast for the world economy and the outlook for the public finances of individual countries. We compare the situation in the UK with 36 other comparator countries1 and look at how things have changed since the turn of the century and what the outlook looks like going forward.
How have government spending and revenues evolved in the UK, compared with other countries?
As shown in Figure 1 and Figure 2 respectively, the UK’s total government spending and revenues are now closer to the average of the rest of the G7 as well as to the average of a broader set of 36 comparator countries than they were in 2001. Going forward, the UK is forecast to close the gap with the G7 average even further. This would leave government spending and revenues at historically high levels for the UK, but still a bit below the G7 average. And while we already spend the same as the average of a broader set of international peers, we will not tax the same even by 2029.
Size of the state
- Government spending in the UK was 8% of national income below the G7 average in 2001.
- It then increased comparatively faster in the 2000s under New Labour governments, reducing the gap to 3% in 2007 on the eve of the financial crisis. The financial crisis was associated with a particularly big increase in public spending in the UK, further reducing the gap to only 1.2% of national income in 2010.
- The subsequent period of austerity rolled back the size of the state – and from 2012 did so more than in other countries, widening the gap with the G7 average to 5% of national income in 2019. But again, a global crisis – this time COVID-19 – was associated with a particularly big increase in spending in the UK.
- Despite cutting the levels of spending slightly from their pandemic peak, government spending is expected to settle at a much higher level than before the pandemic. This increase is forecast to be the fourth-highest increase out of the 37 comparator countries over the period 2019–29.
- The size of the state is expected to settle at the average of the 36 other comparator countries over the medium term and around 2.4% of national income (or £66 billion in today’s terms) below the G7 average in 2029. If this materialises, the gap between the UK and the G7 average in terms of spending as a share of national income will have fallen by 5.6% of national income between 2001 and 2029. Had the size of the UK state remained as far below the G7 average as it was at the turn of the century, we would be spending around £155 billion a year less.
Figure 1. Government spending
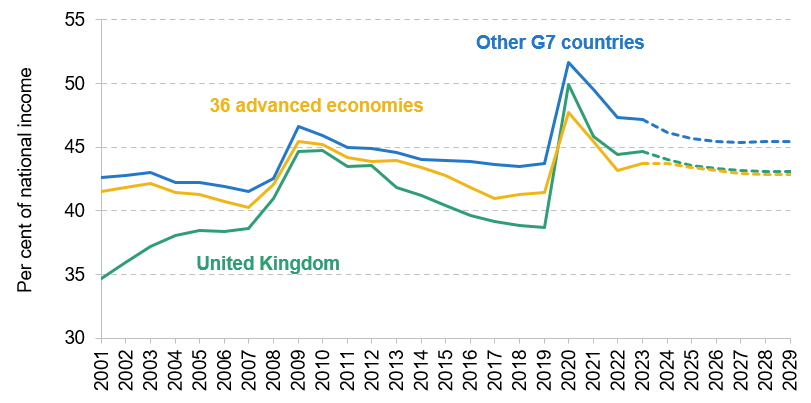
Note: Unweighted average for other countries shown.
Source: International Monetary Fund, World Economic Outlook (April 2024).
Government revenues
- From 2001 until the pandemic, the UK’s government revenues were around 5% of national income lower than the average of other countries. Over this period, they increased slightly, but at a similar rate to other countries.
- A much bigger increase has been seen over the course of this parliament. Together with current plans for the medium term, the increase in government revenues since 2019 is forecast to be the biggest among the 37 comparator countries and expected almost to halve the initial gap with the G7 average from 5.3% in 2001 to 2.8% of national income by 2029. In contrast, the average of all other comparator countries is forecast to fall slightly over the medium term and be only 1.5% of national income above the UK in 2029. This means that the UK would have to collect an extra £79 billion of revenue in today’s terms to reach the average of the G7 – or £43 billion to reach the average of the broader set of 36 countries.
Figure 2. Government revenues
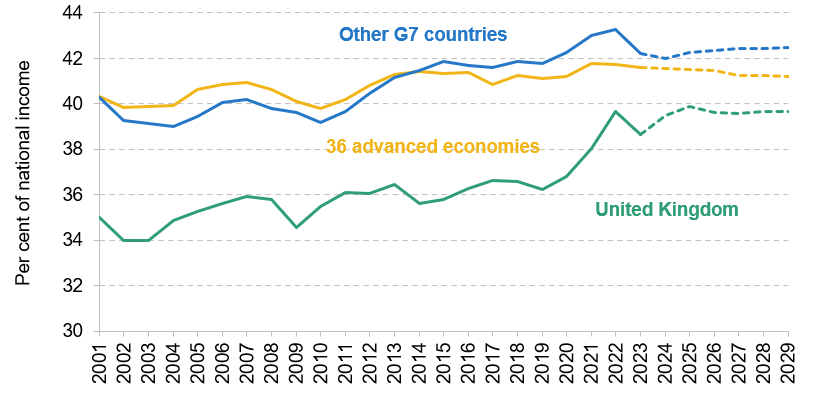
Note: Unweighted average for other countries shown.
Source: International Monetary Fund, World Economic Outlook (April 2024).
How does the UK’s borrowing and debt compare with other countries?
We have shown that the UK’s 2.5% of national income increase in revenues relative to the G7 average over the period from 2001 to 2029 would be much smaller than the 5.6% increase in spending relative to the G7 average. Put simply, our appetite to become a more average spender has not been fully matched by a willingness to become a more average taxer. This contributed to a substantial relative weakening of the public finances.
Borrowing
- The UK had its last budget surplus in 2001. At the time, this was the 11th-lowest level of borrowing out of the 37 comparator countries, and the only other surplus in the G7 alongside Canada.
- Since 2005, the UK’s deficit has been consistently among the 10 biggest deficits within the 37 comparator countries. A particularly big increase in borrowing occurred during the financial crisis, reaching 10% of national income in 2009. This was a deterioration of 7.4% of national income relative to just before the crisis in 2007 – notably higher than the 6% deterioration among the 36 comparator countries.
- Due to the relatively larger spending cuts through the 2010s, borrowing fell almost to the G7 average in 2019, but the COVID-19 pandemic saw the UK running the second-biggest deficit among the comparator countries in 2020.
- Above-average borrowing seen again during the pandemic is forecast to continue into the medium term, with the 8th-largest deficit expected in 2029.
Debt
- The UK’s level of debt was 27% of national income below the G7 average in 2001. The subsequent increase until just before the financial crisis was in line with the average of G7 countries. However, many other comparator countries reduced their levels of debt over this period.
- Debt in the UK grew comparatively faster during and after the financial crisis, leaving it 7% below the G7 average in 2019.
- After the pandemic, the UK’s debt surpassed the G7 average for the first time since the 1980s and reached the seventh-highest level as a share of national income among the 37 comparator countries.
- Taken together, over 20-odd years and through three large shocks (the financial crisis, the pandemic and the cost-of-living crisis), debt increased by 62% of GDP between 2001 and 2023, which is the second-biggest increase among the 37 comparator countries (only after Japan, where government debt increased by 81% of GDP between 2001 and 2023).
- The forecast suggests UK government debt will continue growing and reach 5% of national income above the G7 average and 55% of national income above the average of comparator countries in 2029.
Figure 3. General government net debt
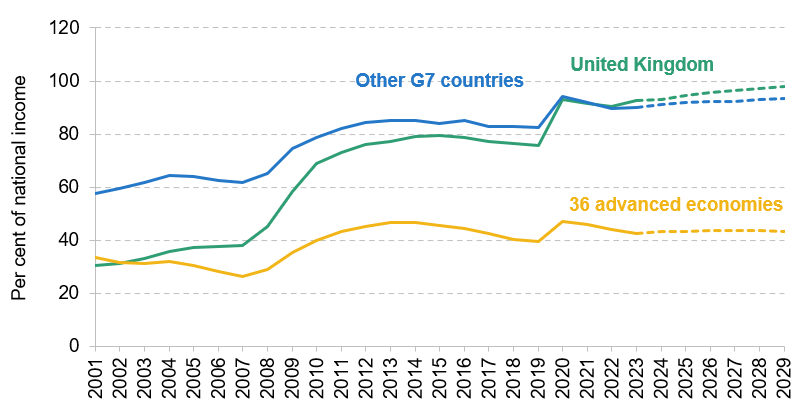
Note: Unweighted average for other countries shown.
Source: International Monetary Fund, World Economic Outlook (April 2024).
Weak growth makes fiscal choices harder
Public spending in the UK is now close to international comparators, but the relative increase in revenues has been smaller. Levels of spending and tax are never the whole story: successful fiscal policy will focus as much or more on other factors such as how to make public services more productive and how to remove unnecessary harmful distortions from the tax system. All the same, known pressures on spending on areas such as health and social care are unlikely to abate any time soon. But the economic environment suggests that public debt will be even more difficult to sustain with the current levels of spending and revenues going forward.
The UK’s per-capita growth outperformed the average of other G7 countries from 2001 until 2019 despite being hit harder by the financial crisis. But the UK is now forecast to have the seventh-smallest cumulative growth among the 37 comparator countries in the period 2019–29. With low growth (and the era of very low interest rates seemingly having come to an end), much tighter fiscal policy is needed to get debt falling. After having already increased by more than any other comparable country – with the notable exception of Japan – the IMF forecasts the UK’s debt to continue growing rather than to be stable or even decisively falling. If we want to spend similarly to other countries, we will need to tax similarly too.
Endnotes
Authors

Carl Emmerson
Carl, a Deputy Director, is an editor of the IFS Green Budget, is expert on the UK pension system and sits on the Social Security Advisory Committee.

Martin Mikloš
Martin is a research economist at TaxDev and works on taxation in developing countries.

Isabel Stockton
Isabel works in the Healthcare sector, and on the public finances. Their research focuses on retaining and developing the NHS workforce.
More from IFS
Understand this issue


Policy analysis


Academic research


