This observation has been revised to correct an error in the paragraph preceding Figure 2, shown by the crossed-out text, and the labels shown in Figures 1 & 2.
Most of us would like somebody else to pay for the public goods and services we consume. Politicians tend to give the impression that this is their intention too – often through somewhat vague references to "the rich", “the very best-off” or “those with the broadest shoulders”. However, it is rarely clear from such statements exactly who is being referred to. In this observation we provide some figures on how wealth and income are distributed in the UK to help us assess who these people might be.
The distinction between wealth and income is an important one, often glossed over. High-income people are those who receive a large flow of money over a period of time (from things like salaries, bonuses, dividends or profits for the self-employed) whereas high-wealth people are those who have accumulated a valuable stock of assets by a point in time (typically in property, pension pots or other financial assets). While there are many people with both high wealth and high incomes, the overlap is far from perfect. There are wealthy individuals with low current incomes, such as older people who own a valuable house but have little income; and there are high-income people who have accumulated little wealth, such as young renters with high-paying jobs. These groups would be among those who might want somewhat more precision from politicians who claim to have plans to increase taxes on “the richest”.
It is also often unclear from politicians’ statements how much wealth or income one should have to qualify as being rich. What might they have in mind?
Take wealth to begin with. While official statistics on the very wealthiest in society are, unfortunately, limited, unofficial data highlight that there are some extremely wealthy people living in the UK. For example, each year the Sunday Times publish a ‘Rich List’ of 1,000 individuals and families, each with estimated wealth of more than £100 million. These are clearly extremely wealthy people. However, they only represent less than 0.00002% 0.002% of the UK adult population. Most people’s idea of “the richest” is probably broader than that.
The Office for National Statistics carries out a household survey that gives a broader view of the distribution of wealth, although it does not do a good job at covering the very wealthiest, who tend not to respond to household surveys. Figure 1 plots the distribution of reported total net wealth from this survey (including the value of houses, private pension pots and financial assets, net of mortgages and other debts). It shows that being in the top 1% (around 260,000) of households in Great Britain required more than £2.9 million in total net wealth. This may well be an underestimate for the reason given above, but it is still almost 13 times as much as the median household, which sits in the middle of the wealth distribution. To be in the top 10%, a household needs to possess a more modest £1 million in net wealth: still more than 4 times the median, but only a third of the household wealth at the 99th percentile.
Figure 1. Distribution of total net wealth among households in Great Britain, 2012-14
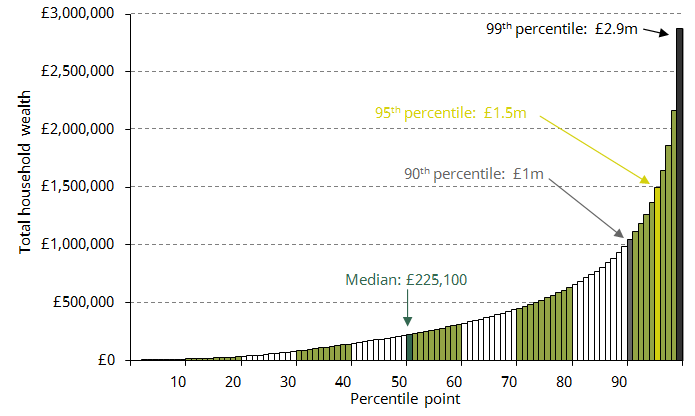
Source: ONS Wealth and Assets Survey.
Much – but by no means all – of the variation in wealth between households is a result of their being at different stages of their lives. Because people typically save during their working life and then run down their assets in retirement, such ‘lifecycle effects’ would result in substantial inequality in wealth even if everyone had the same income and spending trajectories over their lives. It is therefore not surprising that ONS figures show that 25% of individuals aged 55-64 live in a household with more than £1 million of wealth, placing them in the top tenth of households, compared to just 4% of those aged 25-34. However, there is also significant inequality in wealth between individuals of the same age (e.g. another 23% of those aged 55-64 live in a household with wealth of less than £200,000), and there is good evidence that the greater wealth of older individuals today partly represents genuine inequality in lifetime resources across generations.
What about income? Who are the highest-income people? There are different ways of answering this question depending on factors such as whether we mean the personal income of individuals (which is what the income tax system deals with) or the total income of their household, whether we measure incomes before or after tax, and which sources of income are included. Below we briefly highlight two key official data sources on different income measures.
Data collected by HMRC for income tax purposes tell us about the distribution of individual (taxable) incomes among income taxpayers. In all that follows, then, bear in mind that about 40% of adults do not pay income tax at all (i.e. their taxable incomes are too low to be included in these statistics). In 2014-15 almost 50,000 income tax payers (0.1% of UK adults) had more than £500,000 in annual pre-tax income, amounting to £55.5 billion between them. 39% of this – £21.8 billion – accrued to just 5,000 individuals; an average of £4.4 million per person among that group. This highlights the staggering degree of income inequality found at the top of the distribution.
Given these extraordinarily high incomes, it is perhaps less surprising that those with merely very high incomes do not always feel especially well off, even though they clearly are relative to the vast majority of the population. Figure 2 plots the distribution of income among individual income tax payers in 2014-15. The person at the 95th percentile of taxpayers (i.e. with an income greater than 95% of income tax payers) had pre-tax income of about £72,000 per year. There can be little question that they have a relatively high income: £50,000 per year more than that of the median income tax payer. However, it is also £90,000 per year less than someone at the 99th percentile. They might therefore be forgiven for feeling more similar to the median taxpayer, who is 23.6 13.7 million people (45 percentiles) below them in the distribution, than to the taxpayer just 2.1 1.2 million people (4 percentiles) above them.
Figure 2. Distribution of income among individual income tax payers in the UK, 2014-15
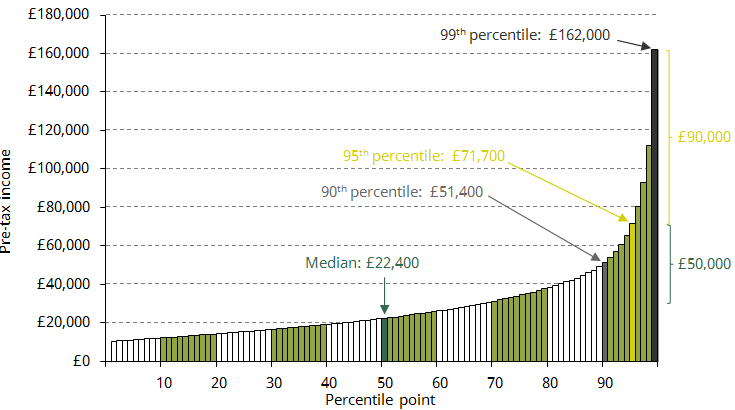
Source: HMRC Table 3.1a
Of course these figures capture income only over one year. Because income tends to vary systematically over the lifecycle (though to a lesser extent than wealth), and can be volatile from year to year, a much higher proportion of people will have relatively high incomes at some point during their lives than in any single year.
The income measure available from HMRC data is useful but limited. It does not account for the fact that people live in households of varying sizes with varying needs; or that some individuals will be the only source of income in their household, while others will be one of two or more; or that some households will have non-taxable income like certain state benefits. To get a better sense of who the best-off are in terms of living standards, we can use an income measure produced by the Department for Work and Pensions (DWP) based on an annual survey of more than 20,000 households in the UK. This measures each individual’s total household income from all sources after direct tax, and rescales (‘equivalises’) it to take into account the fact that households of different sizes and compositions have different needs (for households containing very high-income people it also applies an adjustment based on tax data, to try to deal with the problem of these people not responding well to surveys).
Figure 3 shows the household income after taxes and benefits needed to enter the top 10% and 1% on this basis for individuals in three different types of household in 2015-16. A single adult without children can be considered in the top tenth of the income distribution if they have a total annual net income of at least £33,000, whereas a couple with two children aged 14 or younger would need more than twice this (£68,800) to be in the top 10%. Similarly, to be in the top 1% on this basis, a single adult would need annual income of more than £86,000, compared to £179,800 for a couple with two children, and £128,400 for a couple without children.
Figure 3. Annual net income required to be in top 10%/1% of equivalised household income
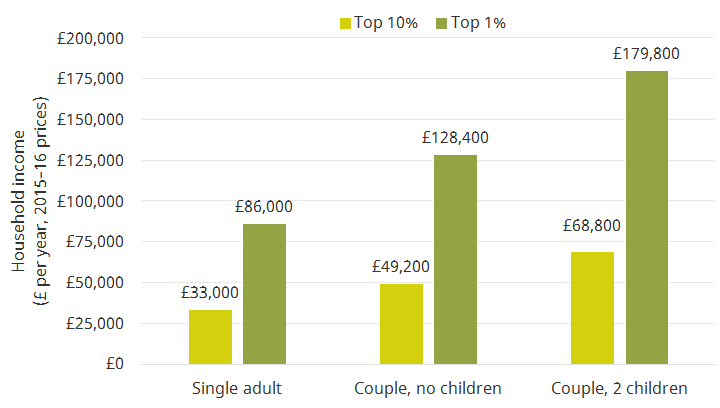
Note: Incomes are measured after taxes and benefits but before housing costs have been deducted. Children are all assumed to be under the age of 14. Figures rounded to nearest £100.
Source: Authors’ calculations for the UK using the Family Resources Survey, 2015-16.
The acceptable amount of income or wealth inequality, and the appropriate degree of redistribution carried out by the state, is ultimately a matter of political choice for governments and electorates. But such choices should be underpinned by an informed understanding of how income and wealth is actually distributed. So the next time you hear a politician or journalist talk about ‘the rich’, ask who they mean.
IFS Election 2017 analysis is being produced with funding from the Nuffield Foundation as part of its work to ensure public debate in the run-up to the general election is informed by independent and rigorous evidence. For more information, go to http://www.nuffieldfoundation.org.
Authors

Paul Johnson
Paul has been the Director of the IFS since 2011. He is also currently visiting professor in the Department of Economics at University College London.

Robert Joyce
Robert is a Deputy Director. His work focuses on primarily on the labour market, income and wealth inequality, and the design of the welfare system.

Barra Roantree
Barra is a Research Fellow at IFS and Assistant Professor of Economics at Trinity College Dublin.
More from IFS
Understand this issue


Policy analysis


Academic research


