Across England as a whole, spending by councils on social care per adult resident fell by 11% in real-terms between 2009–10 and 2015–16. Published figures suggest around six-in-seven councils made at least some cut to their social care spending per adult resident, and one-in-ten made cuts of more than a quarter.
Spending fell by most on average in London (18%) and metropolitan districts (16%) covering urban areas like Greater Manchester, Merseyside and Tyneside. More generally, cuts were larger in the north of England than the south. Cuts were also larger, on average, in areas that in 2009–10: spent more on adult social care; had higher assessed spending needs; and were more dependent on central government grants.
These are among the main findings of a new report by researchers at the Institute for Fiscal Studies, funded by the Health Foundation, which analyses official spending data on councils’ social care spending.
Other key findings include:
- There remains significant variation in councils’ social care spending across the country: spending was less than about £325 per adult resident in a tenth of council areas, while it was more than about £445 per adult resident in another tenth of council areas in 2015–16. That’s a difference of more than a third.
- Councils where there are relatively more people over pension age (particularly those entitled to means-tested benefits), and where levels of disability benefit claims and deprivation are higher, tended to spend more on social care. Higher local earnings levels are also associated with higher levels of social care spending.
- Even so these ‘spending needs factors’ only explain a small proportion of the variation in spending across councils. Indeed, councils’ ‘scores’ in the last official needs assessment in 2013–14 can only explain around 13% of the variation in what they actually spent on social care per person in 2015–16.
- In part, this may reflect inaccuracies in that needs assessment, and the fact that by 2015–16, the assessment was two years out of date. But it will also reflect that given similar needs, different councils are likely to make different trade-offs between spending on adult social care and spending on other services. And they have different overall budgets (from council tax, business rates, and grants) from which to fund their service spending.
- In addition to council spending, care recipients often contribute towards the cost of their care through fees and charges. These raise an average of £63 per adult resident, but the amount varies widely: one-in-ten councils raise less than £35 per adult resident, while a further one-in-ten raise £95 or more.
- However, there is no clear relationship between local authorities’ own spending and fee income. It is not the case that all high spenders charge lower fees, nor that all low spenders rely on high income from co-payments to meet costs.
“The spending cuts analysed in our report have been accompanied by a substantial fall in the number of people receiving social care: down 25% across England, between 2009–10 and 2013–14 alone.” said Polly Simpson, a research economist at the IFS and an author of the report. “Cuts have therefore been delivered, in part, by removing care from many people, with those still receiving care presumably those with the highest needs. What all this means for the quality of care received, the welfare of those no longer receiving care, and other services like the NHS requires further research to answer.”
“One thing that stands out in these figures are the big differences in spending per adult on social care among councils assessed to have very similar spending needs by the government” added David Phillips, an associate director at the IFS and another author of the report. “Whether this means spending needs assessments are inaccurate, or reflects differences in available funding or the priority placed on social care relative to other services or council tax levels, is unclear. But it emphasises that the government has got its work cut out in its ‘Fair Funding Review’ of how to measure different councils’ spending needs from 2019 onwards. That debate could get quite fraught.”
ENDS
Notes to editors
For embargoed copies of the report ‘National Standards, Local Risks: The Geography of Local Authority Funded Social Care 2009-10 to 2015-16’ please contact Bonnie Brimstone. The report will go live on the IFS website www.ifs.org.uk at 00.01 on Wednesday 5 April 2017.
The report was funded by the Health Foundation and is part of its Efficiency Research programme. The Health Foundation is an independent charity committed to bring about better health and health care for people in the UK. The authors also gratefully acknowledge co-funding from the Economic and Social Research Council (ESRC) Centre for the Microeconomic Analysis of Public Policy (CPP), grant number ES/M010147/1. All views reported are those of the authors, not the Health Foundation or ESRC.
Table 1. Real-terms levels of social care spending in 2009–10 and 2015–16 (both in 2016–17 prices), and changes between these years by region and council type
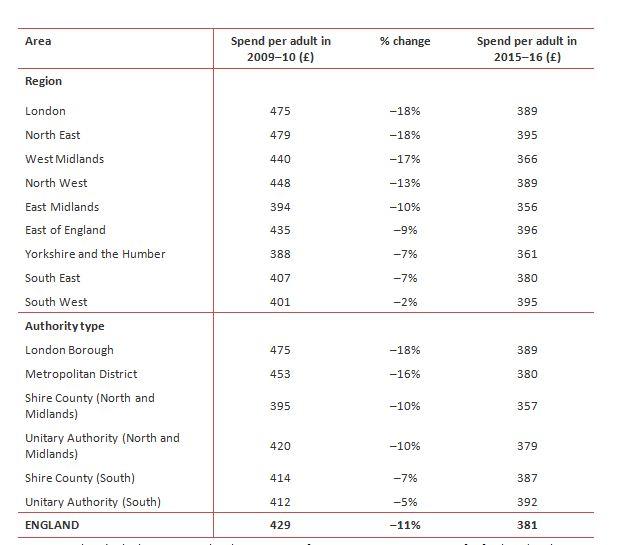
Source: Authors’ calculations using local government finance statistics. See report for further details.
The measure of expenditure used in this release (and the main measure used in the associated report) is council’s own net expenditure on social care (taken from the ‘Local authority revenue expenditure and financing England’ series) plus:
- In 2015–16, an estimate of transfers from the NHS to councils to help fund social care services as part of the Better Care Fund.
- In 2009–10, expenditure by the NHS on some services for those with learning disabilities as part of the “Valuing People Now” initiative, responsibility for which was transferred to councils from 2011–12 onwards.
These additions to councils own net expenditures are required to make figures as consistent as possible over time as responsibilities and funding arrangements change. Appendix A of the report provides further details. Net expenditure figures exclude income from fees and charges, which we report separately.
Authors

David Phillips
David is Head of Devolved and Local Government Finance. He also works on tax in developing countries as part of our TaxDev centre.

Polly Simpson
More from IFS
Understand this issue


Policy analysis


Academic research


