Official figures released yesterday told us a lot about what happened to living standards, to poverty and to inequality over Labour's 13 years in office.
- Average incomes rose by around 2% a year on average, but by only about 1% a year between 2002-03 and 2009-10;
- Child poverty fell from 27% to 21% of children between 1996-97 and 2004-2005, and then barely at all in Labour's third term. The target to halve child poverty by 2010 will be missed by a considerable margin;
- Inequality rose over the period as a whole.
Further detailed examination of the underlying data allows us to unpick the forces shaping this rise in income inequality. Much of the explanation can be found in the fast growth in the incomes of the very richest, and in particular of the incomes of just the top one or two percent. These very high earners have seen their incomes pull away from those of the large majority. Across most of the rest of the distribution inequality, if anything, actually fell a bit.
This is illustrated in the figure which shows how income grew between 1996-97 and 2009-10 at each percentile of the income distribution (100 equally sized groups of individuals ordered from poor to rich). Across the middle 80% of the distribution income growth was quite even, with slightly higher growth at the lower end. If this pattern had been repeated at the very top and very bottom of the distribution inequality would in fact have fallen.
Figure - Real income growth by percentile point in Great Britain, 1996-97 to 2009-10
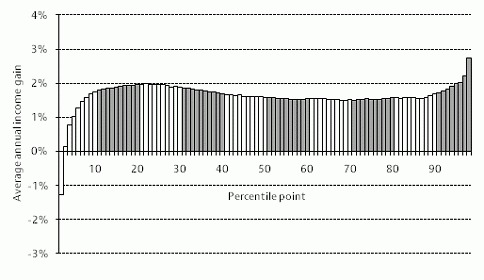
But the top and the bottom are different. The poorest 10% experienced lower-than-average growth, and the richest 10% saw very strong income growth. The very top saw the fastest growth of all. On standard measures of inequality (for example, as measured by the Gini coefficient) these changes at the extremes of the distribution more than cancelled out the inequality-reducing trends among the bulk of the income distribution. (The Gini rose from 0.33 to 0.36).
What has happened at the top is particularly important. Whilst median income (income at the middle of the distribution) rose by a total of 23% in real-terms over the period of Labour government, and mean income rose by 28%, income at 95th percentile rose by 29% and at the 99th percentile by a phenomenal 56%. In 1979 the person at the 99th percentile would have had income 3.0 times that of the median person, that had risen to 4.4 times by 1996-97 and then further to 5.6 times by 2009-10.
The good fortune of the top 1% in 2009-10 is particularly remarkable. Methodological changes make it difficult to be definitive about the precise scale of that good fortune but it is clear that this group did far better than any other and saw income increases as big as at any time in more than a decade. Using the government's new, preferred, measure the incomes of the top 1% rose by a full 13% in 2009-10 - much more than in any other year since 1997. The previous methodology would suggest an 8% increase - and even that is the biggest for nearly a decade.
Overall this increase in inequality since 1996/97 came about in spite of reforms to the tax and benefit system which mitigated underlying increases in inequality. Recall that inequality measured by the Gini rose from 0.33 to 0.36. Had there been no tax and benefit changes we estimate it would have risen to over 0.39 (if the 1997 tax and benefit system had simply been uprated in line with prices). Under Labour, spending on benefits and tax credits rose from 12% to 14% of national income. This extra spending slowed the growth in inequality - and was the main reason for the cuts in child poverty. But it could not halt inequality growth altogether, nor was it enough to meet child poverty targets.
Going forward we know with a rather depressing degree of certainty that average incomes are likely to have fallen in 2010-11 and are likely to fall further in 2011-12. Real earnings are falling, cuts to benefits and tax credits are likely to hit those on low incomes and those on high incomes will be hit by the 50p tax rate and other tax changes. It looks as though we will all share in this fall in living standards. Given the way that tax increases will affect them, it will take some really extraordinary increase in other incomes for the very richest to continue to pull away from everyone else at least in the short term. But the pressures towards increasing inequality are unlikely to halt over the medium term.


