
While oft-repeated claims that the UK is the most geographically unequal large developed country are somewhat overstated, the differences in not only economic outcomes but also health, education and public safety across places are striking. For example, across England:
- Healthy life expectancy ranges from 53.3 in Blackpool to 71.9 in Richmond-upon-Thames, while men and women from the richest tenth of neighbourhoods can expect 18.4 and 19.7 more years of healthy life, respectively, than those from the most deprived tenth of neighbourhoods.
- The share of adults smoking varies from less than 7% in Ribble Valley, Hart and Rushcliffe districts, to over 22% in Blackpool, Lincoln and Kingston-upon-Hull.
- Just 11% of people aged 27 in the Wisbech travel to work area were graduates in the mid 2010s, compared with 43% in the London travel to work area.
- The number of recorded crimes per 1,000 residents in the last year varies from 34 in Ribble Valley to 164 in Middlesbrough.
Many interrelated factors will drive these geographic inequalities. And trends can be self-reinforcing as, for example, highly educated and high-earning people move to areas with more highly skilled, high-paid jobs and better amenities, and hence many other highly educated and high-earning people. That is why making significant progress on tackling geographic inequalities is challenging and, even with the best policies, will take many, many years.
Levelling up and public services
The UK government’s ‘Levelling Up’ White Paper, published last month, acknowledges this. It also recognises that ‘levelling up’ is about more than just productivity, earnings and employment (although these are important), setting ambitious targets for both overall improvements to, and a narrowing of gaps between places in health, educational attainment, housing, crime and local pride. This broad conception of ‘levelling up’ is welcome, as well-being is about more than income, and life chances depend on a wider set of circumstances than just education.
The state and, in particular, public services have a key role to play in addressing these dimensions of inequality. The White Paper highlights a number of new initiatives including ‘Education Investment Areas’, where schools will be provided with extra funding to retain their best teachers, and the piloting of a ‘Better Health: Rewards’ scheme, which will provide rewards for healthy behaviours by certain targeted groups with poor health outcomes currently. A further paper setting out a strategy for reducing health inequalities (both geographic and more general) in particular is also promised for later this year.
But overall there is little said about one of the biggest direct levers the government has to effect levelling up: changes to how funding is allocated between places. This is an important omission because recent years have seen increasingly robust evidence emerge that the amount of funding a range of public services receive matters for the outcomes they deliver. This includes for schools, where funding seems to matter most for children from deprived backgrounds (Jackson, 2018; Gibbons et al., 2018), early years provision (Cattan et al., 2021), healthcare (Martin et al., 2008) and adult social care (Crawford et al., 2021). This suggests that access to well-funded, high-quality public services helps create the conditions in which people are able to lead long, healthy and productive lives.
Looking under the bonnet of public spending allocations
It is in this context that IFS is starting a new project, funded by the Health Foundation, to analyse in detail how spending is currently allocated between different places in England, and how and why allocations have changed in recent years.
While our analysis will naturally cover healthcare, it will also include a range of other public services, including housing, policing, schools and other local government services. This reflects the fact that a healthier population and reductions in health inequalities cannot be achieved by focusing solely on the treatment of illness. The strongest determinant of people’s health is not access to the NHS but the wider conditions in which they live, work and age. This includes: affordable, secure and well-maintained housing; opportunities for high-quality education; access to green space, leisure and culture facilities; support with caring responsibilities and needs; protection from violence and abuse; and a safety net that protects them from large and sudden falls in well-being.
We will therefore review the sources of funding and allocation methodologies for a range of key public services. To what extent are different places’ different needs for spending taken account of in funding allocations across England? How are spending needs assessed? What other objectives – such as stability in funding levels, or the provision of financial incentives to providers to tackle needs or boost their own revenues – do funding systems try to meet? Can this impede the degree to which funding is targeted where it is needed most? And how and why have funding systems changed in recent years?
We will also look at how the resulting funding allocations and spending levels vary across places. How do areas with higher and lower assessed spending needs compare? How do more affluent and more deprived areas compare? What about North versus South and urban versus rural? Our main focus will be 2019–20, the last year before the COVID-19 pandemic made its force felt, but where possible we will also look at how the geographic patterns of funding and spending have changed over time to ask: ‘Has funding policy in recent years been helping or hindering efforts to reduce geographical inequalities?’.
Council funding policy in the 2010s acted against ‘levelling up’, but there is an opportunity for change
Existing IFS research provides evidence on what has happened for at least some service areas in the 2010s – and suggests that the ‘levelling up’ agenda may require a change in direction in the 2020s.
Figure 1, for example, shows that councils’ spending on services fell by around twice as much per person (31%) in the most deprived tenth of councils as in the richest tenth of councils (16%) during the 2010s. The figure also shows that while councils across England have tried to protect social care services from the full force of the spending cuts (making much bigger cuts to other services), councils in poorer areas have nevertheless still had to make significant cuts to social care too.
Figure 1. Real-terms change in net expenditure per person, 2009–10 to 2019–20
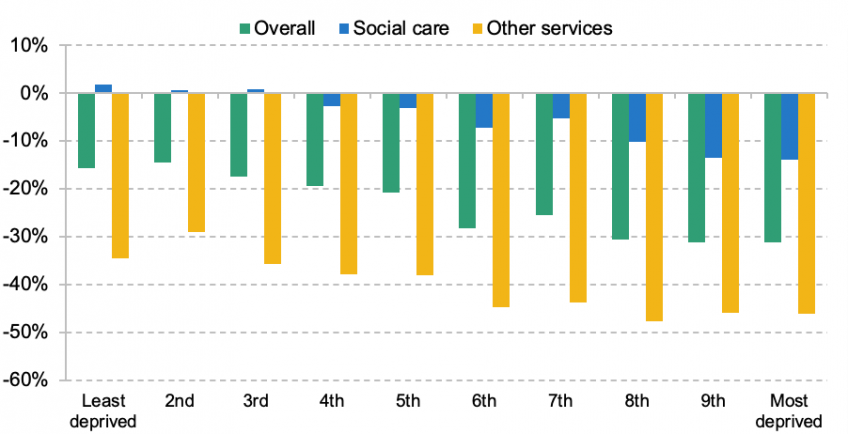
Note: Overall spending excludes education, police and fire, and public health (which was only devolved in 2013–14).
Source: Harris et al., 2019.
This pattern was driven by the fact that, particularly during the first half of the 2010s, the government did not take much account of differences in the extent to which different councils relied on grant funding when it was cutting that grant funding. This matters, as a given percentage cut in grant funding translates into a much bigger cut in overall funding for a council relying on grants for three-quarters of its funding than for one relying on them for one-third. And it is councils serving more deprived areas, with higher needs and lower property values, that tend to rely more on grant funding than less deprived areas and can offset less of the cuts through increases in council tax. Therefore cuts to grants have led to spending falling more in more deprived areas than in richer ones.
The local government funding settlement for the coming financial year, 2022–23, might represent a turning point. For the first time in over a decade, councils serving more deprived areas are set to receive a bigger boost to overall funding than councils serving less deprived areas. This reflects the fact that as grant funding has been increased, the government has chosen to provide much bigger per-capita (albeit lower percentage) increases to more deprived areas.
It remains to be seen whether this will be the start of a change in approach or simply a one-off. More details are due to be published in the ‘Fair Funding Review’, which will update how councils’ funding needs are assessed and taken account of by the local government finance system. This Review is long overdue, having been first planned to be completed by April 2019 and, as we have recently outlined, is an important opportunity for the government to be clear about its objectives for local government funding – including the role it sees it playing in the ‘levelling up’ agenda.
Schools funding reform has hit schools with more deprived pupils
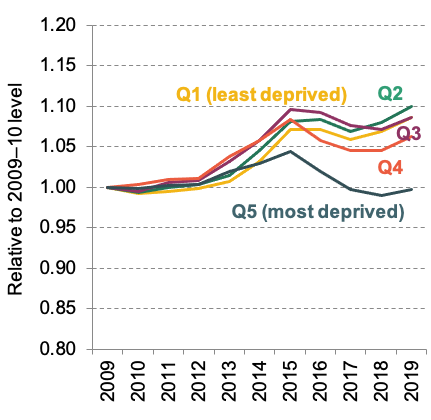
In our annual reports on education spending in England, funded by the Nuffield Foundation, we have also extensively examined patterns in school spending. This analysis shows that more deprived schools have faced larger cuts in recent years. As shown in Figure 2, spending per pupil fell by 13% in real terms between 2009–10 and 2019–20 for the fifth of secondary schools with the highest share of pupils receiving free school meals, compared with 8% for the fifth with the lowest shares. Whilst primary schools have seen more positive funding trends, a similar pattern can be seen by level of deprivation. This means that whereas in 2009–10, spending per pupil in the fifth of schools with the most deprived pupils was nearly 35% higher than in the fifth with the least deprived pupils, the difference had fallen to 23% in 2019–20.
Figure 2. Spending per pupil by quintile of eligibility for free school meals, relative to 2009–10 level
a) Primary schools
b) Secondary schools
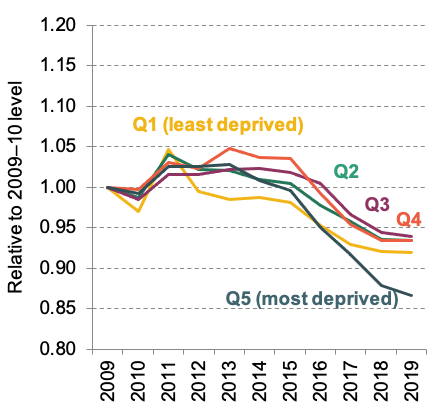
Note and source: Sibieta, 2021.
IFS research has shown that part of this was driven by the changing geography of deprivation over this period, such as reduced levels of deprivation in London, and a funding system that did not respond to these changes. Indeed, most funding for local areas was, until recently, based on what they received in the previous year, irrespective of changes in deprivation.
But that is not the full story. As can be seen, the funding position of more deprived schools saw a notable deterioration after 2015. This is the point at which the government began to stop updating the Pupil Premium in line with inflation. Then in 2018, the government introduced the National Funding Formula. This had many positive features as it ensured that funding would be updated as the characteristics of different local areas change over time. But choices made when introducing this formula, including the introduction of minimum levels of funding per pupil, have effectively redistributed funding from schools with more deprived pupils to those with less deprived pupils. For example, in 2020–21, 37% of the least deprived fifth of schools saw their funding topped up to meet the new statutory minimum levels, whereas none among the most deprived fifth of schools did.
The minimum funding levels, which have repeatedly been framed by the government as part of the ‘levelling up’ agenda, have had precisely the opposite effect. Given the scale of ambition for improving educational attainment and narrowing inequalities across areas, the government needs to consider shifting funding back to schools with more deprived pupils. Much of the narrative around levelling up has focused on the need to narrow the geographic gaps in spending on things such as transport and research & development. But this demonstrates that in other areas, such as education, achieving the government’s levelling up objectives might require bigger, not smaller, geographic disparities in spending.
Watch this space
Over the next few months, IFS researchers will build on this existing analysis, to delve deeper into the factors that have been affecting funding allocations and to cover a wider range of services, including health, housing and policing. Our work will culminate in a report and dataset of funding allocations which we plan to publish in the summer, with the aim of informing not only funding reforms already in development, but also wider plans to tackle health, education and other inequalities as part of the ‘levelling up’ agenda.
Authors

Luke Sibieta
Luke is a Research Fellow at the IFS and his general research interests include education policy, political economy and poverty and inequality.

David Phillips
David is Head of Devolved and Local Government Finance. He also works on tax in developing countries as part of our TaxDev centre.

Ben Zaranko
Ben is a Senior Research Economist and an editor of the IFS Green Budget. His work focuses on the health and social care system and UK fiscal policy.

Kate Ogden
Kate joined the IFS in 2020 and works on local government finance and higher education.
More from IFS
Understand this issue


Policy analysis


Academic research


