Last week the IFS published research analysing the significant effects that the COVID-19 crisis and associated public health restrictions are having on consumer behaviour and spending in different parts of the UK.
This research shows that while the first lockdown in Spring was associated with a one-third fall in consumer spending, England’s November lockdown was associated with a much more modest fall in spending. This suggests that there has been a further shift to delivery and collection services, including via the internet, helping mitigate the impact of lockdown for consumers.
However, the extent to which such shifts mitigate impacts on local economies is likely more modest: many online vendors have only a limited presence in most local areas. Indeed, if consumers stick with their new habits, such shifts may actually hurt some high street businesses once we emerge from the pandemic.
These short and potential long-term changes in consumer behaviour matter not only for the businesses directly affected though, but other stakeholders in local economies such as councils. They have, for example, been tasked with targeting grants at businesses adversely affected by public health restrictions, and have long sought to support the vibrancy of high streets. Furthermore, councils’ revenues depend to some extent on local economic activity – via business rates receipts, and the amount raised via fees and charges for a range of services that they provide to businesses and consumers, most obviously car parks and leisure centres.
So, what are the implications of this new research for councils?
Understanding the impacts of public health restrictions on consumer behaviour
First, this research provides important evidence on the impact of different levels of public health restrictions on consumer behaviour. This in turn can help guide decisions on how much support to provide to businesses in areas operating under different rules.
Figure 1 shows that in broad terms, rules stopping households mixing indoors have limited effects on spending – with even spending on restaurants and recreation falling by just 8% compared to what would be expected with previous ‘rule of six’ and social distancing in place. This could be because demand is already reduced by social distancing measures, so that preventing household mixing makes little further difference. And some cafes, restaurants and pubs offer takeaway services, helping to boost spending. It may also reflect the impact of broader social distancing regulations on capacity, which may mean that at least some venues have more demand than they can accommodate at certain times of the day: with restrictions on household mixing they have to turn fewer customers away instead of seeing a fall in sales. And we cannot rule out less-than-full compliance with the rules.
Closure of hospitality and recreation venues unsurprisingly has considerably larger effects, reducing spending on restaurants and recreation by over a quarter, and footfall to retail and recreation destinations by almost a fifth. Closure of non-essential retail too increases these falls to about one-third and 40%, respectively. That the falls are not even larger will reflect a range of factors – including the provision of takeaway and collection services, and people travelling outside of their area to places where venues remain open (potentially in breach of rules).
Figure 1. The impact of restrictions on restaurants and recreation spending and retail and recreation footfall
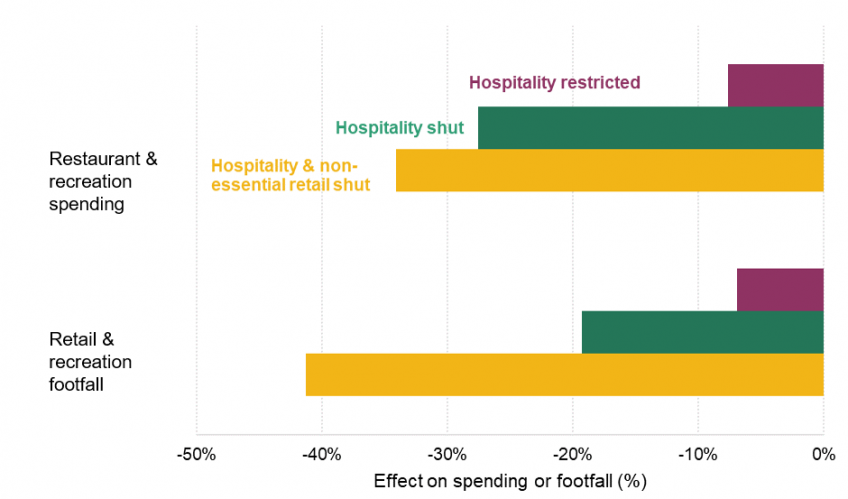
Source: See Figures 5.1 and A.13 in https://www.ifs.org.uk/publications/15229. ‘Hospitality restricted’ includes bans on households mixing indoors in hospitality venues or hospitality venues having to close from late afternoon. ‘Hospitality shut’ refers to the closure of hospitality venues to customers, and ‘Hospitality and non-essential retail shut’ to the further closure of non-essential retail venues (e.g. clothes shops).
Unsurprisingly these findings suggest that the overall hospitality and recreation sector is likely to need much more modest financial support when restrictions on mixing are in place, than when physical venues are forced to close: the latter has a far bigger impact on sales.
The picture is likely to vary across specific sub-sectors (such as bars versus restaurants versus cinemas) and across different types of places (such as city centres versus suburbs). Unfortunately, modest sample sizes and other limitations with the data currently available to us prevents us looking in depth at this variation – but other, more granular, spending data are available, and would be a useful tool for national and local government. Further research could also consider the impact of changes to public health restrictions since the end of England’s national lockdown this month – data for which are only just becoming available.
Illustrating how some areas – especially major cities – have been hit harder by behaviour change
While our data do not allow us to undertake highly geographically disaggregated analysis, they do allow us to look across regions and councils with different characteristics – and even individual councils in the case of footfall data.
Overall consumer spending has fallen by more for residents of the South, and especially London, than it has for residents of the Midlands, North, Wales and Scotland; and by more for residents of councils where wages are higher-than-average and deprivation lower-than-average. This is likely to reflect, in part, the fact that more affluent households – who are concentrated in the South of England – spend a larger share of their budgets on the types of services (like hospitality and leisure services) that have been restricted as a result of the crisis.
But people don’t spend all their money where they live – and some places, like the centres of major cities, rely significantly on spending by commuters and visitors. And footfall to retail and recreation destinations in major cities has fallen much more than in the rest of the country, as illustrated in Figure 2.
Figure 2. Footfall to retail and recreation destinations in different types of places
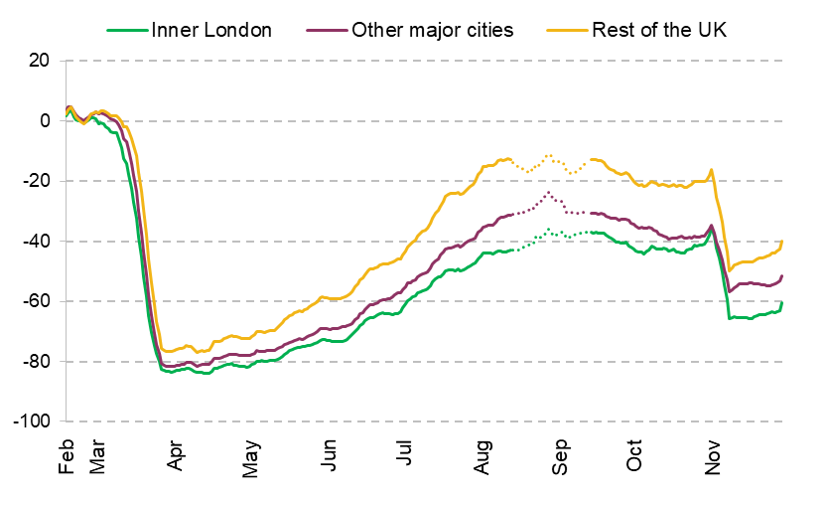
Source: Authors’ analysis of Google mobility data downloaded on 8 December 2020.
Note: Seven-day rolling average of Google mobility trends data, which measure percentage point change in visits and length of stay relative to a baseline in January 2020. Region figures are means of mobility trends for lower-tier local authority areas, weighted by mid-2019 resident population. Missing data for many areas between 17 August and 10 September mean trends over this period are not comparable with trends in the rest of the year. ‘Other Major Cities’ includes Birmingham, Bristol, Cardiff, Edinburgh, Glasgow, Leeds, Liverpool, Manchester, Newcastle and Sheffield.
Footfall to retail and recreation destinations fell by around 80% in April across the UK, but then recovered much more slowly in major cities. It remained 45% below pre-crisis levels in inner London and 35% below in other major cities by August, compared to 15% below outside major cities. All areas in England saw another hit of 20 to 30 percentage points in the second national lockdown in November.
Other research has found a similar pattern. The Centre for Cities High Street Recovery Tracker, for example, looks at trends in footfall and spending at physical vendors in 64 city and town centres across the UK. This finds bigger falls and much more partial recoveries in the centre of big cities where ‘retail tourism’ (i.e. visiting specifically to shop) and especially commuting are particularly important. For example, in early November just before England’s second lockdown, footfall was down almost 70% in London city centre, and down around 60% in Manchester and Birmingham city centres. And spending was down 40 – 45% in these centres. In contrast, spending in the centres of places like Huddersfield, Warrington, Birkenhead, Portsmouth and Mansfield was close to pre-COVID crisis levels.
This suggests consumer-facing businesses in the centre of the UK’s major cities may need particular financial support. They may also struggle in the longer-term if changes in commuting and shopping behaviours engendered by the pandemic persist. This would overturn what had been the received wisdom previously – that the centres of major cities were likely to need less support than smaller cities and towns, especially in deprived areas. If this is the case, both central and local government may need to rethink their regeneration plans.
Tracking these trends – and the impacts on local economies – is an important avenue for future research. Longer run impacts are also likely to have impacts on the commercial property market – with capital values, rents and business rates yields all likely to see substantial changes.
Examining the implications for some of councils’ own sales and commercial income
Councils are also being affected more directly by changes in consumer behaviour – through changes in incomes from charges for services that they or their commercial partners provide to the public, including car parks and council-owned gyms and leisure centres.
Figure 3 shows trends in spending on car parking and gyms up until late November. Of course, councils aren’t the only, or in the case of gyms even the main, providers of such services. But the proportional change in overall spending on these items is likely to be at least somewhat informative about the trends councils and their partners are facing.
Figure 3. Spending on car parking and gyms (Jan-Feb 2020 = 100)
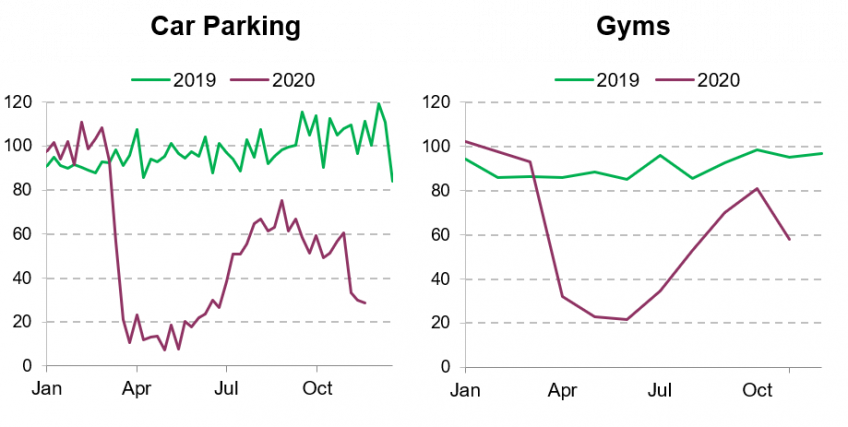
Note: Spending on car parking is weekly, and on gyms is monthly to account for monthly memberships.
Source: Authors’ calculations using Money Dashboard data downloaded on 11 December 2020.
The figure shows that spending on parking fell to just 10% of normal levels during the Spring lockdown, and even during the maximum relaxation of rules at the height of summer, was still running at just 60% to 70% of usual levels. It was around 30% of usual levels in November, during England’s second lockdown. The Figure also shows a broadly similar pattern for spending on gyms, with spending having fallen by June to around 20% of pre-crisis levels, recovering until October, before falling to around 60% of pre-crisis levels in November.
It’s notable that both types of spending fell substantially less during England’s second lockdown than during the first. For parking, this may reflect the fact that the second lockdown was less strict – the ‘stay at home’ requirement was softer, and more venues offered takeaway and collection services. But gyms were closed, so in this case the smaller fall may reflect inertia on the part of consumers, who perhaps didn’t, or couldn’t, pause or cancel memberships for this shorter lockdown. However, this means that the fall in spending at council-owned gyms and leisure facilities specifically was likely significantly larger, as less of this spending would be in the form of monthly membership fees, and more in the form of ‘pay as you go’ fees. But taken together, the figures for spending on parking and gyms suggest that the second lockdown had a smaller effect on councils’ own income than the first.
Councils are also being compensated for 75% of losses in income from sales, fees and charges, once losses exceed 5% of expected revenue, until June next year. Beyond that, the outlook for such income will depend on the extent to which changes in behaviour during the COVID-19 crisis. Expectations are that at least some of the impacts on commuting and working arrangements, and shopping, will persist, changing the types of places which can raise income from parking, and reducing parking income in the longer term in many. However, it seems less likely that there will be significant long-term impacts on income from gyms, leisure and cultural facilities.
As with broader impacts on local economies, impacts on councils’ income streams are likely to differ across the country, although again the behaviour of local residents and commuters and visitors could differ significantly. For example, the fact that spending on parking by residents of inner London has held up more than by residents of the rest of England, need not imply that parking income of councils in inner London has held up better. Again, there is scope for further research, making use of data that can be broken down by place of purchase, rather than place of residence, and councils’ own revenue forecast and outturns data. We will be analysing the latter, as it becomes available.
Authors

David Phillips
David is Head of Devolved and Local Government Finance. He also works on tax in developing countries as part of our TaxDev centre.

Kate Ogden
Kate joined the IFS in 2020 and works on local government finance and higher education.
More from IFS
Understand this issue


Policy analysis


Academic research


