It’s one of the biggest social changes we’ve seen in the past 25 years. Poverty, long associated with being out of work and with old age, is now mostly a phenomenon experienced by people who are actually in work or who are living in a household where someone is in work.
Back in the mid-1990s, just under 40 per cent of those in poverty, as measured against the semi-official definition of having less than 60 per cent of median income, lived in working households. Today nearly 60 per cent of those in poverty live in such a household.
Of course, we can disagree about exactly what level of income constitutes a poverty line, so, if you prefer, we can just ask why it is that so many more of those towards the bottom of the income distribution now live in working households. Some work published last week by my colleagues at the Institute for Fiscal Studies throws some fascinating light on this question.
Oddly enough, there is actually some good news wrapped up in this. One reason a higher fraction of those on the lowest incomes are in work is simply that there are more people in work and far fewer households with nobody in work than used to be the case.
Actually, this is a triumph that we celebrate all too infrequently. I’m old enough to remember the social policy debates of the 1980s and 1990s. The big worry then was about the number of households in which nobody worked, whether because of unemployment, disability or lone parenthood. This number has almost halved since then from just under a fifth of working age households to just over a tenth. Back then, only about a third of lone parents were in work, compared with about two thirds today.
Increasing pensioner incomes have had a similar effect. Fewer pensioners are poor than ever before. Indeed, pensioners are now less likely to be poor than are those of working age. Again, that is quite a triumph, though, as ever, public understanding takes a while to catch up. Even the over-75s have incomes almost as high on average as younger people. That makes the case for universal provision of, for example, free TV licences for this group much harder to make than it would have been a generation ago, despite the angst that their proposed withdrawal has caused.
So altogether two thirds of that increase in the fraction of the poor who are in work has been caused by this good news elsewhere in the population. Even so, there has been a big rise in the fraction of working people who are poor. Of those living in working households, about one in eight was in poverty in the 1990s; today that’s more than one in six.
Two rather more worrying trends bear much of the responsibility. The first, unsurprisingly, is that earnings have risen a lot less quickly towards the bottom of the distribution than towards the top. Some of the very highest-earning households today have total gross earnings 60 per cent or 70 per cent higher than similar households 20 years ago. At the bottom, the growth has been only about 10 per cent. A lot, though by no means all, of this is down to changes in hours worked rather than in hourly earnings. More women are working and working full-time in better-off households and, for the first time ever, a lot of low-paid men are working part-time.
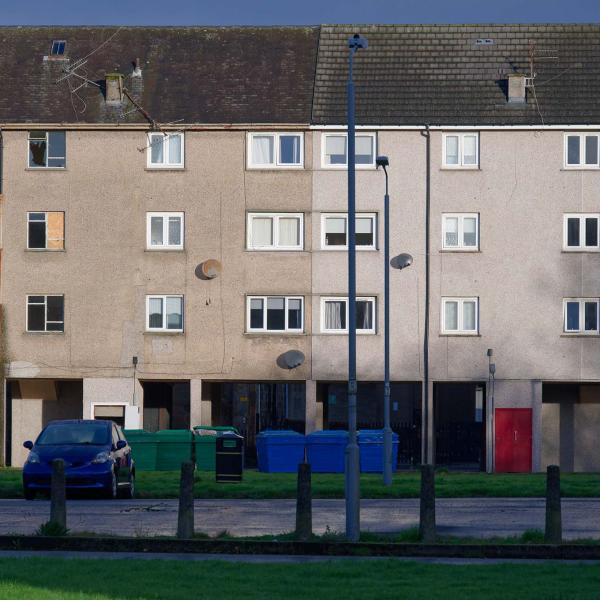
The second, and perhaps the more worrying, trend has been the way in which housing costs have risen far faster for poorer households than for richer ones. The young and the poor increasingly live in privately rented accommodation. Home ownership rates among the 40 per cent of working households with the lowest incomes have fallen by more than a third in 25 years. That’s a pretty shocking statistic and shows that this is a change by no means confined solely to the poorest workers. That, combined with rising rents and falling mortgage rates, means that low-earning households have housing costs a good 50 per cent higher than they were 20 years ago, while housing costs for the highest-earning households have not risen at all, on average.
Of course, that average hides a lot of variation, but the lessons are stark. Largely through a series of accidents, our housing market has rewarded the better off and punished the poor. We’re not going to be able to fix in-work poverty without doing something serious about housing.
No doubt you’ll want to know who’s to blame for all this. I’ve been talking about the whole period since the mid-1990s. Most of the increase in in-work poverty happened between 1995 and 2008 as rents rose and household earnings became more dispersed. It would have grown a whole lot more if the tax credit system hadn’t become a great deal more generous. Since 2010, by contrast, cuts in those benefits have been largely responsible for the continuing increases in in-work poverty rates. Remember, though, that the in-work benefit system is still very much more generous today than it was before 1997.
On the bright side, if one looks at overall relative poverty rates, not just among workers, they have at least not risen since 2010. And on some measures, considering, for example, the range of necessities that households say they can’t afford, they have fallen quite significantly.
Making a difference to the main measure of in-work poverty will require action on several fronts. The minimum wage is rising fast. But without more hours worked for low-earning households, support from the benefit system and, above all, a radical change in the housing market, this won’t be nearly enough to turn the tide.


