Debates about welfare policy often discuss benefit recipients as though they are a fixed, relatively small group of people. In reality, people’s circumstances fluctuate frequently over their lifetimes, often dramatically and in ways that matter hugely for entitlements to benefits. People’s health changes, they move in and out of work, their earnings vary, and children come and go. In new research published today in the Journal of Economic Inequality, IFS researchers use data which tracks the same individuals over long periods of time to provide a longer-run perspective on people’s interactions with the benefits system. Two key findings are that:
- While only about a fifth of people report receiving one of the UK’s main working-age means-tested benefits at any one time, more than half do so over an 18-year period;
- While out-of-work benefits look much more effective at directing money to the poorest in any one year, looked at over a lifetime work-contingent benefits are at least as effective at supporting the lifetime poor.
This observation discusses the key findings in more detail.
A snapshot in time can miss important changes
First, the data show that people’s circumstances are subject to so much change that summaries of who gets what at a snapshot in time can miss a huge amount of what’s going on. For example, while at any point in time only about a fifth of individuals report being in a family receiving one of the UK’s main working-age means-tested benefits, more than half of people report receiving such a benefit at some point over an 18-year period (the longest observable using this data). Because these estimates are based on survey data, which tends to under-record benefit claims, the true figure is likely to be higher still1.
This tells us that the working-age benefits system is actually providing support to a very broad group of people - the majority, in fact. It’s just that this support is typically concentrated during particular stages of life (for example, when one has dependent children, or is experiencing a spell of unemployment or low earnings), and people pass through those stages at different points in time. Considered together with the tax system, which people tend to pay into more during periods of higher income, much of what the system is doing is redistributing resources across periods of life, rather than between individuals.
Of course this redistribution across life is even greater when one considers the retirement period too – a stage in which many people start receiving cash transfers from the state after being net contributors to the system during their working lives.
Clearly, this sense of perspective is important. Having an accurate sense of what the benefits system is really doing from a lifecycle perspective is necessary if one is to have sensible debates about its (subjective) fairness.
A lifecycle view can help us better understand effects of policies
In addition, taking a lifecycle rather than a snapshot view of who gets what can lead us to very different conclusions about the relative effects of different policy options. Consider a government contemplating equally costly increases to out-of-work benefits (e.g. jobseeker’s allowance) and work-contingent benefits (e.g. Working Tax Credit). When assessed at a snapshot in time, increases to out-of-work benefits appear easily the more progressive: as Figure 1 below shows, gains from such a reform are concentrated among the lowest income tenth (decile) of individuals. This is unsurprising, as those who are currently out-of-work tend to be much lower down the income distribution at that snapshot in time than those currently in paid work.
Figure 1: Snapshot distributional impact of reforms
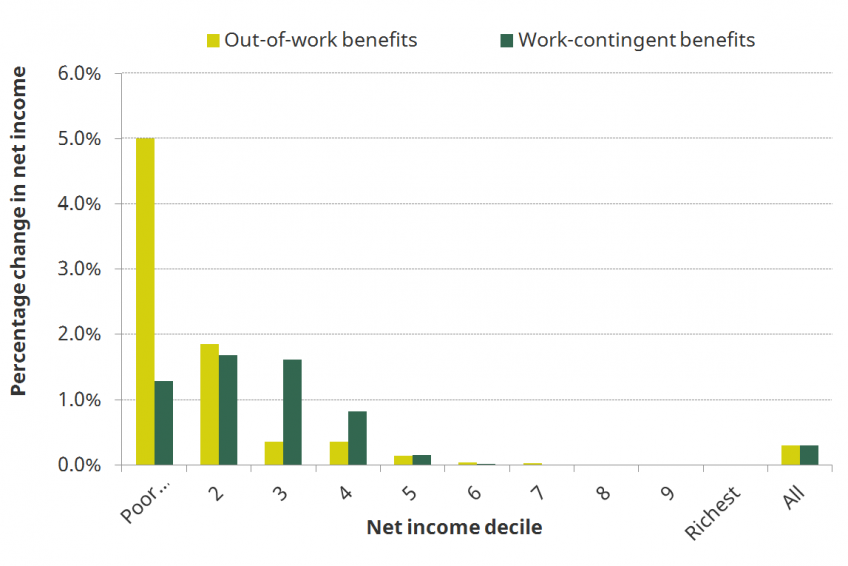
Source: Figure 10 in Levell, P., Roantree, B., and Shaw, J., (2017). ‘Mobility and the lifetime distributional impact of tax and transfer reforms’. IFS Working Paper (W17/17). Note: Deciles are defined on the basis of cross-sectional equivalised net household income. The height of the bars show gains as a percentage of the relevant decile’s total net (unequivalised) household income. ‘Non-employment benefits’ series shows the effect of a 16.5% increase in maximum income support, (income-based) jobseeker’s allowance and (non-contributory) employment support allowance. The ‘work-contingent benefits’ series shows the effect of an 18% increase in maximum working tax credit. In both cases, the baseline tax and benefit system is the April 2015 system. All individuals face the same system throughout life uprated in line with average earnings (AEI). To aid comparison, we have scaled gains proportionally such that the ‘All’ bars are the same across reforms.
However, many people on out-of-work benefits at one point in time are out of work temporarily and are in fact not at the bottom of the lifetime income distribution: they had higher incomes in the past or will have higher incomes in future. Conversely, many of those with the lowest lifetime incomes tend to spend much of their working-age life in paid work. As a result, they will still, on average, gain considerably from increases to work-contingent benefits. Figure 2 below shows that when gains are instead assessed over a whole lifetime (using a simulation approach), we obtain a very different impression to that obtained from a snapshot: the distributional impacts of out-of-work and work-contingent benefits now look very similar.
Figure 2: Lifetime impact of reforms
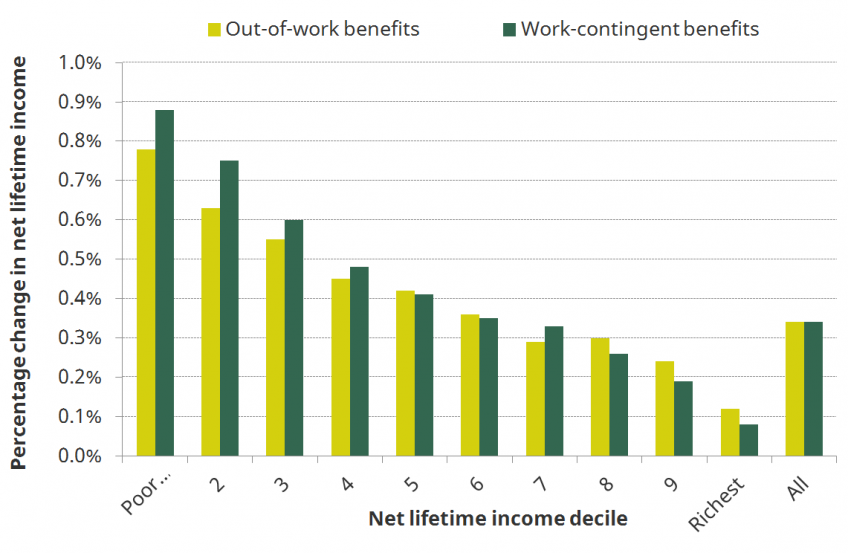
Source: Figure 10 in Levell, P., Roantree, B., and Shaw, J., (2017). ‘Mobility and the lifetime distributional impact of tax and transfer reforms’. IFS Working Paper (W17/17). Note: ‘Non-employment benefits’ series shows the effect of a 16.5% increase in maximum income support, (income-based) jobseeker’s allowance and (non-contributory) employment support allowance. The ‘work-contingent benefits’ series shows the effect of an 18% increase in maximum working tax credit. In both cases, the baseline tax and benefit system is the April 2015 system. All individuals face the same system throughout life uprated in line with average earnings (AEI). To aid comparison, we have scaled gains proportionally such that the ‘All’ bars are the same across reforms.
Being clear about distributional objectives is crucial for policy
Ultimately, the distributional patterns shown by both Figure 1 and 2 are of interest. One of the basic functions of the welfare system is to provide a safety net for those in short-term hardship, so we do care about snapshot distributional impacts as well as longer-term ones. But this does highlight how important it is for policymakers to be clear about whether the distributional objective behind a given policy changes is the alleviation of short-term hardship or the redistribution of lifetime resources. While there may be good reasons to pursue both, the most effective policy option, and the individuals who will be affected, can depend greatly on which is prioritised.
End Notes
1. In addition, as these estimates are based on 18 consecutive snapshots of data, they will miss short benefit claims occurring between waves
Authors

Robert Joyce
Robert is a Deputy Director. His work focuses on primarily on the labour market, income and wealth inequality, and the design of the welfare system.

Barra Roantree
Barra is a Research Fellow at IFS and Assistant Professor of Economics at Trinity College Dublin.
More from IFS
Understand this issue


Policy analysis


Academic research


