
Today, the Department for Work and Pensions released the latest official statistics on household incomes, covering the second year of the pandemic (April 2021 to March 2022). Viewed on its own, this year saw a small (0.5%) rise in incomes for households in the middle of the income distribution as social distancing measures were lifted and the labour market recovered. But the end of the £20 per week universal credit uplift pushed down incomes for those at the bottom of the income distribution in the second half of the year.
These changes were a reversal – but only a partial one – of the patterns seen in the first half of the pandemic. Taken as a whole, the first two years of the pandemic led to declining incomes among middle- and higher-income households, and rising incomes among poorer households. These data provide important context for how households were faring as they entered the cost of living crisis and in this comment, we analyse what they imply for living standards, poverty, and inequality.
Average incomes
Figure 1 shows median (middle) household income (after taxes and benefits) in the UK since 2002–03, both before housing costs are deducted (BHC) and after (AHC). Incomes for all years are expressed in 2021–22 prices, with data from earlier years adjusted using consumer price inflation. We use ‘equivalence scales’ to account for differences in household size, and represent incomes in terms of the equivalent amount for a childless couple. In 2021–22, median BHC income rose by 0.5% (£160 a year for a childless couple) while median income measured AHC increased by 1.6% (£410 a year). This represents a partial undoing of the fall in median incomes seen during the first year of the pandemic, leaving BHC incomes 1.2% below their pre-pandemic peak and AHC incomes 0.2% above. When compared to the scale of the disruption over this period, these changes seem quite modest.
Figure 1. Median disposable household income, 2002–03 to 2021–22
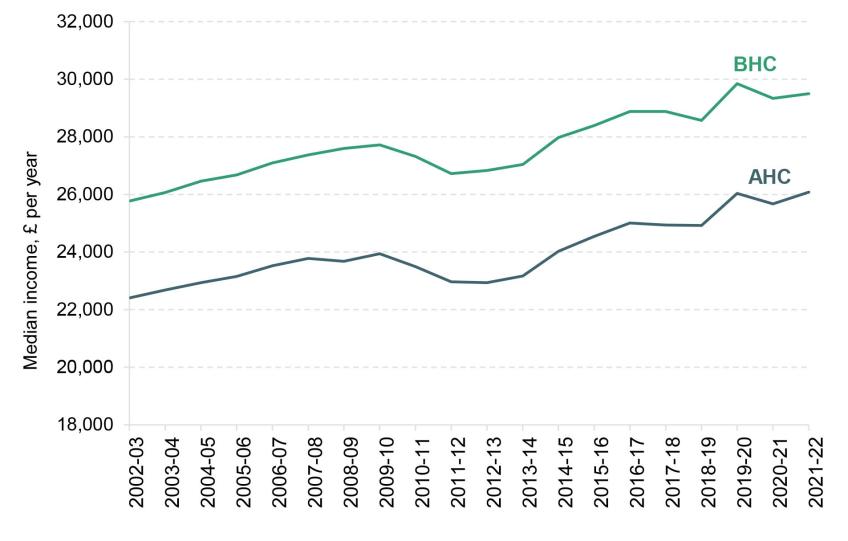
Note: Incomes have been measured net of taxes and benefits, and are expressed in 2021-22 prices. All incomes have been equivalised using the modified OECD equivalence scale and are expressed in terms of equivalent amounts for a childless couple.
Source: Department for Work and Pensions, ‘Households Below Average Income: An analysis of the UK income distribution: FYE 1995 to FYE 2022’
Income inequality
Whereas the previous figure showed trends for middle income households, we now turn to studying how households across the distribution fared. Figure 2 presents the average yearly growth in household income (BHC) for each percentile of the income distribution, across various periods. Incomes generally fell for households near the bottom of the distribution and rose moderately for those in the middle, while patterns were somewhat more mixed towards the top. Again these were, in broad terms, a partial reversal of the patterns seen in the first year of the pandemic. For example, household income at the 10th percentile grew by 3.8% in the first year of the pandemic, then fell by 1.9% in the second year – with the introduction and expiry of the temporary £20 uplift in universal credit a key driver.
Overall income inequality across the distribution in 2021–22 was approximately the same as in 2020–21 by most measures, but slightly down on 2019–20. However, this was to a significant extent driven by middle- and high-income households seeing declines in their income. Between 2019–20 and 2021–22, incomes fell slightly for approximately the top two-thirds of the income distribution. The incomes of the poorest third, while not growing very significantly, were shielded from such declines.
Income poverty
Figure 3 shows absolute poverty rates, after housing costs are deducted, for different groups since 2002–03. This measure compares household incomes to a poverty line that is fixed in real terms over time, meaning that it only changes by inflation each year. Between 2020–21 and 2021–22 absolute poverty was broadly stable, rising slightly from 16.8% to 17.1% across the whole population, still leaving it below its 2019–20 value. The small uptick in the last year was driven by pensioner poverty. For all groups though, any rise in poverty in 2021–22 did not fully offset the declines seen during 2020–21, meaning that in each case absolute poverty has decreased, albeit slightly, over the pandemic. It is important to note that many of the income declines seen amongst poorer households between 2020–21 and 2021–22 (documented in Figure 2) were among households who were already below the poverty line. Such declines do not affect measured poverty rates.
Figure 3. Absolute poverty (AHC), 2002-03 to 2021-22
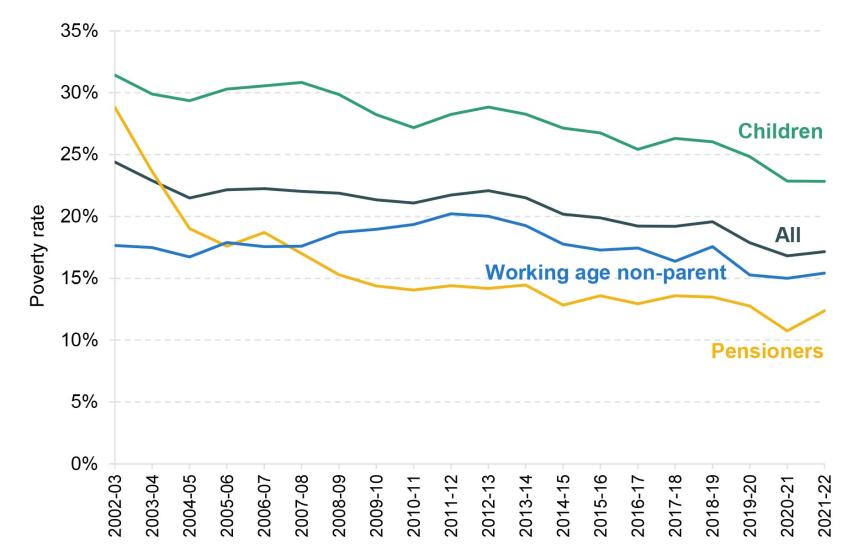
Note: Incomes have been measured after housing costs are deducted. See figure 1 for source and other notes.
Figure 4 shows trends in relative poverty, which measures the fraction of people whose household income is below 60% of the contemporaneous median. The latest year of data shows a rise across all groups, most notably among pensioners and children. The reason for this can be seen in Figure 2 – incomes increased at the median while falling around the poverty line. Taking the two years since the pandemic together, the overall effect on relative poverty rates was close to zero. Rising inflation and the end of economic support schemes during 2021–22 has meant that the substantial falls observed in 2020¬–21 were mostly erased a year later.
Figure 4. Relative poverty (AHC), 2002-03 to 2021-22
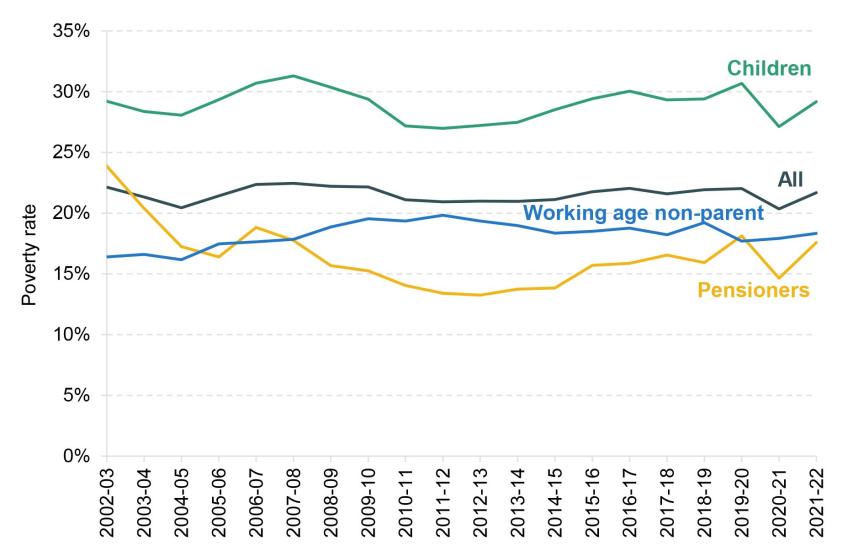
Note: Incomes have been measured after housing costs are deducted. See figure 1 for source and other notes.
Conclusion
The second year of the pandemic saw the recovery of the labour market as the last social distancing restrictions were lifted, and government support schemes including furlough and the universal credit uplift were wound down. In broad terms, the labour market recovery boosted incomes around the middle of the distribution, while the removal of the uplift reduced incomes around the bottom.
These patterns undid some, but not all, of those seen in the first year of the pandemic.
Another key part of the economic story of 2021–22 was the beginning of the high inflation period that we now find ourselves in. One important caveat to the statistics presented here is that they do not reflect differential inflation rates faced by households. Since the rise in inflation has been heavily driven by energy, and since low-income households spend a larger share of their budget on energy, their ‘true’ inflation rate is likely higher – and therefore their real incomes likely lower – than is reflected in the numbers presented here.
High inflation since the start of 2022 means that we are likely to see declines in income across the distribution in 2022–23. On average, earnings have not kept pace with price rises, and benefits – which are uprated with a lagged measure of inflation – have fallen sharply in real terms. While various grants will attenuate this effect, it would not be surprising to see poverty rates rise above their pre-pandemic levels.
This comment was written as part of a project funded by the Joseph Rowntree Foundation (JRF), 'Living standards, poverty and inequality 2021-2023' (grant reference 210101A). The views expressed in it are, however, those of the authors and not necessarily those of the Foundation. A report into household incomes and income poverty during the pandemic, and in-depth research into other trends facing low income households, funded by JRF, will be published in the Summer. Co-funding from the ESRC-funded Centre for the Microeconomic Analysis of Public Policy (ES/T014334/1) is gratefully acknowledged.
Authors

Sam Ray-Chaudhuri
Sam joined the IFS in 2022 and works as a research economist in the Income, Work and Welfare sector.

Tom Waters
Tom is an Associate Director at the IFS and Head of the Income, Work and Welfare sector.

Tom Wernham
Tom is a Research Economist in the Income, Work and Welfare sector, having joined the IFS in 2020.
More from IFS
Understand this issue


Policy analysis


Academic research


